| Issue |
A&A
Volume 499, Number 2, May IV 2009
|
|
|---|---|---|
| Page(s) | 503 - 513 | |
| Section | Interstellar and circumstellar matter | |
| DOI | https://doi.org/10.1051/0004-6361:200810905 | |
| Published online | 04 December 2008 | |
Imaging galactic diffuse clouds:
CO emission, reddening and turbulent flow in the gas around  Ophiuchi
H. S. Liszt1 - J. Pety2,3 - K. Tachihara4
1 - National Radio Astronomy Observatory,
520 Edgemont Road,
Charlottesville, VA,
USA 22903-2475, USA
2 - Institut de Radioastronomie Millimétrique,
300 rue de la Piscine,
38406 Saint-Martin d'Hères,
France
3 - Observatoire de Paris,
61 Av. de l'Observatoire, 75014 Paris,
France
4 - National Astronomical Observatory of Japan,
2-21-1, Osawa, Mitaka, Tokyo 181-8588,
Japan
Received 2 September 2008 / Accepted 20 November 2008
Abstract
Context. Most diffuse clouds are only known as kinematic features in absorption spectra, but those with appreciable H2 content may be visible in the emission of such small molecules as CH, OH, and CO.
Aims. We interpret in greater detail the extensive observations of 12CO emission from diffuse gas seen around the archetypical line of sight to ![]() Oph.
Oph.
Methods. The 12CO emission is imaged in position and position-velocity space, analyzed statistically, and then compared with maps of total reddening
![]() and with models of the C+ - CO transition in H2-bearing diffuse clouds.
and with models of the C+ - CO transition in H2-bearing diffuse clouds.
Results. Around ![]() Oph, 12CO emission appears in two distinct intervals of reddening centered near
Oph, 12CO emission appears in two distinct intervals of reddening centered near
![]()
![]() 0.4 and 0.65 mag, of which
0.4 and 0.65 mag, of which ![]() 0.2 mag is background material. Within either interval, the integrated 12CO intensity varies up to 6-12 K km s-1, compared to 1.5 K km s-1 toward
0.2 mag is background material. Within either interval, the integrated 12CO intensity varies up to 6-12 K km s-1, compared to 1.5 K km s-1 toward ![]() Oph. Nearly 80% of the individual profiles have velocity dispersions
Oph. Nearly 80% of the individual profiles have velocity dispersions
![]() < 0.6 km s-1, which are subsonic at the kinetic temperature derived from H2 toward
< 0.6 km s-1, which are subsonic at the kinetic temperature derived from H2 toward ![]() Oph, 55 K. Partly as a result, 12CO emission exposes the internal, turbulent, supersonic (1-3 km s-1) gas flows with especial clarity in the cores of strong lines. The flows are manifested as resolved velocity gradients in narrow, subsonically-broadened line cores.
Oph, 55 K. Partly as a result, 12CO emission exposes the internal, turbulent, supersonic (1-3 km s-1) gas flows with especial clarity in the cores of strong lines. The flows are manifested as resolved velocity gradients in narrow, subsonically-broadened line cores.
Conclusions. The scatter between N(CO) and EB-V in global, CO absorption line surveys toward bright stars is present in the gas seen around ![]() Oph, reflecting the extreme sensitivity of N(12CO) to ambient conditions. The two-component nature of the optical absorption toward
Oph, reflecting the extreme sensitivity of N(12CO) to ambient conditions. The two-component nature of the optical absorption toward ![]() Oph is coincidental and the star is occulted by a single body of gas with a complex internal structure, not by two distinct clouds. The very bright 12CO lines in diffuse gas arise at N(H2)
Oph is coincidental and the star is occulted by a single body of gas with a complex internal structure, not by two distinct clouds. The very bright 12CO lines in diffuse gas arise at N(H2) ![]()
![]() in regions of modest density n(H)
in regions of modest density n(H) ![]()
![]() and somewhat more complete C+-CO conversion. Given the variety of structure in the foreground gas, it is apparent that only large surveys of absorption sightlines can hope to capture the intrinsic behavior of diffuse gas.
and somewhat more complete C+-CO conversion. Given the variety of structure in the foreground gas, it is apparent that only large surveys of absorption sightlines can hope to capture the intrinsic behavior of diffuse gas.
Key words: astrochemistry - ISM: molecules - ISM: clouds
1 Introduction
The line of sight to the nearby (140-160 pc) runaway O9.5 V star
HD 149 757,
![]() Oph, has served as the
archetype for detailed observational studies of the internal composition
of diffuse (
Oph, has served as the
archetype for detailed observational studies of the internal composition
of diffuse (![]()
![]() mag) clouds (Herbig 1968; Morton 1975), for optical/uv
detection of new molecules in diffuse gas (Maier et al. 2001) and for theoretical
models of molecular gas in diffuse clouds (Kopp et al. 1996; Van Dishoeck & Black 1988,1986; Black & Dalgarno 1977). The H2-bearing portions of the gas occulting
mag) clouds (Herbig 1968; Morton 1975), for optical/uv
detection of new molecules in diffuse gas (Maier et al. 2001) and for theoretical
models of molecular gas in diffuse clouds (Kopp et al. 1996; Van Dishoeck & Black 1988,1986; Black & Dalgarno 1977). The H2-bearing portions of the gas occulting
![]() Oph are dense enough to host appreciable column densities
of carbon monoxide, N(12CO)
Oph are dense enough to host appreciable column densities
of carbon monoxide, N(12CO)
![]() (Wannier et al. 1982; Morton 1975; Sonnentrucker et al. 2007; Lambert et al. 1994), and these
are readily detectable in mm-wave emission toward the star
(Liszt 1979; Langer et al. 1987; Knapp & Jura 1976). They were very partially mapped in CO emission
(Liszt 1997; Kopp et al. 1996), as well as CH and OH (Liszt 1997; Crutcher 1979).
(Wannier et al. 1982; Morton 1975; Sonnentrucker et al. 2007; Lambert et al. 1994), and these
are readily detectable in mm-wave emission toward the star
(Liszt 1979; Langer et al. 1987; Knapp & Jura 1976). They were very partially mapped in CO emission
(Liszt 1997; Kopp et al. 1996), as well as CH and OH (Liszt 1997; Crutcher 1979).
CO J=1-0 emission around ![]() Oph was imaged in much more complete
fashion by Tachihara et al. (2000), who focused their discussion on the properties
of the nearby dark cloud complex L204 seen several degrees to the
galactic South. L204 is clearly outlined against the H
Oph was imaged in much more complete
fashion by Tachihara et al. (2000), who focused their discussion on the properties
of the nearby dark cloud complex L204 seen several degrees to the
galactic South. L204 is clearly outlined against the H![]() emission
from the ionized gas in the star's H II region (Gaustad et al. 2001).
In this work, the 12CO datacube from Tachihara et al. (2000)
is employed to study the diffuse gas at
emission
from the ionized gas in the star's H II region (Gaustad et al. 2001).
In this work, the 12CO datacube from Tachihara et al. (2000)
is employed to study the diffuse gas at ![]()
![]() 1 mag seen nearer the
star. We scrutinize the entire CO image of the absorption-line host whose
overall properties have so often been inferred from one microscopic
absorption sightline toward the star, and we inquire to what extent that
line of sight faithfully represents the host gas. Moreover,
large-scale maps of reddening and extinction have become
available at comparable resolution (though only along the entire line of sight,
see Schlegel et al. 1998; and Dobashi et al. 2005), and we employ these to
control against possible confusion between diffuse and darker
sightlines, a source of concern given the strong CO lines we see.
1 mag seen nearer the
star. We scrutinize the entire CO image of the absorption-line host whose
overall properties have so often been inferred from one microscopic
absorption sightline toward the star, and we inquire to what extent that
line of sight faithfully represents the host gas. Moreover,
large-scale maps of reddening and extinction have become
available at comparable resolution (though only along the entire line of sight,
see Schlegel et al. 1998; and Dobashi et al. 2005), and we employ these to
control against possible confusion between diffuse and darker
sightlines, a source of concern given the strong CO lines we see.
The plan of this work is as follows. Section 2 summarizes
what is known observationally of the line of sight toward the star
and describes the pre-existing H I, CO,
![]() and
and
![]() datasets
which are discussed here. Section 3 discusses
the appearance of the sky around
datasets
which are discussed here. Section 3 discusses
the appearance of the sky around ![]() Oph in terms of the statistics
of 12CO emission and reddening. Section 4 discusses CO profiles
and linewidths in terms of the turbulent flows which are prominent
in the emission profiles. Section 5 discusses physical conditions
in the CO and H2-bearing host gas, especially the regions of extremely
bright (11-12 K) CO emission.
Section 6 is a summary and Sect. 7 (available
online) discusses the relationship between the extinction and reddening
measurements over the
Oph in terms of the statistics
of 12CO emission and reddening. Section 4 discusses CO profiles
and linewidths in terms of the turbulent flows which are prominent
in the emission profiles. Section 5 discusses physical conditions
in the CO and H2-bearing host gas, especially the regions of extremely
bright (11-12 K) CO emission.
Section 6 is a summary and Sect. 7 (available
online) discusses the relationship between the extinction and reddening
measurements over the ![]() Oph field and presents some additional views
of the 12CO observations.
Oph field and presents some additional views
of the 12CO observations.
2 Observations
2.1 Carbon monoxide
The datacube of Tachihara et al. (2000) comprises nearly 11 000 spectra from
the NANTEN telescope with a beamwidth HPBW = 2.7![]() on a
4
on a
4![]() grid in galactic coordinates. The spectra have 0.1 km s-1
resolution and the single-channel rms at this resolution, 0.5 K, is
relatively high compared to that in the small numbers of demonstration
spectra typically shown in earlier work (Liszt 1997). Statisically
significant detections of the CO require
grid in galactic coordinates. The spectra have 0.1 km s-1
resolution and the single-channel rms at this resolution, 0.5 K, is
relatively high compared to that in the small numbers of demonstration
spectra typically shown in earlier work (Liszt 1997). Statisically
significant detections of the CO require
![]()
![]() km s-1,
where
km s-1,
where
![]() is the integrated intensity.
is the integrated intensity.
Toward the star, we show the profile of Liszt (1997) from the then-NRAO Kitt
Peak 12 m telescope at 1![]() (HPBW) spatial resolution and
0.12 km s-1 spectral resolution (see Sect. 3). To ensure that this
profile is compatible with those from NANTEN we recently used the ARO 12 m
Kitt Peak telescope to re-observe several positions having comparatively
strong emission in the NANTEN datacube. The 12 m spectra agree with the NANTEN
data to better than 5%, a remarkable coincidence considering the
difference in hardware and spatial resolution.
(HPBW) spatial resolution and
0.12 km s-1 spectral resolution (see Sect. 3). To ensure that this
profile is compatible with those from NANTEN we recently used the ARO 12 m
Kitt Peak telescope to re-observe several positions having comparatively
strong emission in the NANTEN datacube. The 12 m spectra agree with the NANTEN
data to better than 5%, a remarkable coincidence considering the
difference in hardware and spatial resolution.
2.2 H I
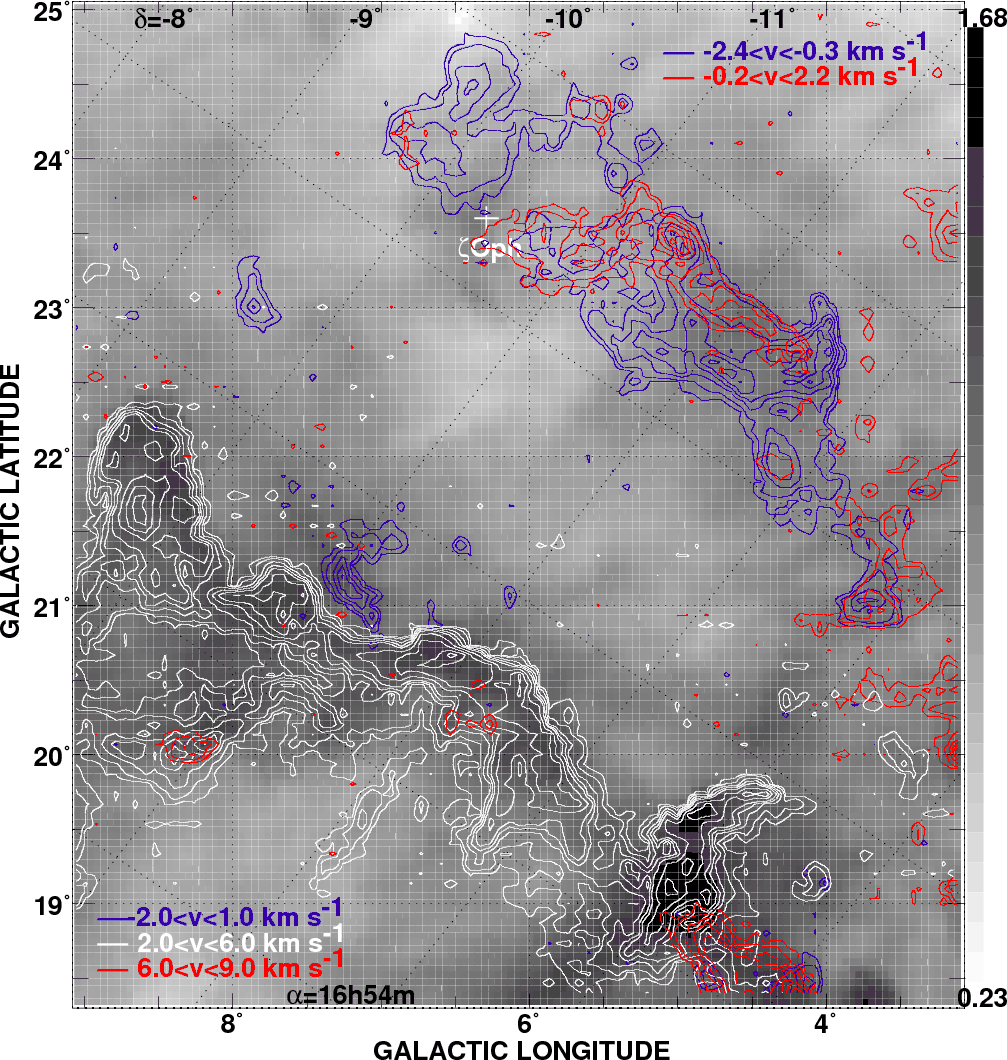 |
Figure 1:
Limiting reddening (Schlegel et al. 1998) and 12CO J=1-0 emission
(Tachihara et al. 2000) in the vicinity of |
| Open with DEXTER | |
To help distinguish between foreground and background material, or atomic
and molecular gases, we employed the H I profiles from the Leiden-Dwingeloo
all-sky H I survey (Hartmann & Burton 1997). These data have 35![]() resolution
on a 0.5
resolution
on a 0.5![]() grid in galactic coordinates.
grid in galactic coordinates.
2.3 Reddening and extinction
The reddening toward ![]() Oph is known to be EB-V = 0.32 mag (Morton 1975),
but maps of the
foreground extinction over only the first 140 pc are unavailable. Instead, we
employ the limiting reddening (from here to infinity) from the work of
Schlegel et al. (1998), denoted by
Oph is known to be EB-V = 0.32 mag (Morton 1975),
but maps of the
foreground extinction over only the first 140 pc are unavailable. Instead, we
employ the limiting reddening (from here to infinity) from the work of
Schlegel et al. (1998), denoted by
![]() ,
with a spatial resolution of 6.1
,
with a spatial resolution of 6.1![]() ,
published on a 2.5
,
published on a 2.5![]() grid; the stated global rms error of
this dataset is 16% (a percentage at each pixel). Their values are
based on a determination of the dust column density estimated from the IRAS
100 micron flux adopting the temperature variation derived from
COBE/DIRBE 240 micron data. The minimum limiting reddening
in the region, approximately
0.23 mag (Fig. 1), is likely hosted in atomic gas over long paths, as
opposed to the more-localized diffuse and dark clouds of interest here.
grid; the stated global rms error of
this dataset is 16% (a percentage at each pixel). Their values are
based on a determination of the dust column density estimated from the IRAS
100 micron flux adopting the temperature variation derived from
COBE/DIRBE 240 micron data. The minimum limiting reddening
in the region, approximately
0.23 mag (Fig. 1), is likely hosted in atomic gas over long paths, as
opposed to the more-localized diffuse and dark clouds of interest here.
A comparison between the limiting reddening of Schlegel et al. (1998) and
maps of the limiting extinction
![]() computed from star counts by
Dobashi et al. (2005) can be found in Sect. 7 (online only).
computed from star counts by
Dobashi et al. (2005) can be found in Sect. 7 (online only).
2.4 Some general conditions in the gas along the line of sight to
Oph
In front of the star, EB-V = 0.32 mag,
N(H I)
![]() ,
N(H2)
,
N(H2)
![]() (Savage et al. 1977),
N(12CO)
(Savage et al. 1977),
N(12CO)
![]() (Wannier et al. 1982; Morton 1975; Sonnentrucker et al. 2007),
N(C0) = N(12CO) (Morton 1975) and
N(C+)
(Wannier et al. 1982; Morton 1975; Sonnentrucker et al. 2007),
N(C0) = N(12CO) (Morton 1975) and
N(C+)
![]() (Cardelli et al. 1993).
The mean kinetic temperature of the molecular gas inferred from
H2 absorption is 54 K (Savage et al. 1977).
(Cardelli et al. 1993).
The mean kinetic temperature of the molecular gas inferred from
H2 absorption is 54 K (Savage et al. 1977).
Toward the star the limiting extinction from the work of
Schlegel et al. (1998) is
![]() = 0.55 mag, so that the background reddening
is approximately 0.23 mag.
= 0.55 mag, so that the background reddening
is approximately 0.23 mag.
The distance to the occulting material is generally taken to be very
close to that of the star, just outside the nearer edge of the star's
H II region (Wood et al. 2005).
At a distance of 140 pc, 1![]() corresponds to 0.041 pc
and 1
corresponds to 0.041 pc
and 1![]() to 2.44 pc.
to 2.44 pc.
3 The sky around
Oph viewed in reddening and CO emission
Figure 1 is a composite image of the limiting reddening
![]() and
integrated 12CO J=1-0 emission, an updated version of Fig. 1 in
Tachihara et al. (2000).
The gray-scale underlay is the limiting reddening (Schlegel et al. 1998)
normalized to white at the minimum value seen over the region,
and
integrated 12CO J=1-0 emission, an updated version of Fig. 1 in
Tachihara et al. (2000).
The gray-scale underlay is the limiting reddening (Schlegel et al. 1998)
normalized to white at the minimum value seen over the region,
![]() = 0.23 mag. Superposed on the reddening map, the integrated
12CO intensity
= 0.23 mag. Superposed on the reddening map, the integrated
12CO intensity
![]() has been calculated separately over the
diffuse/translucent northwest region, referred to as L121,
and the translucent/dark southeast region, L204. For the diffuse
gas of L121 at upper right, the red and blue contours correspond
to the velocity ranges above and below
v = -0.25 km s-1 as indicated
in the upper right corner: this division
corresponds to the natural separation between the two components
of CO, CH and OH emission found toward and around
has been calculated separately over the
diffuse/translucent northwest region, referred to as L121,
and the translucent/dark southeast region, L204. For the diffuse
gas of L121 at upper right, the red and blue contours correspond
to the velocity ranges above and below
v = -0.25 km s-1 as indicated
in the upper right corner: this division
corresponds to the natural separation between the two components
of CO, CH and OH emission found toward and around ![]() Oph, as
shown in the profiles and position-velocity maps of Liszt (1997).
For the darker gas of L204 to the southeast
Oph, as
shown in the profiles and position-velocity maps of Liszt (1997).
For the darker gas of L204 to the southeast
![]() was calculated
over three intervals but nearly all of the emission from L204 occurs
in the velocity interval 2-6 km s-1 represented by the white
contours (see Fig. 5). The noise level is somewhat larger for these contours,
because
was calculated
over three intervals but nearly all of the emission from L204 occurs
in the velocity interval 2-6 km s-1 represented by the white
contours (see Fig. 5). The noise level is somewhat larger for these contours,
because
![]() was calculated over a somewhat broader interval.
was calculated over a somewhat broader interval.
The strong CO emission associated with L204 often follows the ridge
lines of the extinction with something of a setback (reddening without
apparent CO) in the direction of the star. This is consistent
with the edge-on geometry for L204 described by Tachihara et al. (2000).
Nearly all of the CO emission in the L204 dark cloud complex
is found in the interval
![]() = 2-6 km s-1 and so
does not overlap that of the more diffuse gas to the
north, seen at
= 2-6 km s-1 and so
does not overlap that of the more diffuse gas to the
north, seen at
![]()
![]() 2 km s-1. The extent to which the two regions
are at rest in the directions joining them, and might partake of the optical
pumping excitation mechanism for diffuse gas described by
Wannier et al. (1997) is unknown. Tachihara et al. (2000) assumed that the
two clouds were co-moving at the edge of the H II region around
2 km s-1. The extent to which the two regions
are at rest in the directions joining them, and might partake of the optical
pumping excitation mechanism for diffuse gas described by
Wannier et al. (1997) is unknown. Tachihara et al. (2000) assumed that the
two clouds were co-moving at the edge of the H II region around
![]() Oph in order to discuss the energetics of the gas.
Oph in order to discuss the energetics of the gas.
To the North of L204, on either side of the star is the ![]() Oph
diffuse cloud, described as the L121 complex by Tachihara et al. (2000).
Most of the emission from that gas occurs at
-2.4 km s-1 <
Oph
diffuse cloud, described as the L121 complex by Tachihara et al. (2000).
Most of the emission from that gas occurs at
-2.4 km s-1 <
![]() < 2.2 km s-1. The red-shifted
kinematic component at -0.2 km s-1 <
< 2.2 km s-1. The red-shifted
kinematic component at -0.2 km s-1 <
![]() < 2.2 km s-1 which is seen
in CO emission and in many species in absorption toward the star,
is very much confined to the northern and northwestern edges of
the broader distribution of blue-shifted gas. Its separate identity
as a second cloud is somewhat marginal in the emission maps and hardly
supported by a more detailed examination of the turbulent
gas kinematics (also see Fig. 7).
< 2.2 km s-1 which is seen
in CO emission and in many species in absorption toward the star,
is very much confined to the northern and northwestern edges of
the broader distribution of blue-shifted gas. Its separate identity
as a second cloud is somewhat marginal in the emission maps and hardly
supported by a more detailed examination of the turbulent
gas kinematics (also see Fig. 7).
The diffuse gas in the L121 complex around ![]() Oph is separated
from the L204 dark cloud by an extended trough in the
reddening whose overall mean value is
Oph is separated
from the L204 dark cloud by an extended trough in the
reddening whose overall mean value is
![]()
![]() 0.43 mag.
Immediately below the star is a pronounced minimum whose mean
is
0.43 mag.
Immediately below the star is a pronounced minimum whose mean
is
![]()
![]() 0.34 mag and whose absolute minimum is
0.34 mag and whose absolute minimum is
![]() = 0.29 mag. The overall impression is of a cylindrical shell geometry
and perhaps a separate, more circular shell of radius
= 0.29 mag. The overall impression is of a cylindrical shell geometry
and perhaps a separate, more circular shell of radius ![]() 1
1![]() around the star. However, a yet-larger map of the extinction
shows that L204 is part of a much larger ridge.
around the star. However, a yet-larger map of the extinction
shows that L204 is part of a much larger ridge.
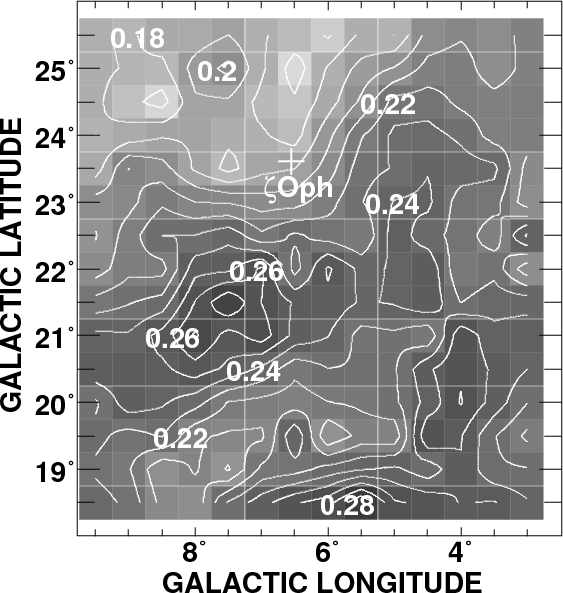 |
Figure 2:
Integrated H I line brightness from the LDSS survey of
Hartmann & Burton (1997) at 35 |
| Open with DEXTER | |
3.1 Separating foreground and background reddening
As noted above, we wish to understand the relationships between
![]() and reddening, but we only have maps of the reddening which include
all of the unrelated background and foreground gas. Immediately
around
and reddening, but we only have maps of the reddening which include
all of the unrelated background and foreground gas. Immediately
around ![]() Oph
Oph
![]() = 0.55 mag, compared to EB-V = 0.32 mag in
front of the star, so some 0.55-0.32 mag = 0.23 mag of reddening
occurs behind the star. This also corresponds well to the
absolute minimum in Fig. 1,
= 0.55 mag, compared to EB-V = 0.32 mag in
front of the star, so some 0.55-0.32 mag = 0.23 mag of reddening
occurs behind the star. This also corresponds well to the
absolute minimum in Fig. 1,
![]() = 0.23 mag found some 1.5
= 0.23 mag found some 1.5![]() North of the star.
North of the star.
To estimate the amount of extraneous foreground material, we note that
this is expected to be in atomic form and, in absorption
against the star, N(H I)
![]() (Savage et al. 1977) corresponding to EB-V
(Savage et al. 1977) corresponding to EB-V ![]() 0.1 mag. This
leaves EB-V
0.1 mag. This
leaves EB-V ![]() 0.22 mag of foreground material associated
with the pure H2 component and gives the general idea that
perhaps as much as 0.32 mag should be subtracted from the
map of
0.22 mag of foreground material associated
with the pure H2 component and gives the general idea that
perhaps as much as 0.32 mag should be subtracted from the
map of
![]() to infer the local reddening intrinsic to the H2-bearing
gas.
However, this is probably an overestimate of the required correction
because some of the foreground atomic gas is in the
vicinity of L121 and L204, providing shielding.
to infer the local reddening intrinsic to the H2-bearing
gas.
However, this is probably an overestimate of the required correction
because some of the foreground atomic gas is in the
vicinity of L121 and L204, providing shielding.
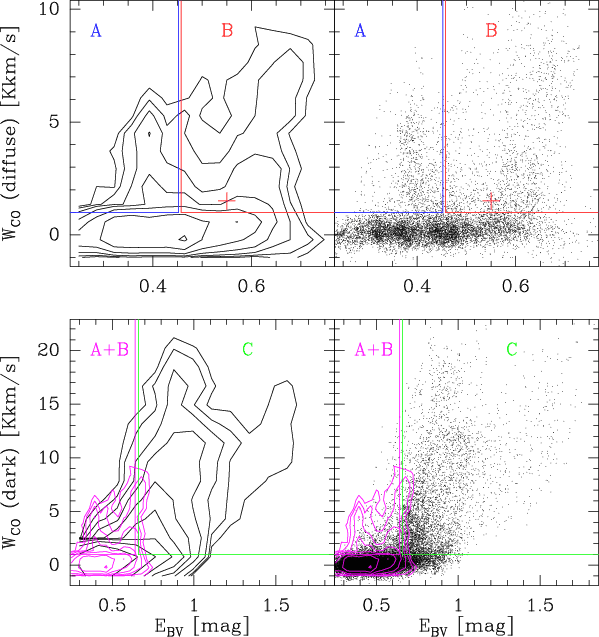 |
Figure 3:
Integrated intensity of the CO line
|
| Open with DEXTER | |
Figure 2 is a map
of the integrated H I brightness, scaled to the mean relationship
between hydrogen column density and extinction, that is, the map shows
![]() where the velocity integral
is in units of K km s-1. Several of the local
reddening peaks which lack CO emission in Fig. 1 even at
where the velocity integral
is in units of K km s-1. Several of the local
reddening peaks which lack CO emission in Fig. 1 even at
![]() = 0.65 mag are present as peaks in Fig. 2, for instance at
(l,b) = (7.5
= 0.65 mag are present as peaks in Fig. 2, for instance at
(l,b) = (7.5![]() , 21.5
, 21.5![]() )
and (4
)
and (4![]() , 20
, 20![]() ). Some of this
gas must be indigenous to the region of interest, but
the extinction associated with the H I peaks is only
). Some of this
gas must be indigenous to the region of interest, but
the extinction associated with the H I peaks is only ![]() 0.06 mag, judging from the peak levels in Fig. 2
(0.28 mag) compared to the
nearby background level (0.22 mag).
0.06 mag, judging from the peak levels in Fig. 2
(0.28 mag) compared to the
nearby background level (0.22 mag).
The minima in Figs. 1 and 2 and the difference between the
foreground and limiting reddening toward the star consistently
imply a background reddening contribution of ![]() 0.2 mag
over the region of interest.
0.2 mag
over the region of interest.
3.2 Quantitative relationship between CO emission and reddening
To quantify the relationship between reddening and CO emission, and
to compare and contrast the diffuse and dark sightlines we divided
the extent of Fig. 1 along a Northeast-Southwest diagonal in the
trough of reddening between L121 and L204, along a line running from
(l,b) = (3![]() , 19.333
, 19.333![]() )
to (10
)
to (10![]() , 25
, 25![]() ). Figure 3 shows
the integrated CO intensities
). Figure 3 shows
the integrated CO intensities
![]() and limiting reddening
and limiting reddening
![]() for all points in both regions: the profile integral was taken
over the range -2.4 km s-1 <
for all points in both regions: the profile integral was taken
over the range -2.4 km s-1 <
![]() < 2.2 km s-1 for the diffuse
L121 gas shown in the top panel, and 2 km s-1 <
< 2.2 km s-1 for the diffuse
L121 gas shown in the top panel, and 2 km s-1 <
![]() < 8 km s-1 for
the darker L204 region in the lower portion of the map of Fig. 1 and
the lower panel in Fig. 3. The rms noise in integrated intensity
is 0.5-0.6 K km s-1. Profile integrals above 1 K km s-1 generally
represent real detections.
< 8 km s-1 for
the darker L204 region in the lower portion of the map of Fig. 1 and
the lower panel in Fig. 3. The rms noise in integrated intensity
is 0.5-0.6 K km s-1. Profile integrals above 1 K km s-1 generally
represent real detections.
Once we realized that the CO emission in the diffuse region was
bimodal, as illustrated in the top panels of Fig. 3, we further
sub-divided the diffuse gas into A and B portions corresponding to
the two branches of the emission distribution. The A and B portions
were separated at
![]() = 0.455 mag, which is the mean
= 0.455 mag, which is the mean
![]() for those sightlines along which
for those sightlines along which
![]() < 1 K km s-1 and which
therefore lack statistically significant detections of CO emission.
The A-branch pixels have strong CO emission at
< 1 K km s-1 and which
therefore lack statistically significant detections of CO emission.
The A-branch pixels have strong CO emission at
![]() substantially
below the mean of those sightlines lacking CO emission at all.
For the diffuse gas in L121 there is actually a substantial spatial
segregation of the A and B portion pixels, with unweighted mean
substantially
below the mean of those sightlines lacking CO emission at all.
For the diffuse gas in L121 there is actually a substantial spatial
segregation of the A and B portion pixels, with unweighted mean
![]() = (6.0
= (6.0![]()
![]()
![]() ,
23.8
,
23.8![]()
![]()
![]() )
and
)
and
![]() = (4.0
= (4.0![]()
![]()
![]() ,
22.3
,
22.3![]()
![]()
![]() )
for the A and B portions, respectively. These centroids are on
opposite sides of
)
for the A and B portions, respectively. These centroids are on
opposite sides of ![]() Oph and separated by more than
Oph and separated by more than
![]() in each coordinate. The red-shifted
gas appears mostly in the higher-extinction B-portion while
the blue-shifted gas appears more nearly
in both the A and B-portions.
in each coordinate. The red-shifted
gas appears mostly in the higher-extinction B-portion while
the blue-shifted gas appears more nearly
in both the A and B-portions.
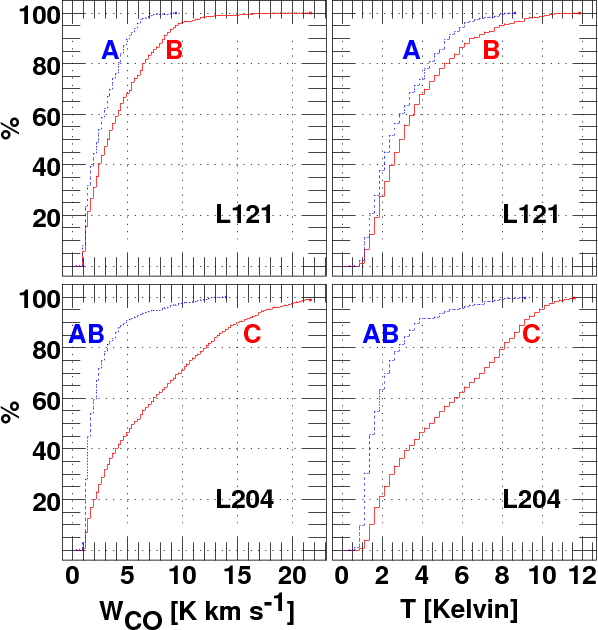 |
Figure 4:
Cumulative probability distributions of the
integrated intensity
|
| Open with DEXTER | |
In either emission branch,
![]() varies widely over a relatively narrow
range in
varies widely over a relatively narrow
range in
![]() ,
mimicing the extreme sensitivities of
N(CO) which are seen in global absorption line surveys of single
sightlines over widely-separated regions (see Liszt 2007a).
The widths of the two branches are comparable to the stated rms
noise of the
,
mimicing the extreme sensitivities of
N(CO) which are seen in global absorption line surveys of single
sightlines over widely-separated regions (see Liszt 2007a).
The widths of the two branches are comparable to the stated rms
noise of the
![]() data (16%) and they
are separated by 0.2 mag, which is of the same order as the
background contribution: it is possible that they would
more nearly coincide in EB-V if the background contribution were
strongly
variable. However, the B-branch at higher
data (16%) and they
are separated by 0.2 mag, which is of the same order as the
background contribution: it is possible that they would
more nearly coincide in EB-V if the background contribution were
strongly
variable. However, the B-branch at higher
![]() is more heavily
populated at
is more heavily
populated at
![]() > 5 K km s-1, suggesting that it actually is
somewhat more strongly shielded, fostering a higher CO abundance
and brightness: in this regime,
> 5 K km s-1, suggesting that it actually is
somewhat more strongly shielded, fostering a higher CO abundance
and brightness: in this regime,
![]()
![]() N(CO) (ibid and
see Sect. 6) and the conversion of free carbon from C+ to CO
occurs over a very narrow interval in EB-V and/or N(H2).
N(CO) (ibid and
see Sect. 6) and the conversion of free carbon from C+ to CO
occurs over a very narrow interval in EB-V and/or N(H2).
The distribution of brightness in the darker L204 region is not
similarly bimodal at all
![]() and there is less rationale for
a simple division into sub-portions. However when this
is done, at
and there is less rationale for
a simple division into sub-portions. However when this
is done, at
![]() = 0.67 mag corresponding again to the mean over
pixels lacking statistically significant CO emission, the resultant
lower-
= 0.67 mag corresponding again to the mean over
pixels lacking statistically significant CO emission, the resultant
lower-
![]() portion corresponds (in
portion corresponds (in
![]() and
and
![]() )
to the
entirety of the diffuse region. Consequently the lower-
)
to the
entirety of the diffuse region. Consequently the lower-
![]() part
of L204 is labelled L204 AB and the other L204 C.
The behavior of
part
of L204 is labelled L204 AB and the other L204 C.
The behavior of
![]() with
with
![]() in
the dark gas is complex but clearly bimodal for
in
the dark gas is complex but clearly bimodal for
![]()
![]() 12 K km s-1;
the strongest emission is by no means limited to the darkest regions.
Statistics of the brightness distribution over L121 and L204
are shown in Fig. 4 and discussed in the following sections.
12 K km s-1;
the strongest emission is by no means limited to the darkest regions.
Statistics of the brightness distribution over L121 and L204
are shown in Fig. 4 and discussed in the following sections.
3.3 Statistics of the line brightness
Figure 4 presents the distribution of integrated and peak brightness.
The differences between the A (lower
![]() )
and B portions
of the diffuse gas are somewhat more pronounced in the distribution
of the line profile integral at left and somewhat less so in the peak,
so that the line widths differ more than the line heights.
Although the median brightness is at most only 3 K or 3 K km s-1 in the diffuse gas and the tail of the distribution
seems very poorly populated above, say, 8 K peak brightness, paths which traverse L121 even in the short dimension
have a very substantial chance of containing at least
one such bright line, as discussed in Sect. 5 (see Fig. 7).
)
and B portions
of the diffuse gas are somewhat more pronounced in the distribution
of the line profile integral at left and somewhat less so in the peak,
so that the line widths differ more than the line heights.
Although the median brightness is at most only 3 K or 3 K km s-1 in the diffuse gas and the tail of the distribution
seems very poorly populated above, say, 8 K peak brightness, paths which traverse L121 even in the short dimension
have a very substantial chance of containing at least
one such bright line, as discussed in Sect. 5 (see Fig. 7).
It is not the intention here to discuss the dark gas, but it
should be noted that the difference in mean brightness
between the diffuse and dark regions is modest and corresponds
approximately to the difference in
![]() ,
thereby preserving the
possibility of a common CO-H2 conversion factor; the same
is also true for the A and B portions of L121, see Fig. 5.
This occurs despite
the fact that most of the free gas-phase carbon is in C+in L121
(99% toward
,
thereby preserving the
possibility of a common CO-H2 conversion factor; the same
is also true for the A and B portions of L121, see Fig. 5.
This occurs despite
the fact that most of the free gas-phase carbon is in C+in L121
(99% toward ![]() Oph) and in CO in the dark gas of L204 (where
N(CO)
Oph) and in CO in the dark gas of L204 (where
N(CO)
![]() )
implying
a difference in CO column density and
)
implying
a difference in CO column density and
![]() /N(CO) by a factor
of order 50. In Sect. 5 we discuss the very different
proportionality
/N(CO) by a factor
of order 50. In Sect. 5 we discuss the very different
proportionality
![]()
![]() N(CO) which is observed
within the diffuse regime alone (Liszt 2007a).
N(CO) which is observed
within the diffuse regime alone (Liszt 2007a).
3.4 An incidental bound on N(H2) over the diffuse gas
Because the line of sight to ![]() Oph occurs
at such a high value of
Oph occurs
at such a high value of
![]() relative to the rest of L121 we infer
that N(H2) is never very much larger in L121 than toward the star.
For instance, if we take
relative to the rest of L121 we infer
that N(H2) is never very much larger in L121 than toward the star.
For instance, if we take
![]() = 0.65 mag characteristic of the B-portion
and subtract a background contribution 0.23 mag equal to that toward
the star, the remaining gas column with
= 0.65 mag characteristic of the B-portion
and subtract a background contribution 0.23 mag equal to that toward
the star, the remaining gas column with
![]() = 0.65-0.23 = 0.42 mag
corresponds to N(H)
= 0.65-0.23 = 0.42 mag
corresponds to N(H)
![]() H-nuclei
H-nuclei
![]() and
N(H2)
and
N(H2)
![]() .
Conversely, because the line of
sight toward the star has such a high value
.
Conversely, because the line of
sight toward the star has such a high value
![]() = 0.55 mag relative
to the rest of the region, emission from the A-branch at
= 0.55 mag relative
to the rest of the region, emission from the A-branch at
![]() = 0.4 mag,
probably arises in regions whose reddening and N(H2) are actually below
those seen toward the star.
= 0.4 mag,
probably arises in regions whose reddening and N(H2) are actually below
those seen toward the star.
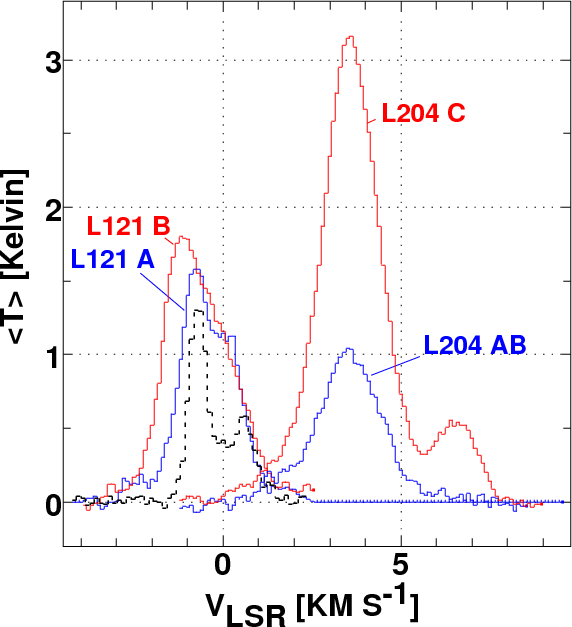 |
Figure 5:
Mean spectra over the diffuse and dark sub-portions
defined in Fig. 3: the profiles in the diffuse gas (L121)
are those at
lower velocity. The integrated brightnesses are
|
| Open with DEXTER | |
4 Line profiles, linewidths and turbulent flows in diffuse gas
4.1 CO line profiles and profile widths
For a pure-H2 gas, the Doppler temperature equivalent to a given
linewidth is
![]() K
FWHM2 or
K
FWHM2 or
![]() K
K
![]() 2 where
2 where
![]() is the velocity disperson
in km s-1. Typical kinetic temperatures in CO-bearing diffuse gas
are above 30 K
(Liszt 2007a; Burgh et al. 2007; Sonnentrucker et al. 2007) and the mean kinetic
temperature seen in surveys of H2 absorption is 70-80 K
(Rachford et al. 2002; Savage et al. 1977). CO profiles with
is the velocity disperson
in km s-1. Typical kinetic temperatures in CO-bearing diffuse gas
are above 30 K
(Liszt 2007a; Burgh et al. 2007; Sonnentrucker et al. 2007) and the mean kinetic
temperature seen in surveys of H2 absorption is 70-80 K
(Rachford et al. 2002; Savage et al. 1977). CO profiles with
![]() km s-1 are subsonic at diffuse cloud temperatures
and the purely-thermal velocity dispersions of CO molecules,
0.1 km s-1 at K = 50 K, do not contribute importantly to the
observed linewidths.
km s-1 are subsonic at diffuse cloud temperatures
and the purely-thermal velocity dispersions of CO molecules,
0.1 km s-1 at K = 50 K, do not contribute importantly to the
observed linewidths.
Unweighted mean profiles formed over the sub-portions of
the diffuse L121 and dark L204 regions are shown in Fig. 5.
The mean profiles have linewidths which are supersonic, FWHM of
typically 2-3 km s-1 but the individual sightlines in L121 typically
have subsonic linewidths; the FWHM of the two kinematic components
seen toward the star at 1![]() resolution (shown in Fig. 5
as the dark dashed line) are 0.6 km s-1 and 1.1 km s-1, equivalent
to Doppler temperatures of only 16 K and 53 K in a pure H2 gas,
compared to a measured temperature in H2 of 54 K as noted in Sect. 2.4.
resolution (shown in Fig. 5
as the dark dashed line) are 0.6 km s-1 and 1.1 km s-1, equivalent
to Doppler temperatures of only 16 K and 53 K in a pure H2 gas,
compared to a measured temperature in H2 of 54 K as noted in Sect. 2.4.
The distribution of velocity dispersions found over the L121 region is shown in Fig. 6. To produce this figure we used the following windowing technique to measure the widths of spectra which might contain more than one kinematic component: select the overall velocity interval of the diffuse gas; find the peak channel; select those contiguous channels around this peak with temperatures above a noise threshold of 0.25 K; calculate the brightness-weighted velocity dispersion over those channels; mask off that portion of the profile; repeat until no channel above 1 K remains unmasked. The dispersions measured en masse in this way are subject to overestimating the width in cases of unrecognizd blending, but they agree to within 10% for a series of test profiles which were fit with Gaussian components (for instance, those shown in Fig. 8).
The general properties of the gas in L121 have often been inferred from
profiles seen along the single, microscopic absorption line of sight toward
the star and a sensitive CO profile toward ![]() Oph at 1
Oph at 1![]() spatial
resolution is also included in Fig. 5. How representative is it of the
larger-scale distributions of the host gas? The stronger CO component
at
spatial
resolution is also included in Fig. 5. How representative is it of the
larger-scale distributions of the host gas? The stronger CO component
at
![]() = -0.7 km s-1 toward
= -0.7 km s-1 toward ![]() Oph is one of the narrowest lines
known in a diffuse cloud, with
Oph is one of the narrowest lines
known in a diffuse cloud, with
![]() km s-1. Broad consideration
of this question is given in the discussion of Fig. 7 which displays most of the
profiles seen in the L121 region, immediately following.
km s-1. Broad consideration
of this question is given in the discussion of Fig. 7 which displays most of the
profiles seen in the L121 region, immediately following.
4.2 Velocity gradients and turbulent flows
The connections between the profiles seen at individual pixels and the mean profiles shown in Fig. 5 are the flows and velocity gradients in the host medium, i.e. the character of the turbulence. Although very elaborate analyses of line profile centroids (Pety & Falgarone 2003) and fluctuations in the wings of optically thick profiles (Falgarone & Phillips 1996) have been used to infer the properties of turbulence in denser neutral media, turbulent flows in the nearby diffuse gas of L121 are immediately visible in the line cores and (usually) spatially resolved into the shifts of individual, subsonic profiles.
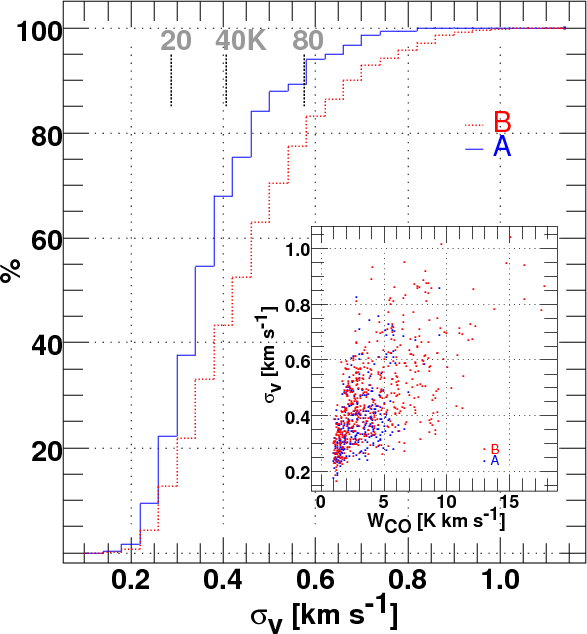 |
Figure 6:
Statistics of line profile velocity dispersions in the
diffuse gas. Large outer panel: cumulative probability distribution
histograms of the measured velocity dispersion
|
| Open with DEXTER | |
This is illustrated for ![]() Oph in Fig. 7, where we show a comprehensive
series of longitude-velocity diagrams spaced at one-pixel (4
Oph in Fig. 7, where we show a comprehensive
series of longitude-velocity diagrams spaced at one-pixel (4![]() )
intervals in galactic latitude, as labelled in the individual panels.
The peak line brightnesses (K) seen in the individual panels of
Fig. 7
are labelled on the bars showing the color scaling in each panel.
Although lines with peak brightnesses above 8 K seem relatively
rare in Fig. 4, they are common enough that peak brightnesses 7.5 K
and higher appear in 40%, 18 of the 44 individual panels of Fig. 7.
As shown
in Fig. 3, the most intense lines in the diffuse gas are by no means
limited to the more heavily-reddened sightlines.
)
intervals in galactic latitude, as labelled in the individual panels.
The peak line brightnesses (K) seen in the individual panels of
Fig. 7
are labelled on the bars showing the color scaling in each panel.
Although lines with peak brightnesses above 8 K seem relatively
rare in Fig. 4, they are common enough that peak brightnesses 7.5 K
and higher appear in 40%, 18 of the 44 individual panels of Fig. 7.
As shown
in Fig. 3, the most intense lines in the diffuse gas are by no means
limited to the more heavily-reddened sightlines.
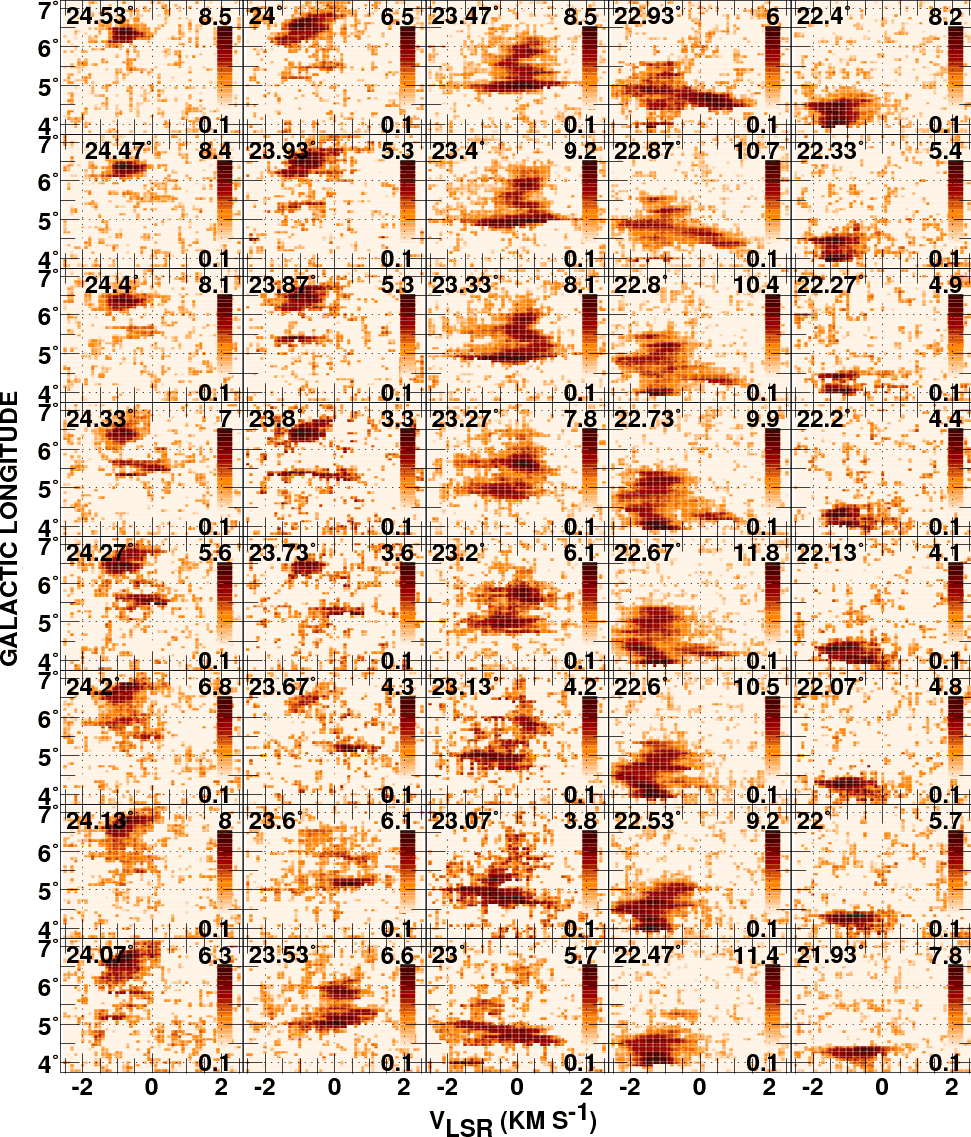 |
Figure 7:
Longitude-velocity diagrams traversing the |
| Open with DEXTER | |
Figure 7 shows that a description of the gas in terms of two
identifiable foreground clouds at the absorption line or CO emission
line velocities toward ![]() Oph is not appropriate. The line of sight
to the star could just as well have occured behind any of the
profiles exhibited in Fig. 7, leading to a wide variety of possible
interpretations of the intervening medium. Discussing the map in
Fig. 1, we saw that the red-shifted component generally appears
as something of a fringe at the northern edges of more
broadly-distributed, negative-velocity gas. Viewed in
position-velocity space in
Fig. 7, the red-shifted gas is often seen as a pronounced kinematic
excursion or wing, for instance, at
b = 22.8
Oph is not appropriate. The line of sight
to the star could just as well have occured behind any of the
profiles exhibited in Fig. 7, leading to a wide variety of possible
interpretations of the intervening medium. Discussing the map in
Fig. 1, we saw that the red-shifted component generally appears
as something of a fringe at the northern edges of more
broadly-distributed, negative-velocity gas. Viewed in
position-velocity space in
Fig. 7, the red-shifted gas is often seen as a pronounced kinematic
excursion or wing, for instance, at
b = 22.8![]() or 23.4
or 23.4![]() .
Further to the North, at
b > 23.2
.
Further to the North, at
b > 23.2![]() ,
the
kinematic pattern undulates across the positive-velocity portion.
At b= 23.4
,
the
kinematic pattern undulates across the positive-velocity portion.
At b= 23.4![]() the resolved velocity gradient spans
the entire range of velocities in the diffuse gas: viewed from
a different perspective, this same region might have been seen as
a single, broad line.
the resolved velocity gradient spans
the entire range of velocities in the diffuse gas: viewed from
a different perspective, this same region might have been seen as
a single, broad line.
Figure 8 is an expanded view of the panel in Fig. 7 at
b= 22.6![]() ,
where we also show several included line profiles,
their Gaussian decomposition and the resultant FWHM. Except
at the center of the diagram where there is a partially spatially-resolved
velocity gradient, the FWHM are small enough to be subsonic for an
H2 gas at typical
diffuse cloud temperatures above 30 K. Thus the observations show
in detail how supersonic profiles might arise from the
coincidental superposition or addition (for instance through
beam-smearing) of velocity-shifted quiescent regions.
,
where we also show several included line profiles,
their Gaussian decomposition and the resultant FWHM. Except
at the center of the diagram where there is a partially spatially-resolved
velocity gradient, the FWHM are small enough to be subsonic for an
H2 gas at typical
diffuse cloud temperatures above 30 K. Thus the observations show
in detail how supersonic profiles might arise from the
coincidental superposition or addition (for instance through
beam-smearing) of velocity-shifted quiescent regions.
As in Fig. 8 there are many highly-localized,
relatively broad lines in 4![]() pixels, often joined to abrupt
but spatially-resolved velocity gradients and reversals in
narrow-lined gas. This suggests that broader lines are themselves
composed of unresolved velocity gradients and it seems possible
that any profile in Fig. 7 with a width substantially above sonic
is an unresolved gradient. For instance, compare the velocity span at
b=22.87
pixels, often joined to abrupt
but spatially-resolved velocity gradients and reversals in
narrow-lined gas. This suggests that broader lines are themselves
composed of unresolved velocity gradients and it seems possible
that any profile in Fig. 7 with a width substantially above sonic
is an unresolved gradient. For instance, compare the velocity span at
b=22.87![]() ,
which is spatially resolved, with that at the edge
of the emission region at b=23.33
,
which is spatially resolved, with that at the edge
of the emission region at b=23.33![]() .
Recalling the extremely
narrow blue-shifted CO component toward
.
Recalling the extremely
narrow blue-shifted CO component toward ![]() Oph and the low
implied Doppler temperature, we wonder whether and at what scale
profiles having linewidths that are subsonic at the higher
temperatures expected for diffuse gas, say 60 K, might show
velocity or spatial substructure. The geometry of the turbulent
flows producing the patterns in Fig. 7 will be considered in
a subsequent paper.
Oph and the low
implied Doppler temperature, we wonder whether and at what scale
profiles having linewidths that are subsonic at the higher
temperatures expected for diffuse gas, say 60 K, might show
velocity or spatial substructure. The geometry of the turbulent
flows producing the patterns in Fig. 7 will be considered in
a subsequent paper.
5 Physical conditions in the diffuse gas
There are some 1000 sightlines with
![]()
![]() 1 K km s-1 in the diffuse, Northwest portion of the map in Fig. 1. At a distance
of 140 pc, the H2-mass associated with these sightlines, parametrized
by their average H2 column density
1 K km s-1 in the diffuse, Northwest portion of the map in Fig. 1. At a distance
of 140 pc, the H2-mass associated with these sightlines, parametrized
by their average H2 column density ![]() (H2)
(H2)![]() ,
is M = 430
,
is M = 430
![]() (H2)/
(H2)/
![]() where
typical values of N(H2) along the L121 sightlines are
where
typical values of N(H2) along the L121 sightlines are
![]() (see Sects. 2.4 and 3.4). This may be compared
with the value 520 M0 given by Tachihara et al. (2000) based on a
CO-H2 conversion factor N(H2)/
(see Sects. 2.4 and 3.4). This may be compared
with the value 520 M0 given by Tachihara et al. (2000) based on a
CO-H2 conversion factor N(H2)/
![]() =
=
![]() /(K km s-1).
/(K km s-1).
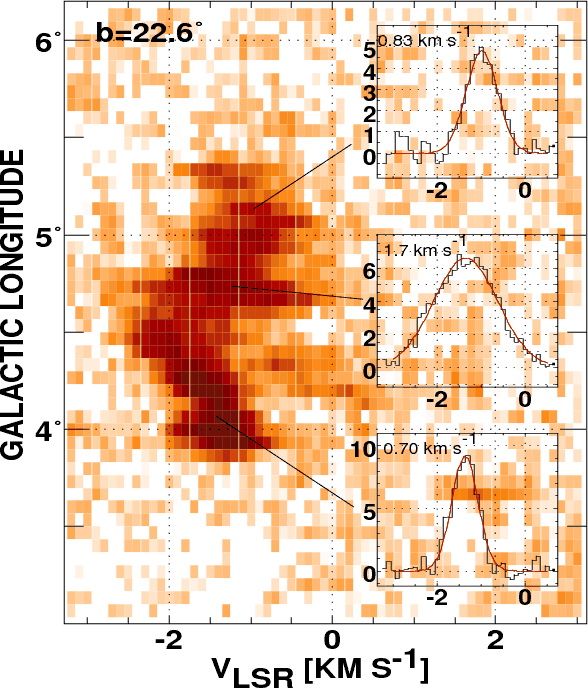 |
Figure 8:
The longitude-velocity diagram at
b = 22.6 |
| Open with DEXTER | |
Nonetheless, deriving the physical parameters of host diffuse gas from CO profiles is challenging. Strong fractionation of the carbon isotopes (Liszt 2007a; Burgh et al. 2007; Liszt & Lucas 1998; Sonnentrucker et al. 2007) causes the N(12CO)/N(13CO) to vary in the range 15-150, thus making it impossible to derive the line excitation temperatures and optical depths, or the kinetic temperatures and column densities, under the usual assumption (valid in dark gas) that the relative abundances of 12CO and 13CO only reflect the general interstellar carbon isotope ratio. However, it is straightforward to show that the general properties of the CO observations, even including the rather unexpectedly bright lines, fit easily into the framework of diffuse gas at typical temperatures 30-60 K and modest density. The real underlying mysteries are the working of the poorly-understood polyatomic chemistry which forms the CO and other species at such modest densities (Liszt et al. 2006), and the origin of the turbulent flows which may power the chemistry.
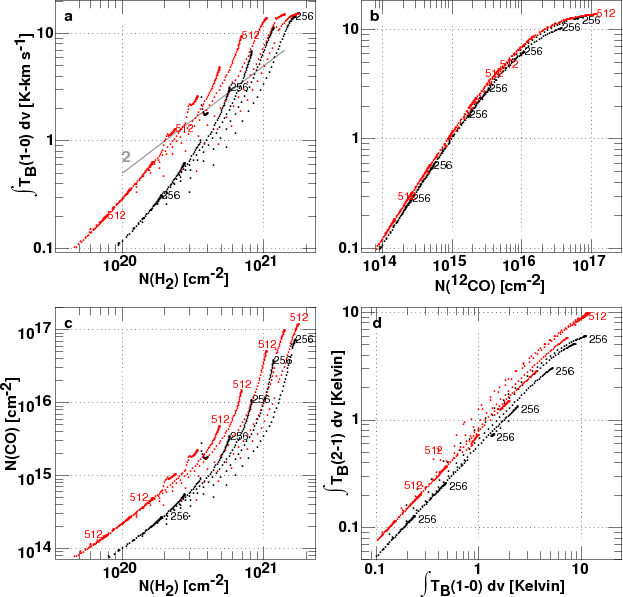 |
Figure 9:
Models of 12CO formation and excitation. Results are shown for models
having n(H) = n(H I) + 2n(H2) =
|
| Open with DEXTER | |
Figure 9 reports some results from the models which were used to interpret
CO absorption line data by Liszt (2007a). The underlying physics are:
to heat a uniform-density gas sphere by the photoelectric effect on small
grains, as in the work of Wolfire et al. (1995,2003), to calculate the
ionization balance including grain-assisted neutralization of atomic
ions (including most importantly the protons, ibid), to allow
equilibrium of the self-shielding of H2 formed on grains and
the formation of CO by thermal electron-recombination of a
fixed quantity of HCO+ X(HCO+) = N(HCO+)/N(H2) =
![]() (the actual secular evolution is traced
by Liszt 2007b); and, to calculate the rotational excitation of CO assuming
microturbulent radiative transfer with a linewidth determined by the
local sound speed. Note that the interstellar radiation field in the
models has not been increased above the mean interstellar value
to account for the presence of the star
and that all of the aspects shown here for the model results
are present in the absorption line data summarized by Liszt (2007a).
(the actual secular evolution is traced
by Liszt 2007b); and, to calculate the rotational excitation of CO assuming
microturbulent radiative transfer with a linewidth determined by the
local sound speed. Note that the interstellar radiation field in the
models has not been increased above the mean interstellar value
to account for the presence of the star
and that all of the aspects shown here for the model results
are present in the absorption line data summarized by Liszt (2007a).
Model results are shown for just two fairly high densities
![]() and
and
![]() .
To form the graphs in Fig. 9,
results were derived by integrating along sightlines ranging across
the faces of model
spheres from center to edge. The graphs summarize results gleaned
from models whose central column densities N(H) varied widely, so
that the same value of N(H2) might occur at different positions
across the faces of models with differing n(H) and N(H), and therefore
have different N(CO) and
.
To form the graphs in Fig. 9,
results were derived by integrating along sightlines ranging across
the faces of model
spheres from center to edge. The graphs summarize results gleaned
from models whose central column densities N(H) varied widely, so
that the same value of N(H2) might occur at different positions
across the faces of models with differing n(H) and N(H), and therefore
have different N(CO) and
![]() .
For
N(H2) =
.
For
N(H2) =
![]() the models have typical
sizes of 1.2-2.5 pc but the CO abundance is concentrated into
smaller central portions of the host bodies owing to
the chemistry of CO and that of H2, and the CO emission is more concentrated
still owing to geometry and radiative pumping.
the models have typical
sizes of 1.2-2.5 pc but the CO abundance is concentrated into
smaller central portions of the host bodies owing to
the chemistry of CO and that of H2, and the CO emission is more concentrated
still owing to geometry and radiative pumping.
As noted above N(H2)
![]() in the
CO-emitting
regions around the star. As shown in panel c at the lower left,
this is precisely the
regime where carbon is about to recombine fully to CO at the quoted
densities: the increase of N(CO) with N(H2) is very rapid.
Both N(CO) and
in the
CO-emitting
regions around the star. As shown in panel c at the lower left,
this is precisely the
regime where carbon is about to recombine fully to CO at the quoted
densities: the increase of N(CO) with N(H2) is very rapid.
Both N(CO) and
![]() vary rapidly and have large scatter when plotted
against N(H2). Substantial CO column densities can accumulate in gas
which is still relatively warm, 30-50 K, giving rise to 12 K lines as
observed in the brightest profiles.
vary rapidly and have large scatter when plotted
against N(H2). Substantial CO column densities can accumulate in gas
which is still relatively warm, 30-50 K, giving rise to 12 K lines as
observed in the brightest profiles.
The most important consideration is as shown at the upper right in
panel b,
![]()
![]() N(CO) for
N(CO) for
![]()
![]() 10 K km s-1, explicitly
independent of density and implicitly independent of N(H2) and
other cloud properties. This is a very general consequence of
very sub-thermal excitation, as first shown by Goldreich & Kwan (1974)
and does not require low optical depth.
As shown in Fig. 4, some 80-90% of the
diffuse cloud spectra have
10 K km s-1, explicitly
independent of density and implicitly independent of N(H2) and
other cloud properties. This is a very general consequence of
very sub-thermal excitation, as first shown by Goldreich & Kwan (1974)
and does not require low optical depth.
As shown in Fig. 4, some 80-90% of the
diffuse cloud spectra have
![]() < 5-6 K km s-1 and virtually
all are below 10-12 K km s-1, just in the regime
characteristic of sightlines studied in uv and mm-wave CO absorption
work generally, see Fig. 6 of Liszt (2007a). Therefore,
the 12CO brightness map in Fig. 1 is a map of
N(12CO) in
the diffuse gas and the same would be true for
N(13CO) and
the brightness of the 13CO line. This is the one unambiguous
result of mapping CO emission in any diffuse gas.
< 5-6 K km s-1 and virtually
all are below 10-12 K km s-1, just in the regime
characteristic of sightlines studied in uv and mm-wave CO absorption
work generally, see Fig. 6 of Liszt (2007a). Therefore,
the 12CO brightness map in Fig. 1 is a map of
N(12CO) in
the diffuse gas and the same would be true for
N(13CO) and
the brightness of the 13CO line. This is the one unambiguous
result of mapping CO emission in any diffuse gas.
The extreme sensitivity of
![]() to
N(H2) therefore arises because
to
N(H2) therefore arises because
![]()
![]() N(CO), so that a plot of
N(CO), so that a plot of
![]() vs.
N(H2) is
equivalent to plotting N(CO) against
N(H2). The net result is that
although commonly-used values of the CO-H2 conversion factor apply
to some gas (as indicated in panel a of Fig. 9) the CO-H2 conversion factor varies widely in diffuse gas and the actual
N(CO)/N(H2) ratio is small but very uncertain. A map of
CO emission from diffuse gas is an image of the chemistry,
not the mass distribution.
vs.
N(H2) is
equivalent to plotting N(CO) against
N(H2). The net result is that
although commonly-used values of the CO-H2 conversion factor apply
to some gas (as indicated in panel a of Fig. 9) the CO-H2 conversion factor varies widely in diffuse gas and the actual
N(CO)/N(H2) ratio is small but very uncertain. A map of
CO emission from diffuse gas is an image of the chemistry,
not the mass distribution.
Last, note that the J=1-0 CO line brightness is insensitive to density at fixed N(CO), indicating that other tracers are required to measure the local density when mm-wave emission profiles are analyzed. The J=2-1/J=1-0 line brightness ratios at lower right in Fig. 9 are not very sensitve to density, which explains why line brightness ratios 0.7-0.75 are indeed so commonly observed in diffuse and translucent gas (Pety et al. 2008; Falgarone et al. 1998). The J=3-2/J=1-0 brightness ratio is a better indicator of density in the CO lines, but care must be taken to match the spatial resolution of the two lines.
6 Summary
The line of sight to the nearby (140-160 pc) runaway 09.5V star
![]() Oph has for many years been used as an archetype for studying
the properties of diffuse clouds in optical and
Oph has for many years been used as an archetype for studying
the properties of diffuse clouds in optical and ![]() absorption.
Because the material has an appreciable molecular content, the host
diffuse clouds can actually be imaged on the sky in space
and radial velocity. Because the gas is well extended and comparatively
close, it provides an unusual opportunity for study of diffuse gas
and its interaction with its surroundings, including the star.
absorption.
Because the material has an appreciable molecular content, the host
diffuse clouds can actually be imaged on the sky in space
and radial velocity. Because the gas is well extended and comparatively
close, it provides an unusual opportunity for study of diffuse gas
and its interaction with its surroundings, including the star.
We began by comparing the 12CO J=1-0 emission line datacube of
Tachihara et al. (2000) (HPBW 2.7![]() observations on a 4
observations on a 4![]() = 0.1 pc
pixel grid)
with a map of the limiting reddening
= 0.1 pc
pixel grid)
with a map of the limiting reddening
![]() from the work of Schlegel et al. (1998)
having similar resolution 6.1
from the work of Schlegel et al. (1998)
having similar resolution 6.1![]() (Fig. 1). The reddening in the L121
complex near and around
(Fig. 1). The reddening in the L121
complex near and around ![]() Oph ranges from
Oph ranges from
![]() = 0.23-0.75 mag and
the integrated CO emission up to
= 0.23-0.75 mag and
the integrated CO emission up to
![]() = 12 K km s-1, with 12 K peak
temperatures, which are very bright lines indeed.
Comparison of reddening of the star (0.32 mag) and through the Milky
Way (
= 12 K km s-1, with 12 K peak
temperatures, which are very bright lines indeed.
Comparison of reddening of the star (0.32 mag) and through the Milky
Way (
![]() = 0.55 mag) in the same direction, and
comparison of H I seen toward the star in
= 0.55 mag) in the same direction, and
comparison of H I seen toward the star in ![]() absorption and around
the star in 21 cm emission (Fig. 2), suggests that
absorption and around
the star in 21 cm emission (Fig. 2), suggests that ![]() 0.2 mag of
0.2 mag of
![]() should be ascribed to unrelated background material.
should be ascribed to unrelated background material.
CO emission from diffuse L121 gas seen around ![]() Oph is bimodal
in
Oph is bimodal
in
![]() ,
clustering around
,
clustering around
![]() = 0.4 mag and 0.65 mag and varying widely
(1 K km s-1 <
= 0.4 mag and 0.65 mag and varying widely
(1 K km s-1 <
![]() < 6-12 K km s-1)
with
< 6-12 K km s-1)
with
![]() in one of two narrow ranges, see Fig. 3: the same large
scatter in CO column density with reddening and N(H) which is seen
globally in galactic absorption line surveys also occurs in the
single region studied here.
The lower-reddening branch of the emission is spatially
segregated to the galactic northeast of the star and has somewhat
smaller mean integrated brightness
in one of two narrow ranges, see Fig. 3: the same large
scatter in CO column density with reddening and N(H) which is seen
globally in galactic absorption line surveys also occurs in the
single region studied here.
The lower-reddening branch of the emission is spatially
segregated to the galactic northeast of the star and has somewhat
smaller mean integrated brightness
![]() (Fig. 4) and velocity dispersion
(Fig. 4) and velocity dispersion
![]() (0.35 km s-1 vs. 0.42 km s-1; Fig. 6). However, peak temperatures
8-12 K are present in both branches.
(0.35 km s-1 vs. 0.42 km s-1; Fig. 6). However, peak temperatures
8-12 K are present in both branches.
 |
Figure 10:
Comparison of the limiting extinction
|
| Open with DEXTER | |
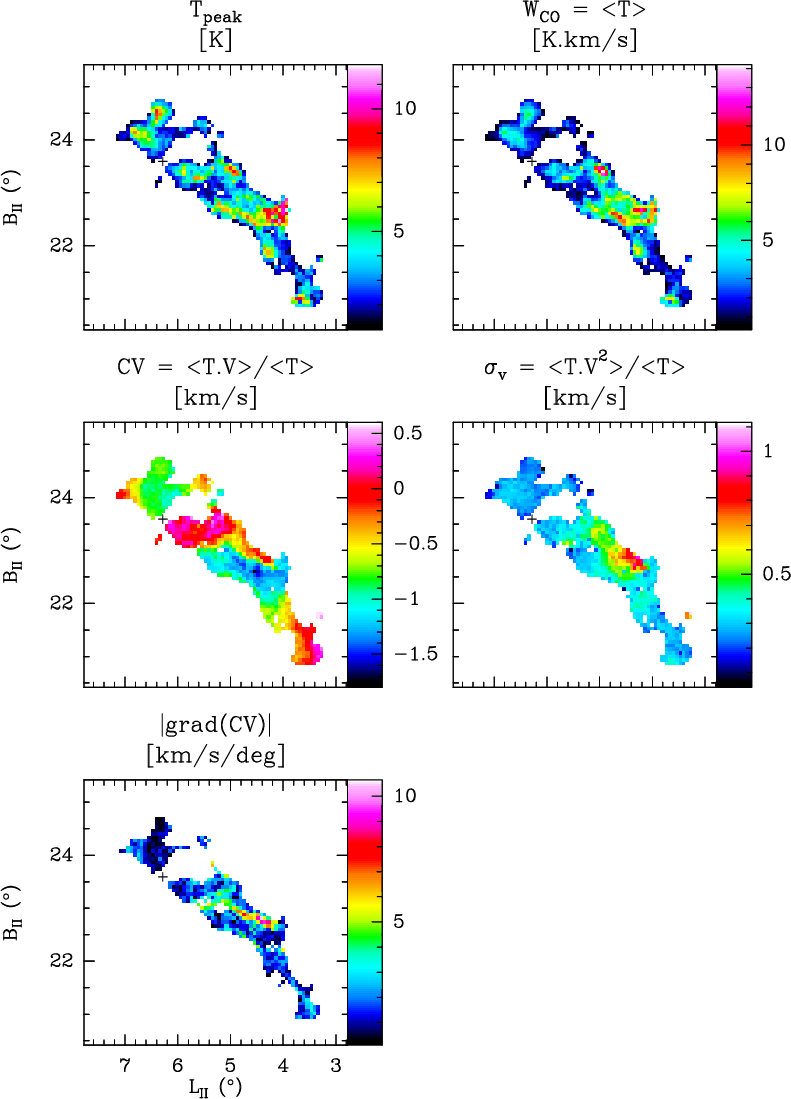 |
Figure 11: Maps of various quantities, available online. Top left and right, peak and integrated brightness. Middle: mean velocity and velocity dispersion. Bottom, the velocity gradient. |
| Open with DEXTER | |
The two most striking observational results of this study are the
strong lines which emanate from the diffuse gas, up to
![]() = 12 K km s-1,
and the velocity structure present in the strongly emitting 12CO line
cores there (Figs. 7 and 8).
The turbulent flows in this gas are in general directly visible as the
spatially and kinematically resolved velocity gradients in simple,
narrow, bright lines whose widths (
= 12 K km s-1,
and the velocity structure present in the strongly emitting 12CO line
cores there (Figs. 7 and 8).
The turbulent flows in this gas are in general directly visible as the
spatially and kinematically resolved velocity gradients in simple,
narrow, bright lines whose widths (
![]() < 0.6 km s-1) are subsonic at
diffuse cloud temperatures K = 30-60 K
(Figs. 4 and 8). Other,
locally-broader line profiles will likely be resolved into such
velocity shifts of narrow line cores with higher
(than 4
< 0.6 km s-1) are subsonic at
diffuse cloud temperatures K = 30-60 K
(Figs. 4 and 8). Other,
locally-broader line profiles will likely be resolved into such
velocity shifts of narrow line cores with higher
(than 4![]() )
resolution although this remains to be tested.
Conversely, it also remains to be seen whether CO line profiles which
are subsonic but still supra-thermal at 2.7
)
resolution although this remains to be tested.
Conversely, it also remains to be seen whether CO line profiles which
are subsonic but still supra-thermal at 2.7![]() resolution
will show spatial or velocity sub-structure when mapped at higher
resolution.
resolution
will show spatial or velocity sub-structure when mapped at higher
resolution.
We briefly discussed some modelling results of the formation
and excitation of CO in diffuse media (Fig. 9). The brightness
of the strongest CO lines can be understood by noting that the H2
column densities in the gas around ![]() Oph are near the point
(N(H2)
Oph are near the point
(N(H2)
![]() )
where carbon fully recombines to CO
at even modest densities n(H)
)
where carbon fully recombines to CO
at even modest densities n(H)
![]() ,
so that substantial
columns of CO may form in gas which is at typical diffuse cloud
temperatures (above 30 K). In turn, such densities will excite CO
to the required degree even though they are far too low to
thermalize the lower rotational level populations.
,
so that substantial
columns of CO may form in gas which is at typical diffuse cloud
temperatures (above 30 K). In turn, such densities will excite CO
to the required degree even though they are far too low to
thermalize the lower rotational level populations.
In the range
![]()
![]() 10 K km s-1
it is the case that
10 K km s-1
it is the case that
![]()
![]() N(CO), as a consequence
of very sub-thermal excitation. The CO-H2
conversion factor therefore varies widely in diffuse gas
(because N(CO) varies rapidly with N(H2) and with great scatter),
but it takes on values N(H2)/
N(CO), as a consequence
of very sub-thermal excitation. The CO-H2
conversion factor therefore varies widely in diffuse gas
(because N(CO) varies rapidly with N(H2) and with great scatter),
but it takes on values N(H2)/
![]()
![]() /(K km s-1)
in limited circumstances (Fig. 9 panel a at upper left).
/(K km s-1)
in limited circumstances (Fig. 9 panel a at upper left).
If
![]()
![]() N(CO), a sky map of
N(CO), a sky map of
![]() like that in Fig. 1
is a map of the interstellar diffuse cloud chemistry. This should be
contrasted with the more usual assumption of a constant CO conversion
factor N(H2)/
like that in Fig. 1
is a map of the interstellar diffuse cloud chemistry. This should be
contrasted with the more usual assumption of a constant CO conversion
factor N(H2)/
![]() ,
in which case a CO map traces the contours
of the mass (i.e. the bulk molecular material)
largely independent of physical conditions.
Even the darker gas seen in the L204 complex South of
,
in which case a CO map traces the contours
of the mass (i.e. the bulk molecular material)
largely independent of physical conditions.
Even the darker gas seen in the L204 complex South of ![]() Oph is not
immune to the influences of chemistry, which are clearly visible
in the displacements between regions of higher
Oph is not
immune to the influences of chemistry, which are clearly visible
in the displacements between regions of higher
![]() and
and
![]() .
.
The wealth of structure seen in the foreground CO brightness map
has important implications for absorption line study of diffuse clouds.
Since the viewing geometry is an accident of the relative locations
of the Sun and ![]() Oph, our line of sight to the star could equally
well have intercepted any of the wide variety of profiles shown in
Fig. 7. This belies our ability to infer the general properties of
the host gas from studies along any single sightline, no matter
how comprehensive; studies of individual absorption sightlines must be viewed
demographically, as datapoints within a large family of possible
outcomes, even in nominally similar conditions.
Even beyond this, there are some obvious fundamental limits to the
use of absorption lines to derive the properties of the intervening
gas. In the present case only a map could
correct the false impression that the star is occulted
by two separate foreground clouds. Likewise, the turbulent
flows in the foreground gas appear clearly in maps of the gas
but not at most individual positions, thereby conveying the false
impression of an overly-quiescent medium.
Oph, our line of sight to the star could equally
well have intercepted any of the wide variety of profiles shown in
Fig. 7. This belies our ability to infer the general properties of
the host gas from studies along any single sightline, no matter
how comprehensive; studies of individual absorption sightlines must be viewed
demographically, as datapoints within a large family of possible
outcomes, even in nominally similar conditions.
Even beyond this, there are some obvious fundamental limits to the
use of absorption lines to derive the properties of the intervening
gas. In the present case only a map could
correct the false impression that the star is occulted
by two separate foreground clouds. Likewise, the turbulent
flows in the foreground gas appear clearly in maps of the gas
but not at most individual positions, thereby conveying the false
impression of an overly-quiescent medium.
We intend to map with higher angular resolution some regions of
the L121 gas whose line profiles are thermal at the
2.7![]() NANTEN resolution, to see what kind of substructure
might be present when some forms of line-broadening are absent.
We will also map some L121 gas whose profiles are broader and whose
velocity gradients are not fully resolved in Fig. 7 at 4
NANTEN resolution, to see what kind of substructure
might be present when some forms of line-broadening are absent.
We will also map some L121 gas whose profiles are broader and whose
velocity gradients are not fully resolved in Fig. 7 at 4![]() (0.16 pc) beam-spacing.
(0.16 pc) beam-spacing.
This is the second paper in a loose series (see Pety et al. 2008) which
will also report observations of similar kinematics on smaller
angular scales and at higher angular resolution
6
![]() -22
-22
![]() in other diffuse clouds of unknown distance
whose presence was first manifested in our mm-wave absorption
studies of polyatomic molecules.
In a subsequent paper we will discuss the geometrical and physical
interpretation of the internal structures responsible for the flows
seen there and in Fig. 7.
in other diffuse clouds of unknown distance
whose presence was first manifested in our mm-wave absorption
studies of polyatomic molecules.
In a subsequent paper we will discuss the geometrical and physical
interpretation of the internal structures responsible for the flows
seen there and in Fig. 7.
7 Comparison of measured
E
 and
A
and
A

As an alternative source of extinction data we considered the results
of Dobashi et al. (2005) who constructed a sky map of limiting extinction
![]() at latitudes |b| < 40
at latitudes |b| < 40![]() based on star counts. We generated
based on star counts. We generated
![]() from a FITS file downloaded from the survey website, with pixels on
a 2
from a FITS file downloaded from the survey website, with pixels on
a 2![]() grid. The features in a map of that data strongly resemble
those shown in Fig. 1 but
grid. The features in a map of that data strongly resemble
those shown in Fig. 1 but
![]() = 0.25 mag toward
= 0.25 mag toward ![]() Oph, which substantially
underestimates the known foreground extinction since it is accepted that
EB-V = 0.32 mag and
Oph, which substantially
underestimates the known foreground extinction since it is accepted that
EB-V = 0.32 mag and ![]()
![]() mag.
mag.
A more general comparison with the limiting extinction of Schlegel et al. (1998)
is shown in Fig. 10: we generated
![]() and
and
![]() on a 4
on a 4![]() grid
for 3
grid
for 3![]()
![]()
![]() ,
18
,
18![]()
![]()
![]() as in
Fig. 1. The
as in
Fig. 1. The
![]() -intercept (0.32 mag) and slope (0.41) indicate
an offset of 0.32 mag/0.41 = 0.78 mag in the
-intercept (0.32 mag) and slope (0.41) indicate
an offset of 0.32 mag/0.41 = 0.78 mag in the
![]() dataset with respect
to
dataset with respect
to
![]() ,
which corresponds to the disparity in
,
which corresponds to the disparity in
![]() and
and
![]() values toward the star itself or to the minimum
values toward the star itself or to the minimum
![]() = 0.23 mag over
the region. We infer that a uniform foreground componentof the
extinction, which might have renormalized the star count, is absent
in the
= 0.23 mag over
the region. We infer that a uniform foreground componentof the
extinction, which might have renormalized the star count, is absent
in the
![]() maps for this region.
maps for this region.
Acknowledgements
The National Radio Astronomy Observatory is operated by Associated Universites, Inc. under a cooperative agreement with the US National Science Foundation. IRAM is operated by CNRS (France), the MPG (Germany) and the IGN (Spain). This research made use of the Simbad astronomical database and the NASA ADS astrophysical database system. This work profited from discussions of CO excitation with Michel Guelin.
References
- Black, J. H., & Dalgarno, A. 1977, ApJS, 34, 405 [NASA ADS] [CrossRef]
- Burgh, E. B., France, K., & McCandliss, S. R. 2007, ApJ, 658, 446 [NASA ADS] [CrossRef]
- Cardelli, J. A., Mathis, J. S., Ebbets, D. C., & Savage, B. D. 1993, ApJ, 402, L17 [NASA ADS] [CrossRef] (In the text)
- Crutcher, R. M. 1979, ApJ, 231, L151 [NASA ADS] [CrossRef]
- Dobashi, K., Uehara, H., Kandori, R., Sakurai, T., Kaiden, M., Umemoto, T., & Sato, F. 2005, PASJ, 57, S1 [NASA ADS] (In the text)
- Falgarone, E., & Phillips, T. G. 1996, ApJ, 472, 191 [NASA ADS] [CrossRef] (In the text)
- Falgarone, E., Panis, J.-F., Heithausen, A., et al. 1998, A&A, 331, 669 [NASA ADS]
- Gaustad, J. E., McCullough, P. R., Rosing, W., & Van Buren, D. 2001, PASP, 113, 1326 [NASA ADS] [CrossRef] (In the text)
- Goldreich, P., & Kwan, J. 1974, ApJ, 189, 441 [NASA ADS] [CrossRef] (In the text)
- Hartmann, D., & Burton, W. B. 1997, Atlas of galactic neutral hydrogen (Cambridge, New York: Cambridge University Press) (In the text)
- Herbig, G. H. 1968, ZAp, 68, 243 [NASA ADS]
- Knapp, G. R., & Jura, M. 1976, ApJ, 209, 782 [NASA ADS] [CrossRef]
- Kopp, M., Gerin, M., Roueff, E., & Le Bourlot, J. 1996, A&A, 305, 558 [NASA ADS]
- Lambert, D. L., Sheffer, Y., Gilliland, R. L., & Federman, S. R. 1994, ApJ, 420, 756 [NASA ADS] [CrossRef]
- Langer, W. D., Glassgold, A. E., & Wilson, R. W. 1987, ApJ, 322, 450 [NASA ADS] [CrossRef]
- Liszt, H. S. 1979, ApJ, 233, L147 [NASA ADS] [CrossRef]
- Liszt, H. S. 1997, A&A, 322, 962 [NASA ADS]
- Liszt, H. S. 2007a, A&A, 476, 291 [NASA ADS] [CrossRef] [EDP Sciences] (In the text)
- Liszt, H. S. 2007b, A&A, 461, 205 [NASA ADS] [CrossRef] [EDP Sciences] (In the text)
- Liszt, H. S., & Lucas, R. 1998, A&A, 339, 561 [NASA ADS]
- Liszt, H., Lucas, R., & Pety, J. 2006, A&A, 448, 253 [NASA ADS] [CrossRef] [EDP Sciences] (In the text)
- Maier, J. P., Lakin, N. M., Walker, G. A. H., & Bohlender, D. A. 2001, ApJ, 553, 267 [NASA ADS] [CrossRef] (In the text)
- Morton, D. C. 1975, ApJ, 197, 85 [NASA ADS] [CrossRef]
- Pety, J., & Falgarone, E. 2003, A&A, 412, 417 [NASA ADS] [CrossRef] [EDP Sciences] (In the text)
- Pety, J., Lucas, R., & Liszt, H. 2008, A&A, 489, 217 [NASA ADS] [CrossRef] [EDP Sciences]
- Rachford, B. L., Snow, T. P., Tumlinson, J., et al. 2002, ApJ, 577, 221 [NASA ADS] [CrossRef]
- Savage, B. D., Drake, J. F., Budich, W., & Bohlin, R. C. 1977, ApJ, 216, 291 [NASA ADS] [CrossRef] (In the text)
- Schlegel, D. J., Finkbeiner, D. P., & Davis, M. 1998, ApJ, 500, 525 [NASA ADS] [CrossRef] (In the text)
- Sonnentrucker, P., Welty, D. E., Thorburn, J. A., & York, D. G. 2007, ApJS, 168, 58 [NASA ADS] [CrossRef]
- Tachihara, K., Abe, R., Onishi, T., Mizuno, A., & Fukui, Y. 2000, PASJ, 52, 1147 [NASA ADS] (In the text)
- Van Dishoeck, E. F., & Black, J. H. 1986, ApJS, 62, 109 [NASA ADS] [CrossRef]
- Van Dishoeck, E. F., & Black, J. H. 1988, ApJ, 334, 771 [NASA ADS] [CrossRef]
- Wannier, P., Penprase, B. E., & Andersson, B.-G. 1997, ApJ, 487, L165 [NASA ADS] [CrossRef] (In the text)
- Wannier, P. G., Penzias, A. A., & Jenkins, E. B. 1982, ApJ, 254, 100 [NASA ADS] [CrossRef]
- Wolfire, M. G., Hollenbach, D., McKee, C. F., Tielens, A. G. G. M., & Bakes, E. L. O. 1995, ApJ, 443, 152 [NASA ADS] [CrossRef]
- Wolfire, M. G., McKee, C. F., Hollenbach, D., & Tielens, A. G. G. M. 2003, ApJ, 587, 278 [NASA ADS] [CrossRef]
- Wood, K., Haffner, L. M., Reynolds, R. J., Mathis, J. S., & Madsen, G. 2005, ApJ, 633, 295 [NASA ADS] [CrossRef] (In the text)
All Figures
| |
Figure 1:
Limiting reddening (Schlegel et al. 1998) and 12CO J=1-0 emission
(Tachihara et al. 2000) in the vicinity of |
| Open with DEXTER | |
| In the text | |
| |
Figure 2:
Integrated H I line brightness from the LDSS survey of
Hartmann & Burton (1997) at 35 |
| Open with DEXTER | |
| In the text | |
| |
Figure 3:
Integrated intensity of the CO line
|
| Open with DEXTER | |
| In the text | |
| |
Figure 4:
Cumulative probability distributions of the
integrated intensity
|
| Open with DEXTER | |
| In the text | |
| |
Figure 5:
Mean spectra over the diffuse and dark sub-portions
defined in Fig. 3: the profiles in the diffuse gas (L121)
are those at
lower velocity. The integrated brightnesses are
|
| Open with DEXTER | |
| In the text | |
| |
Figure 6:
Statistics of line profile velocity dispersions in the
diffuse gas. Large outer panel: cumulative probability distribution
histograms of the measured velocity dispersion
|
| Open with DEXTER | |
| In the text | |
| |
Figure 7:
Longitude-velocity diagrams traversing the |
| Open with DEXTER | |
| In the text | |
| |
Figure 8:
The longitude-velocity diagram at
b = 22.6 |
| Open with DEXTER | |
| In the text | |
| |
Figure 9:
Models of 12CO formation and excitation. Results are shown for models
having n(H) = n(H I) + 2n(H2) =
|
| Open with DEXTER | |
| In the text | |
| |
Figure 10:
Comparison of the limiting extinction
|
| Open with DEXTER | |
| In the text | |
| |
Figure 11: Maps of various quantities, available online. Top left and right, peak and integrated brightness. Middle: mean velocity and velocity dispersion. Bottom, the velocity gradient. |
| Open with DEXTER | |
| In the text | |
Copyright ESO 2009
Current usage metrics show cumulative count of Article Views (full-text article views including HTML views, PDF and ePub downloads, according to the available data) and Abstracts Views on Vision4Press platform.
Data correspond to usage on the plateform after 2015. The current usage metrics is available 48-96 hours after online publication and is updated daily on week days.
Initial download of the metrics may take a while.