| Issue |
A&A
Volume 499, Number 1, May III 2009
|
|
|---|---|---|
| Page(s) | 249 - 256 | |
| Section | Interstellar and circumstellar matter | |
| DOI | https://doi.org/10.1051/0004-6361/200911654 | |
| Published online | 25 March 2009 | |
Abundances in the planetary nebula NGC 6210![[*]](/icons/foot_motif.png)
S. R. Pottasch1 - J. Bernard-Salas2 - T. L. Roellig3
1 - Kapteyn Astronomical Institute, PO Box 800, 9700 AV Groningen, The Netherlands
2 - Center for Radiophysics and Space Research, Cornell University, Ithaca, NY 14853, USA
3 - NASA Ames Research Center, MS 245-6, Moffett Field, CA 94035-1000, USA
Received 13 January 2009 / Accepted 17 March 2009
Abstract
The spectra of the planetary nebula NGC 6210 is reanalysed using spectral measurements made in the mid-infrared with the Spitzer Space Telescope and the Infrared Space Observatory. The aim is to determine the chemical composition of this object. We also make use of IUE and ground based spectra. Abundances determined from the mid-infrared lines, which
are insensitive to electron temperature, are used as the basis for the determination of the composition, which is found to differ somewhat from earlier results. The abundances found, especially the low value of helium and oxygen, indicate that the central star was originally of rather low mass, probably ![]() 1
1 ![]() .
Abundances of phosphorus, iron, silicon, sodium, potassium and chlorine have been determined, some for the first time in this nebula. The electron temperature in this nebula is constant. The temperature, radius and luminosity of the central star is also discussed. It is shown that the luminosity is consistent with that predicted for a star of 0.9
.
Abundances of phosphorus, iron, silicon, sodium, potassium and chlorine have been determined, some for the first time in this nebula. The electron temperature in this nebula is constant. The temperature, radius and luminosity of the central star is also discussed. It is shown that the luminosity is consistent with that predicted for a star of 0.9 ![]() .
But the predicted nebular age is inconsistent with the observed kinetic age.
.
But the predicted nebular age is inconsistent with the observed kinetic age.
Key words: ISM: abundances - planetary nebulae: individual: NGC 6210 - infrared: ISM - stars: evolution
1 Introduction
NGC 6210 (PN G043.1+37.7) is a rather bright planetary nebula located at an unusually high galactic latitude and has only a small extinction. The nebula has an unusual morphology. It is usually classified as ellipsoidal, although Hajian et al. (1995) refer to it as ``very amorphous and irregular''. An HST photograph of the nebula is shown in Fig. 1. This is the
brightest part of the nebula. The central star is clearly seen in the photograph; while the brightest part of the nebula lies to the north of the central star. Various small scale structures are also present. Most of the emission is present within a region of about 12
![]()
![]() 8
8
![]() .
This region is surrounded by a halo-like structure with a diameter about twice as large and of much lower surface brightness, less than 1% of the brighter parts of the nebula. A long exposure photograph of the nebula is shown in Fig. 2 where it can be seen that there are four arm-like extensions in the halo. Phillips & Cuesta (1996) have shown that these
features have a somewhat different spectrum than that of the main nebula. The integrated spectrum which is studied in this paper is essentially from the main part of the nebula, both because the halo emission is relatively small and because the size of the diaphragm limits the measurement to the central region.
.
This region is surrounded by a halo-like structure with a diameter about twice as large and of much lower surface brightness, less than 1% of the brighter parts of the nebula. A long exposure photograph of the nebula is shown in Fig. 2 where it can be seen that there are four arm-like extensions in the halo. Phillips & Cuesta (1996) have shown that these
features have a somewhat different spectrum than that of the main nebula. The integrated spectrum which is studied in this paper is essentially from the main part of the nebula, both because the halo emission is relatively small and because the size of the diaphragm limits the measurement to the central region.
Because the nebula is found 38 degrees above the galactic plane it has only a small extinction. It is probably a nearby nebula since most PNe are located close to the galactic plane. An expansion distance has been measured by Hajian et al. (1995) to be 1.57 kpc. Although this is an uncertain distance it is not an unreasonable one since it agrees with the distance found from the rms density. It is also similar to various statistical distances listed in Acker et al. (1992).
A bright central star can be seen in Fig. 1. It has a magnitude V=12.66 and B=12.44 (Acker et al. 1992). Mendez (1991) who measured the spectrum of the star calls it a hydrogen rich central star of type O(H). The hydrogen Zanstra temperature is about 50 000 K, and is somewhat less than the ionized helium Zanstra temperature which is close to 61 000 K. A discussion of the stellar continuum between 1500 Å and 3000 Å by Pottasch et al. (1978) gave the rather low temperature of 38 000 K; this is too low to ionize helium. We discuss the stellar temperature toward the end of this paper.
The purpose of this paper is to study the elemental abundances in this nebula with the help of mid-infrared spectra, in the hope that the chemical abundances will shed some light on the evolution of this nebula-central star combination. The most important previous abundances studies of this nebula are those of Liu et al. (2004a) and of Kwitter & Henry (1998). Both of these groups use optical nebular spectra (taken by themselves) and ultraviolet IUE spectra. Liu et al. (2004a) also use ISO infrared measurements. Kwitter & Henry (1998) find the abundance of the five elements He, C, N, O and Ne. Liu et al. (2004a) increase this number to eight by including S, Ar and Cl. Here the number of elements is increased to 13 by including P, Fe, K, Na and an uncertain abundance of Si.
We have measured the spectrum of NGC 6210 in the mid-infrared with the IRS spectrograph of the Spitzer Space Telescope (Werner et al. 2004). These infrared measurements are combined with the ISO infrared spectrum. The use of the mid-infrared spectrum permits a more accurate determination of the abundances. The reasons for this have been discussed in earlier studies (e.g. see Pottasch & Beintema 1999; Pottasch et al. 2000, 2001; Bernard Salas et al. 2001), and can be summarized as follows.
![\begin{figure}
\par\includegraphics[width=8.5cm,clip]{ngc6210-2.eps} %
\end{figure}](/articles/aa/full_html/2009/19/aa11654-09/img5.png) |
Figure 1:
An HST image of NGC 6210. The width of the photograph is 15.8
|
| Open with DEXTER | |
![\begin{figure}
\par\includegraphics[width=8cm,clip]{n6210a_hst1.eps} %
\end{figure}](/articles/aa/full_html/2009/19/aa11654-09/img6.png) |
Figure 2:
A long exposure HST image of NGC 6210 emphasising the halo structure. The width of the photograph is 42
|
| Open with DEXTER | |
The most important advantage comes from the fact that the infrared lines originate from very low energy levels and thus give an abundance which is not sensitive to the temperature in the nebula, nor to possible temperature fluctuations. Furthermore, when a line originating from a high-lying energy level in the same ion is observed, it is possible to determine an average electron temperature at which the lines in that particular ion are formed. When this average temperature for many ions is determined, a plot of may be made of the electron temperature against ionization potential, which can be used to determine the average electron temperature of other ions as function of ionization potential.
Use of the infrared spectra have further advantages. One of them is that the number of observed ions used in the abundance analysis is approximately doubled, which removes the need for using large ionization correction factors (ICFs), thus substantially lowering the uncertainty in the abundance of some elements. A further advantage is that the extinction in the infrared is almost negligible, eliminating the need to include sometimes large correction factors. This is not very important in this nebula because the extinction is small. The number of elements that can be measured increases when including the infrared. In this nebula infrared lines of Na, P, K, Fe and Si are measured.
The paper is structured as follows. First the Spitzer spectrum of NGC 6210 is presented and discussed (in Sect. 2), followed by a discussion of the ISO spectrum (Sect. 3). Then the intrinsic
H![]() flux is determined using both the measurements of the infrared hydrogen lines and the radio continuum flux density (Sect. 4). The visible spectrum of the nebula is also presented in Sect. 4
together with a new reduction of the ultraviolet (IUE) spectrum. This is followed by a discussion of the nebular electron temperature and density and the chemical composition of NGC 6210 (Sect. 5). A comparison of the resulting abundances with those in the literature is given in Sect. 6 and the possible evolution is discussed in Sect. 7. This section also includes a discussion of nebular dust. In Sect. 8 the central star is discussed, followed by a general discussion and concluding remarks (Sect. 9).
flux is determined using both the measurements of the infrared hydrogen lines and the radio continuum flux density (Sect. 4). The visible spectrum of the nebula is also presented in Sect. 4
together with a new reduction of the ultraviolet (IUE) spectrum. This is followed by a discussion of the nebular electron temperature and density and the chemical composition of NGC 6210 (Sect. 5). A comparison of the resulting abundances with those in the literature is given in Sect. 6 and the possible evolution is discussed in Sect. 7. This section also includes a discussion of nebular dust. In Sect. 8 the central star is discussed, followed by a general discussion and concluding remarks (Sect. 9).
2 The IRS infrared spectrum of NGC 6210
The observations of NGC 6210 were made using the Infrared Spectrograph (IRS, Houck et al. 2004) on board the Spitzer Space Telescope with AORkeys of 4109056 (on target) and 4109312 (background). The data were processed using the s15.3 version of the pipeline and using a script version of Smart (Higdon et al. 2004). The reduction started from the droop images which are equivalent to the bcd images but lack stray-cross removal and flatfield. The tool irsclean was used to remove rogue pixels. The different cycles for a given module were combined to enhance the S/N. At this point the background images were subtracted to remove the sky contribution. Then the resulting HR images were extracted using full aperture measurements.
The great advantage of the IRS high resolution spectra compared to the ISO SWS spectra is the very high sensitivity of the IRS. Otherwise the two instruments are comparable. The IRS high resolution spectra have a spectral resolution of about 600. The IRS high resolution instrument measures in two spectral ranges with two different modules: the short high module (SH) from 9.9 ![]() m to 19.6
m to 19.6 ![]() m and the long high module (LH) from 18.7
m and the long high module (LH) from 18.7 ![]() m to 37.2
m to 37.2 ![]() m. The SH has a slit size of
4.7
m. The SH has a slit size of
4.7
![]()
![]() 11.3
11.3
![]() ,
while the LH is 11.1
,
while the LH is 11.1
![]()
![]() 22.3
22.3
![]() .
.
Table 1: IRS spectrum of NGC 6210.
The IRS measurement of NGC 6210 was centered at RA(2000) 16![]() 44
44![]() 29.49
29.49![]() and Dec(2000) +23°47
and Dec(2000) +23°47![]() 59.7
59.7
![]() .
This is almost the same as the value measured by Kerber et al. (2003) of RA(2000) 16
.
This is almost the same as the value measured by Kerber et al. (2003) of RA(2000) 16![]() 44
44![]() 29.521
29.521![]() and Dec(2000) +23°47
and Dec(2000) +23°47![]() 59.55
59.55
![]() .
Thus the IRS measurement was well centered on the nebula and both the LH and SH diaphragms measured the inner, brighter nebula. Since the LH diaphragm is larger, almost all of the inner nebula is seen in this diaphragm. Some of the nebula was missed in the SH measurement and therefore a correction must be made to bring the two measurements to the same scale. This can be done in several ways. First by making use of the fact that the two spectrographs had a small wavelength region in common at about 19
.
Thus the IRS measurement was well centered on the nebula and both the LH and SH diaphragms measured the inner, brighter nebula. Since the LH diaphragm is larger, almost all of the inner nebula is seen in this diaphragm. Some of the nebula was missed in the SH measurement and therefore a correction must be made to bring the two measurements to the same scale. This can be done in several ways. First by making use of the fact that the two spectrographs had a small wavelength region in common at about 19 ![]() m. To make the continuum emission at this wavelength equal, the SH emission had to be increased by a factor 1.95. But this factor may also be found by making use of the fact that both [Ne III] and [Cl IV] have lines in both the SH and LH spectra and that the ratio of these lines has only a small density dependence. The ratio of the [Ne III] lines require a factor of 1.75 while the [Cl IV] lines require a still lower factor. But one of the [Cl IV] lines is weak and not much weight is given to these
lines. A value of 1.77 is used to bring the SH intensities to the same scale as the LH values. There is a small uncertainty in this value, which has the consequence that uncertainty of the SH intensities, and hence the abundance of sulfur and sodium, is increased by 10%.
m. To make the continuum emission at this wavelength equal, the SH emission had to be increased by a factor 1.95. But this factor may also be found by making use of the fact that both [Ne III] and [Cl IV] have lines in both the SH and LH spectra and that the ratio of these lines has only a small density dependence. The ratio of the [Ne III] lines require a factor of 1.75 while the [Cl IV] lines require a still lower factor. But one of the [Cl IV] lines is weak and not much weight is given to these
lines. A value of 1.77 is used to bring the SH intensities to the same scale as the LH values. There is a small uncertainty in this value, which has the consequence that uncertainty of the SH intensities, and hence the abundance of sulfur and sodium, is increased by 10%.
Measurements have also been made with the low resolution spectrograph (called SL) (AORkey 4109056) which is in the form of a long slit with a width of 3.6
![]() .
The spectrum is measured from 5.5
.
The spectrum is measured from 5.5 ![]() m to 14
m to 14 ![]() m using a fix column extraction window of 4
m using a fix column extraction window of 4
![]() .
The resolution is about a
factor of 10 lower than the high resolution measurements. They are scaled so that the two strongest lines in the region of overlap, the [S IV] line at 10.506
.
The resolution is about a
factor of 10 lower than the high resolution measurements. They are scaled so that the two strongest lines in the region of overlap, the [S IV] line at 10.506 ![]() m and the [Ne II] at
12.808
m and the [Ne II] at
12.808 ![]() m have the same intensity. The measured emission line intensities are given in Table 1, after correcting the SH measurements by the factor 1.77 and the SL measurements by a factor of 2.40. These values are given in the column labeled ``intensity''. The fluxes were measured using the Gaussian line-fitting routine and derived for each nod position independently. The uncertainty in the fluxes was assumed to be the larger of either the difference between the flux in the nod positions, or the uncertainty in the fit. The last column gives the ratio of the intensity to H
m have the same intensity. The measured emission line intensities are given in Table 1, after correcting the SH measurements by the factor 1.77 and the SL measurements by a factor of 2.40. These values are given in the column labeled ``intensity''. The fluxes were measured using the Gaussian line-fitting routine and derived for each nod position independently. The uncertainty in the fluxes was assumed to be the larger of either the difference between the flux in the nod positions, or the uncertainty in the fit. The last column gives the ratio of the intensity to H![]() where the H
where the H![]() is found from the strongest hydrogen line(s) measured in the IRS spectrum. It has been assumed that the theoretical ratio of the sum of the two hydrogen lines at 12.372
is found from the strongest hydrogen line(s) measured in the IRS spectrum. It has been assumed that the theoretical ratio of the sum of the two hydrogen lines at 12.372 ![]() m to H
m to H![]() has a value of 1.04
has a value of 1.04 ![]() 10-2, which is the value given by Hummer & Storey (1987) for an electron temperature of 10 000 K. No correction for extinction is made since it is very small. This means that the value of H
10-2, which is the value given by Hummer & Storey (1987) for an electron temperature of 10 000 K. No correction for extinction is made since it is very small. This means that the value of H![]() through the LH diaphragm is 1.1
through the LH diaphragm is 1.1 ![]() 10-10 erg cm-2 s-1 and the correction for reddening to H
10-10 erg cm-2 s-1 and the correction for reddening to H![]() is
automatically included. Note that lines with wavelength less than 10
is
automatically included. Note that lines with wavelength less than 10 ![]() m are measured in the low resolution spectrograph.
m are measured in the low resolution spectrograph.
Table 2: ISO spectrum of NGC 6210.
3 The ISO infrared spectrum of NGC 6210
The ISO measurements of NGC 6210 are shown in Table 2. As can be seen from the table, the wavelength covered is considerably larger than the IRS measurements but because the sensitivity is lower only the stronger lines are seen. The intensities measured are given in Col. 3 of the table and are accurate to about 20%. Two of the three SWS measurements, especially SWS02 TDT 28100801 which is essentially the data shown in the table, are centered at about the same position as the IRS measurements, namely RA(2000) 16![]() 44
44![]() 29.40
29.40![]() and Dec(2000) +23°48
and Dec(2000) +23°48![]() 00.4
00.4
![]() .
But in spite of this, slightly less emission is being measured by the ISO. This is seen from the measurement of the hydrogen lines at 4.052 and 7.460 which indicate an H
.
But in spite of this, slightly less emission is being measured by the ISO. This is seen from the measurement of the hydrogen lines at 4.052 and 7.460 which indicate an H![]() flux of 0.88
flux of 0.88 ![]() 10-10 erg cm-2 s-1 as compared to the IRS measurement of H
10-10 erg cm-2 s-1 as compared to the IRS measurement of H![]() = 1.1
= 1.1 ![]() 10-10 erg cm-2 s-1. This is not a large difference and may simply be due to measurement error. But it could be related to the somewhat smaller ISO diaphragm below 12
10-10 erg cm-2 s-1. This is not a large difference and may simply be due to measurement error. But it could be related to the somewhat smaller ISO diaphragm below 12 ![]() m. Thus for the ISO results a value of 0.88
m. Thus for the ISO results a value of 0.88 ![]() 10-10 erg cm-2 s-1 is used below 12
10-10 erg cm-2 s-1 is used below 12 ![]() m, a value of 1.0
m, a value of 1.0 ![]() 10-10 erg cm-2 s-1 between this wavelength and 27
10-10 erg cm-2 s-1 between this wavelength and 27 ![]() m, and 1.1
m, and 1.1 ![]() 10-10 erg cm-2 s-1, the value deduced from the radio observations in the following section for the intensities made with the larger diaphragms above this wavelength. For the wavelengths above 50
10-10 erg cm-2 s-1, the value deduced from the radio observations in the following section for the intensities made with the larger diaphragms above this wavelength. For the wavelengths above 50 ![]() m the LWS02 TDT28100802 measurement is used.
m the LWS02 TDT28100802 measurement is used.
4 Extinction, visual and ultraviolet spectra
There are several methods for obtaining the extinction. The dip at ![]() 2200 Å gives a value of EB-V = 0.08 (C=0.12) (Pottasch 1984). Using the B and V stellar magnitudes quoted above leads to a value EB-V = 0.09. The extinction obtained by comparing the observed and theoretical Balmer decrement gives a value C=0.075 (Kwitter & Henry 1998) or C=0.13 (Liu et al. 2004a). Another accurate method is a comparison of radio emission with H
2200 Å gives a value of EB-V = 0.08 (C=0.12) (Pottasch 1984). Using the B and V stellar magnitudes quoted above leads to a value EB-V = 0.09. The extinction obtained by comparing the observed and theoretical Balmer decrement gives a value C=0.075 (Kwitter & Henry 1998) or C=0.13 (Liu et al. 2004a). Another accurate method is a comparison of radio emission with H![]() flux.
flux.
4.1 The 6 cm radio emission
The 6 cm flux density has been measured by Becker et al. (1991) and Gregory & Condon (1991). Both of these authors find a value of 374 mJy. Using values of ![]() and helium abundance determined below together with the equation quoted in Pottasch (1984) implies an H
and helium abundance determined below together with the equation quoted in Pottasch (1984) implies an H![]() flux of 1.10
flux of 1.10 ![]() 10-10 erg cm-2 s-1. Combining this with the measured value of H
10-10 erg cm-2 s-1. Combining this with the measured value of H![]() = 8.07
= 8.07 ![]() 10-11 erg cm-2 s-1 leads to a value of
C=0.14, a value in close agreement with the values quoted above. This value (C=0.14) will be used when necessary in this paper.
10-11 erg cm-2 s-1 leads to a value of
C=0.14, a value in close agreement with the values quoted above. This value (C=0.14) will be used when necessary in this paper.
4.2 The visual spectrum
The visual spectrum has been measured by several authors. The highest resolution spectrum is by Liu et al. (2004a). These spectra are also the deepest. Reliable spectra have also been reported by Kwitter & Henry (1998) and confirm the intensities of the stronger lines found by Liu et al. (2004a) which were taken by scanning over the entire nebula with a long slit. The spectrum of Liu et al. (2004a) refers to approximately the same region as the infrared measurements and will be used in this paper. The results are reproduced in Table 3 where Cols. 3 and 4 give the intensities measured and corrected for extinction relative to H![]() = 100 for the lines of interest in this paper. The error is estimated to be about 10% error for the strongest lines to about 30% for the weakest lines.
= 100 for the lines of interest in this paper. The error is estimated to be about 10% error for the strongest lines to about 30% for the weakest lines.
Table 3: Visual spectrum of NGC 6210.
4.3 The IUE ultraviolet spectrum
There are 31 low resolution IUE observations of this nebula as well as seven high resolution observations. Most were taken with the large aperature (10
![]()
![]() 23
23
![]() )
with varying exposure times, but quite a few were taken with a small aperature (3
)
with varying exposure times, but quite a few were taken with a small aperature (3
![]() diameter). We find that the small aperature measurements are too noisy and we do not use them. The large aperture measurements cover most of the nebula when they are centered on the nebula. We have used some of the
highest S/N observations made with longer exposure times. Both high and low resolution measurements were used from both the short and longwavelength spectral regions. From the low resolution measurements we have used SWP01904, SWP54962 and LWR10117. The high resolution observations used were LWR14149, LWP02869 and SWP22384. We have checked that the strongest lines are not saturated by measuring these same lines on spectra with shorter exposure times. The results are shown in Table 4. The uncertainties are about the same as given by Kwitter & Henry (1998), about 10% for the strongest lines and about 25% for the weaker lines. An exception to this is the O III line at
diameter). We find that the small aperature measurements are too noisy and we do not use them. The large aperture measurements cover most of the nebula when they are centered on the nebula. We have used some of the
highest S/N observations made with longer exposure times. Both high and low resolution measurements were used from both the short and longwavelength spectral regions. From the low resolution measurements we have used SWP01904, SWP54962 and LWR10117. The high resolution observations used were LWR14149, LWP02869 and SWP22384. We have checked that the strongest lines are not saturated by measuring these same lines on spectra with shorter exposure times. The results are shown in Table 4. The uncertainties are about the same as given by Kwitter & Henry (1998), about 10% for the strongest lines and about 25% for the weaker lines. An exception to this is the O III line at ![]() 3133 which was only measured in low resolution because the high resolution spectra did not cover this region. The low resolution measurements show the C IV line at
3133 which was only measured in low resolution because the high resolution spectra did not cover this region. The low resolution measurements show the C IV line at ![]() 1548 in emission, but the higher resolution measurements show
that this is a combination of absorption and emission; therefore we have not included this line.
1548 in emission, but the higher resolution measurements show
that this is a combination of absorption and emission; therefore we have not included this line.
The extinction correction was made by assuming a theoretical ratio for the He II line ratio ![]() 1640/
1640/![]() 4686 Å at T = 10 000 K and an
4686 Å at T = 10 000 K and an ![]() of 103 cm-3. The ratio of
of 103 cm-3. The ratio of ![]() 1640 to H
1640 to H![]() can then be found using the
can then be found using the ![]() 4686/H
4686/H![]() ratio in Table 3 together with the theoretical ratio, which leads to a value of the
ratio in Table 3 together with the theoretical ratio, which leads to a value of the ![]() 1640 Å line as given in Col. (3) of Table 4. A further correction for extinction relative to
1640 Å line as given in Col. (3) of Table 4. A further correction for extinction relative to ![]() 1640 Å is then made using the reddening curve of Fluks et al. (1994) but because of the small extinction this is never more than 20%, which indicates the uncertainties of the UV intensities above the errors of measurement given above. The results are shown in the last two columns of Table 4.
1640 Å is then made using the reddening curve of Fluks et al. (1994) but because of the small extinction this is never more than 20%, which indicates the uncertainties of the UV intensities above the errors of measurement given above. The results are shown in the last two columns of Table 4.
Table 4: IUE Spectrum of NGC 6210.
5 Chemical composition of the nebulae
The method of analysis is the same as used in the papers cited in the introduction. First the electron density and temperature as a function of the ionization potential are determined. A constant electron density and temperature are found. Using these values the elemental abundances are derived.
Table 5: Electron density indicators in NGC 6210.
5.1 Electron density
The ions used to determine
![]() are listed in the first column of Table 5. The ionization potential required to reach this stage of ionization, and the wavelengths of the lines used, are given in Cols. 2 and 3 of the table. Note that the wavelength units are Å when 4 figures are given and microns when 3 figures are shown. The observed ratio of the lines is given in the fourth column; the corresponding
are listed in the first column of Table 5. The ionization potential required to reach this stage of ionization, and the wavelengths of the lines used, are given in Cols. 2 and 3 of the table. Note that the wavelength units are Å when 4 figures are given and microns when 3 figures are shown. The observed ratio of the lines is given in the fourth column; the corresponding ![]() is given in the fifth column. The temperature used is 10 000 K, but is unimportant since these line ratios are essentially determined by the
density. No density is given from the Ne III lines because of the uncertainty of the 36
is given in the fifth column. The temperature used is 10 000 K, but is unimportant since these line ratios are essentially determined by the
density. No density is given from the Ne III lines because of the uncertainty of the 36 ![]() m line intensity. The density from the C III] lines is uncertain because the measurements are uncertain.
m line intensity. The density from the C III] lines is uncertain because the measurements are uncertain.
There is no firm indication that the electron density varies with ionization potential in a systematic way. The electron density appears to be between 3000 and 4000 cm-3. The error is about 30%. It is interesting to compare this value of the density with the rms density found
from the H![]() line. This depends on the distance of the nebula for which a value of 1.6 kpc is used, and on the angular size of the nebula. For this calculation a diameter of 16.5
line. This depends on the distance of the nebula for which a value of 1.6 kpc is used, and on the angular size of the nebula. For this calculation a diameter of 16.5
![]() is used. This gives an rms density of 3000 cm-3 for brighter regions. The agreement is very good although the error in the rms density is rather large. We will use a density of 3000 cm-3 in further discussion of the abundances, which will not be affected in an important way by the uncertainty in density.
is used. This gives an rms density of 3000 cm-3 for brighter regions. The agreement is very good although the error in the rms density is rather large. We will use a density of 3000 cm-3 in further discussion of the abundances, which will not be affected in an important way by the uncertainty in density.
5.2 Electron temperature
A number of ions have lines originating from energy levels far enough apart that their ratio is sensitive to the electron temperature. These are listed in Table 6 which is arranged similarly to the previous table. It can be seen that the electron temperature is roughly constant as a function of ionization potential. The electron temperature has also been determined from the Balmer jump to be 9300 K. (Liu et al. 2004b). Some PNe show a gradient of electron temperature but if any gradient exists in this nebula, is can only be seen in the slightly higher temperatures for the lowest ionization potentials (presumably formed in the outer regions of the nebula). We shall use a value of 9500 K as a constant nebular temperature.
Table 6: Electron temperature indicators in NGC 6210.
5.3 Ion and element abundances
The ion abundances have been determined using the following equation:
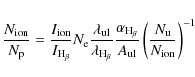
where
Table 7: Ionic concentrations and chemical abundances in NGC 6210.
The results are given in Table 7, where the first column lists the ion concerned, the second column the line used for the abundance determination, and the third column gives the intensity of the line
used relative to H![]() = 100. The fourth column gives the value of the ionic abundance assuming the ion is formed at 9500 K, while the fifth column gives the ionization correction factor (ICF),
which has been determined empirically. Notice that the ICF is unity (or almost unity) for many elements listed in the table: He, C, O, N, Ne, Cl, Ar and probably Fe. The ICF is large for Si, P, Na and K for which an important stage of ionization has not been measured. The ICF for Si and P
has been determined by comparing the observed ionization stages with those of sulfur which has very similar ionization potential as these two elements. For Na we note that Na++ has a high ionization potential so that higher stages of ionization are quite small. The correction for Na+ is however difficult to make and could be overestimated. The correction for K
was made by comparing the observed ionization stages with those of Ar which has very similar ionization potentials.
= 100. The fourth column gives the value of the ionic abundance assuming the ion is formed at 9500 K, while the fifth column gives the ionization correction factor (ICF),
which has been determined empirically. Notice that the ICF is unity (or almost unity) for many elements listed in the table: He, C, O, N, Ne, Cl, Ar and probably Fe. The ICF is large for Si, P, Na and K for which an important stage of ionization has not been measured. The ICF for Si and P
has been determined by comparing the observed ionization stages with those of sulfur which has very similar ionization potential as these two elements. For Na we note that Na++ has a high ionization potential so that higher stages of ionization are quite small. The correction for Na+ is however difficult to make and could be overestimated. The correction for K
was made by comparing the observed ionization stages with those of Ar which has very similar ionization potentials.
The error of measurement of the IRS intensities (see Table 1) is usually small, often not more than 5-7%. In the few cases when the error is large this has either been indicated with a ``:'' or by not using the line. The correction for adjusting the SH to LH intensity scales and the diaphragm size is probably small, about 10%. The uncertainty of the collisional strengths introduces
an error of 10-15% so that the total error for the ions of neon, sulfur and argon determined with the IRS measurements is less than 20%. This will also be true of the abundances of these elements because the ICF for these elements is close to unity. The ultraviolet measurements are less certain but only carbon is affected by these measurements. In addition the temperature is more
important for the carbon ions and the total errors may be twice as large. The element abundances are given in the last column of Table 7. The recombination line abundances of carbon and magnesium are
given at the end of the table. The recombination line abundance of C++ is a factor of three higher than the value deduced from the collisionally excited lines at ![]() 1906 Å. Liu et al. (2004a) have found that this is true for all 12 PNe which they have studied. The reason for this is not yet completely understood. Here as in other recent papers the abundances
determined from the collisionally excited lines are used.
1906 Å. Liu et al. (2004a) have found that this is true for all 12 PNe which they have studied. The reason for this is not yet completely understood. Here as in other recent papers the abundances
determined from the collisionally excited lines are used.
The helium abundance was derived using the theoretical work of Benjamin et al. (1999) and Porter et al. (2005). For recombination of singly ionized helium, most weight is given to the ![]() 5875Å line, because the theoretical determination of this line is the most reliable.
5875Å line, because the theoretical determination of this line is the most reliable.
6 Comparison with other abundance determinations
Table 8 shows a comparison of our abundances with the most important determinations in the past years. Several of the elements have never been reported before. Good agreement is found for with the earlier determinations, especially those of Liu et al. (2004a). One of the reasons for this agreement is the fact that no noticeable electron temperature gradient has been found in agreement with the assumption made in the earlier analyses. The C/O ratio is clearly less than solar as has been reported earlier. Nitrogen is consistent with being solar in agreement with the value found by Liu et al. (2004a) but somewhat lower than the two other determinations listed. All of these elements as well as Ne, Ar and S are consistent with a solar abundance with a small influence of the galactocentric abundance gradient (-0.085 dex/kpc) as described for example by Pottasch & Bernard-Salas (2006). Iron, although the abundance is more uncertain than many of the other elements, is depleted by more than a factor of 30 with respect to the solar abundance, as it is in most of the nebulae already studied. Silicon appears depleted by a factor of 10. P, Cl, K and Na all seem to be slightly depleted with respect to the Sun by factors between two and three, but the abundances of P, K and Na are more uncertain because only a single ionization stage is observed. The abundance of Cl as determined in meteorites is a factor of two lower than listed for the Sun. Since the meteorite abundance determination is more reliable than the determination from the solar spectrum Cl may indeed have the solar abundance. The Mg abundance given by Liu et al. (2004a) is from a recombination line from the dominant Mg++ ion. Mg abundance has been determined in NGC 7662 and NGC 7027 from infrared collisionally excited lines of Mg+3 and Mg+4 which give the same Mg abundance in these two nebulae as that determined from the recombination line. This Mg abundance seems therefore to be reliable.
The comparison made in the table with the solar abundance is taken from Asplund et al. (2005). Note that for sulfur and chlorine more weight has been given to the abundance determination in meteorites since this determination is more accurate than for the Sun itself. Neon and argon abundances are taken from the references given in Pottasch & Bernard-Salas (2006).
Table 8: Comparison of abundances in NGC 6210.
7 Discussion of stellar evolution
The position of NGC 6210 is about 1 kpc above the galactic plane. This is unusual for a PNe and indicates that it is an old object. This is confirmed by the abundance analysis. The oxygen abundance is similar to the solar value. So is the helium abundance indicating that no helium has been formed in the course of evolution. The nitrogen abundance also has essentially the solar
value, indicating that little or no nitrogen has been produced. The low abundance of helium and nitrogen indicate that the second dredge-up may not have taken place. The carbon abundance is low, lower than solar although it is more uncertain than some of the other abundances. This low carbon abundance indicates that the third dredge-up has also not taken place and the PN has evolved from a star of low mass. In the evolution models of Karakas (2007) for a solar composition (Z=0.008) the carbon abundance begins to increase somewhere between the 1.5 ![]() and
1.75
and
1.75 ![]() initial mass models indicating that the initial mass of the star was less than 1.7
initial mass models indicating that the initial mass of the star was less than 1.7 ![]() .
The nitrogen abundance, according to these models, begins to increase for the lowest initial mass model, the 1
.
The nitrogen abundance, according to these models, begins to increase for the lowest initial mass model, the 1 ![]() model, by a factor of 2, due to the first dredge-up. Since this is more than the observed increase, this indicates that the PN has evolved from a star of
initial mass less than 1
model, by a factor of 2, due to the first dredge-up. Since this is more than the observed increase, this indicates that the PN has evolved from a star of
initial mass less than 1 ![]() .
If the Z=0.02 models were used the predicted nitrogen abundance is smaller and agrees with the observed increase. Because of the uncertainties both in the models and the observations, the best that can be concluded is that the initial mass is
.
If the Z=0.02 models were used the predicted nitrogen abundance is smaller and agrees with the observed increase. Because of the uncertainties both in the models and the observations, the best that can be concluded is that the initial mass is ![]() 1
1 ![]() .
.
The abundances of oxygen, sulfur and neon fit well on the abundances as a function of position in the galaxy as given by Pottasch & Bernard-Salas (2006). The abundances in NGC 6210 are very similar to several elliptical PNe close to the Sun. In particular the abundances are almost the same as in NGC 7662 (Pottasch et al. 2001) and quite similar to NGC 6826 (Surendiranath & Pottasch 2008). The carbon abundance is lower in NGC 6210 than in other elliptical nebulae studied (see Pottasch & Bernard-Salas 2006, for a summary). This is certainly due to the low initial mass of the exciting star.
7.1 Dust
From the abundances in Table 8 it may be seen that there are a number of elements whose abundance in NGC 6210 is more than a factor of 2 lower than the solar abundance. Since dust is known to be present in the nebula, a probable reason for the low abundance of these elements is that they are in the form of dust. Si, Fe and K have especially low abundances, a factor of almost 10 or more. There are other elements with an abundance lower by a factor of about 2. These are S, Cl, P, Na and Mg. For these latter elements several possibilities could explain the difference. For example the determination of the abundance, either nebular or solar, could be wrong. In fact, because the
sulfur abundance in all PNe and HII regions is always lower than the solar value, it has often been argued that the solar value is incorrect (e.g. Pottasch & Bernard-Salas 2006). If the difference between the measured abundance in NGC 6210 and the expected abundance in Si, Fe and K is in the form of dust, the ratio of dust mass to total mass is 2.6 ![]() 10-3. Si and Fe, being refractory, are expected to be associated with dust grains. But because at least some of these elements will be in the form of compounds with other elements this number will certainly be higher. There is no clear indication that a great deal of Mg is in the form of dust although a
small amount of MgS has been seen in the infrared spectrum of some nebulae. In addition sulfur would then be underabundant. Furthermore there is no indication that oxygen is underabundant and thus part of a dust compound. But if a limited amount of oxygen is tied up in molecules this might not be
noticed.
10-3. Si and Fe, being refractory, are expected to be associated with dust grains. But because at least some of these elements will be in the form of compounds with other elements this number will certainly be higher. There is no clear indication that a great deal of Mg is in the form of dust although a
small amount of MgS has been seen in the infrared spectrum of some nebulae. In addition sulfur would then be underabundant. Furthermore there is no indication that oxygen is underabundant and thus part of a dust compound. But if a limited amount of oxygen is tied up in molecules this might not be
noticed.
8 The central star
8.1 Stellar temperature
The central star has been discussed in the introduction and has been studied by several authors. Using the magnitude of the star given there it was concluded that the hydrogen Zanstra temperature is
![]() (H) =51 000 K and the ionized helium Zanstra temperature as 61 000 K. The energy balance temperature requires the knowledge of the ratio of the forbidden-line intensities to H
(H) =51 000 K and the ionized helium Zanstra temperature as 61 000 K. The energy balance temperature requires the knowledge of the ratio of the forbidden-line intensities to H![]() which is essentially the energy above the Lyman limit per ionizing photon. This value is found by summing the intensities given above, and is about 23.2 with only a minimal correction for unmeasured lines. Using Fig. 4 of Preite-Martinez & Pottasch (1983) and assuming that the star radiates as a blackbody this translates into a temperature of about 69 000 K. If a model atmosphere had been used instead of a blackbody, the energy balance temperature would be slightly lower. The energy balance temperature for NGC 6210 has also been given by Preite-Martinez et al. (1991) who find a somewhat lower value of 65 700 K. This is because they did not have the infrared measurements and were forced to estimated them. They therefore found a ratio of forbidden line intensity to H
which is essentially the energy above the Lyman limit per ionizing photon. This value is found by summing the intensities given above, and is about 23.2 with only a minimal correction for unmeasured lines. Using Fig. 4 of Preite-Martinez & Pottasch (1983) and assuming that the star radiates as a blackbody this translates into a temperature of about 69 000 K. If a model atmosphere had been used instead of a blackbody, the energy balance temperature would be slightly lower. The energy balance temperature for NGC 6210 has also been given by Preite-Martinez et al. (1991) who find a somewhat lower value of 65 700 K. This is because they did not have the infrared measurements and were forced to estimated them. They therefore found a ratio of forbidden line intensity to H![]() of 21.3. The low value of the hydrogen Zanstra temperature (
of 21.3. The low value of the hydrogen Zanstra temperature (
![]() (H)) may be due to the nebula being optically thin to radiation ionizing hydrogen, but it could also be due to departure from blackbody ionizing radiation. An average
stellar temperature of about 65 000 K is a reasonable first approximation. This is similar to the conclusion of Tinkler & Lamers (2002) who estimate a central star temperature of 74 000 K.
(H)) may be due to the nebula being optically thin to radiation ionizing hydrogen, but it could also be due to departure from blackbody ionizing radiation. An average
stellar temperature of about 65 000 K is a reasonable first approximation. This is similar to the conclusion of Tinkler & Lamers (2002) who estimate a central star temperature of 74 000 K.
Using a stellar temperature of 65 000 K and the magnitude and extinction given above, the radius of the star is R=0.35 ![]()
![]() .
The luminosity, using the distance (d=1.57 kpc) given in the introduction, is L=2000
.
The luminosity, using the distance (d=1.57 kpc) given in the introduction, is L=2000 ![]() .
.
The question arises as to whether this luminosity is consistent with the initial mass derived from the abundance of elements in Sect. 7. Schonberner (1983) has predicted the evolution of the luminosity of two stars, one with a luminosity of 0.8 ![]() ,
the other with a luminosity
of 1
,
the other with a luminosity
of 1 ![]() .
The observed luminosity of 2000
.
The observed luminosity of 2000 ![]() at a stellar temperature of 65 000 K lies just between these two predicted curves, thus predicting an initial mass of
at a stellar temperature of 65 000 K lies just between these two predicted curves, thus predicting an initial mass of ![]() = 0.9. This is very good agreement with the value derived in Sect. 7. On the other hand the curves of Schonberner (1983) predict an age for the nebula of about 40 000 years. This is much larger than the value of 2000 years derived from the radius of the nebula (1.7
= 0.9. This is very good agreement with the value derived in Sect. 7. On the other hand the curves of Schonberner (1983) predict an age for the nebula of about 40 000 years. This is much larger than the value of 2000 years derived from the radius of the nebula (1.7 ![]() 1012 km) and the nebular velocity. There is therefore only a partial agreement between theory and observation.
1012 km) and the nebular velocity. There is therefore only a partial agreement between theory and observation.
9 Conclusions
The nebular abundances of fourteen elements have been determined. Of the elements which have not been created in stellar evolution (O, Ne, S, Ar, Cl and possibly Si), O, Ne and Ar have abundances very similar to the solar abundance, while S and Cl are about a factor of two lower. The helium abundance is approximately solar; this probably indicates that no helium has been formed during the evolution of the central star. Carbon is lower than solar indicating that no third dredge-up has taken place. Nitrogen also has a solar abundance implying that little nitrogen has been formed, probably in the first dredge-up. A comparison of this low nitrogen abundance with the nitrogen
abundance expected from the models of Karakas leads to the conclusion that the central star has evolved from an object having a low initial mass, probably ![]() 1
1 ![]() .
All of the remaining
elements measured have abundances lower than solar. But some (P, Na and Mg) are only a factor of two less than solar, while Si, Fe and to a lesser extent K, are an order of magnitude less than solar. These latter elements are likely to be in the form of dust.
.
All of the remaining
elements measured have abundances lower than solar. But some (P, Na and Mg) are only a factor of two less than solar, while Si, Fe and to a lesser extent K, are an order of magnitude less than solar. These latter elements are likely to be in the form of dust.
The electron temperature is roughly constant throughout the nebula, in contrast to some nebulae in which a strong temperature gradient is found. The luminosity found from considering the central star is in agreement with that predicted for a star of 0.9 ![]() .
The observational age of the nebula is however much lower than the theory predicts.
.
The observational age of the nebula is however much lower than the theory predicts.
Acknowledgements
This work is based on observations made with the Spitzer Space Telescope, which is operated by the Jet Propulsion Laboratory, California Institute of Technology under NASA contract 1407. Support for this work was provided by NASA through Contract Number 1257184 issued by JPL/Caltech.
References
- Acker, A., Marcout, J., Ochsenbein, F., et al. 1992, Strasbourg-ESO catalogue (In the text)
- Asplund, M., Grevesse, N., & Sauval, A. J. 2005, ASP Conf. Ser. (Bash & Barnes) (In the text)
- Becker, R. H., White, R. L., & Edwards, A. L. 1991, ApJS, 75, 1 [NASA ADS] [CrossRef] (In the text)
- Benjamin, R. A., Skillman, E. D., & Smits, D. P. 1999, ApJ, 514, 307 [NASA ADS] [CrossRef] (In the text)
- Bernard Salas, J., Pottasch, S. R., Beintema, D. A., & Wesselius, P. R. 2001, A&A, 367, 949 [NASA ADS] [CrossRef] [EDP Sciences] (In the text)
- Fluks, M. A., Plez, B., de Winter, D., et al. 1994, A&AS, 105, 311 [NASA ADS] (In the text)
- Gregory, P. C., & Condon, J. J. 1991, ApJS, 75, 1011 [NASA ADS] [CrossRef] (In the text)
- Hajian, A. R., Terzian, Y., & Bignell, C. 1995, AJ, 109, 2600 [NASA ADS] [CrossRef] (In the text)
- Henry, R. B. C., Kwitter, K. B., & Balick, B. 2004, AJ, 127, 2284 [NASA ADS] [CrossRef]
- Higdon, S. J. U., Devost, D., Higdon, J. L., et al. 2004, PASP, 116, 975 [NASA ADS] [CrossRef] (In the text)
- Hippelein, H., & Munch, G. 1981, A&A, 95, 100 [NASA ADS]
- Houck, J. R., Appelton, P. N., Armus, L., et al. 2004, ApJS, 154, 18 [NASA ADS] [CrossRef] (In the text)
- Hummer, D. G., & Storey, P. J. 1987, MNRAS, 224, 801 [NASA ADS] (In the text)
- Karakas, A., & Lattanzio, J. C. 2007, PASA, 24, 103 [NASA ADS]; and Thesis (Karakas) 2003 (In the text)
- Kerber, F., Mignani, R. P., Guglielmetti, F., et al. 2003, A&A, 408, 1029 [NASA ADS] [CrossRef] [EDP Sciences] (In the text)
- Kwitter, K. B., & Henry, R. B. C. 1998, ApJ, 493, 247 [NASA ADS] [CrossRef] (In the text)
- Liu, Y., Liu, X.-W., Barlow, M. J., et al. 2004a, MNRAS, 353, 1251 [NASA ADS] [CrossRef] (In the text)
- Liu, Y., Liu, X.-W., Luo, S.-G., et al. 2004b, MNRAS, 353, 1231 [NASA ADS] [CrossRef] (In the text)
- Mendez, R. H. 1991, IAU Symp., 145, 375 [NASA ADS] (In the text)
- Phillips, J. P., & Cuesta, L. 1996, AJ, 111, 1227 [NASA ADS] [CrossRef] (In the text)
- Porter, R. L., Bauman, R. P., Ferland, G. J., et al. 2005, ApJ, 622, L73 [NASA ADS] [CrossRef] (In the text)
- Pottasch, S. R. 1984, Planetary Nebulae (Dordrecht: Reidel Publ. Co.) (In the text)
- Pottasch, S. R., & Beintema, D. A. 1999, A&A, 347, 974 (In the text)
- Pottasch, S. R., & Bernard-Salas, J. 2006, A&A, 457, 189 [NASA ADS] [CrossRef] [EDP Sciences] (In the text)
- Pottasch, S. R., Wesselius, P. R., Wu, C. C., et al. 1978, A&A, 62, 95 [NASA ADS] (In the text)
- Pottasch, S. R., Beintema, D. A., & Feibelman, W. A. 2000, A&A, 363, 767 [NASA ADS] (In the text)
- Pottasch, S. R., Beintema, D. A., Bernard Salas, J., & Feibelman, W. A. 2001, A&A, 380, 684 [NASA ADS] [CrossRef] [EDP Sciences] (In the text)
- Preite-Martinez, A., & Pottasch, S. R. 1983, A&A, 126, 31 [NASA ADS] (In the text)
- Preite-Martinez, A., Koppen, J., Acker, A., et al. 1991, A&AS, 88, 121 [NASA ADS] (In the text)
- Schonberner, D. 1983, ApJ, 272, 708 [NASA ADS] [CrossRef] (In the text)
- Surendiranath, R., & Pottasch, S. R. 2008, A&A, 483, 519 [NASA ADS] [CrossRef] [EDP Sciences] (In the text)
- Tinkler, C. M., & Lamers, H. J. G. L. M. 2002, A&A, 384, 987 [NASA ADS] [CrossRef] [EDP Sciences] (In the text)
- Werner, M., Roellig, T. L., Low, F. J., et al. 2004, ApJS, 154, 1 [NASA ADS] [CrossRef] (In the text)
Footnotes
- ... NGC 6210
- Based on observations with the Spitzer Space Telescope, which is operated by the Jet Propulsion Laboratory, California Institute of Technology and with ISO, an ESA project with instruments funded by ESA member states and with participation of ISAS and NASA.
All Tables
Table 1: IRS spectrum of NGC 6210.
Table 2: ISO spectrum of NGC 6210.
Table 3: Visual spectrum of NGC 6210.
Table 4: IUE Spectrum of NGC 6210.
Table 5: Electron density indicators in NGC 6210.
Table 6: Electron temperature indicators in NGC 6210.
Table 7: Ionic concentrations and chemical abundances in NGC 6210.
Table 8: Comparison of abundances in NGC 6210.
All Figures
| |
Figure 1:
An HST image of NGC 6210. The width of the photograph is 15.8
|
| Open with DEXTER | |
| In the text | |
| |
Figure 2:
A long exposure HST image of NGC 6210 emphasising the halo structure. The width of the photograph is 42
|
| Open with DEXTER | |
| In the text | |
Copyright ESO 2009
Current usage metrics show cumulative count of Article Views (full-text article views including HTML views, PDF and ePub downloads, according to the available data) and Abstracts Views on Vision4Press platform.
Data correspond to usage on the plateform after 2015. The current usage metrics is available 48-96 hours after online publication and is updated daily on week days.
Initial download of the metrics may take a while.