| Issue |
A&A
Volume 498, Number 3, May II 2009
|
|
|---|---|---|
| Page(s) | 909 - 914 | |
| Section | Atomic, molecular, and nuclear data | |
| DOI | https://doi.org/10.1051/0004-6361/200911799 | |
| Published online | 27 March 2009 | |
Experimental dielectronic recombination rate coefficients for Na-like S VI and Na-like Ar VIII
I. Orban1 - Z. Altun2 - A. Källberg3 - A. Simonsson3 - G. Andler3 - A. Paál3 - M. Blom3 - P. Löfgren3 - S. Trotsenko4,5 - S. Böhm1 - R. Schuch1
1 - Department of Atomic Physics, Stockholm University, 10691 Stockholm, Sweden
2 - Department of Physics, Marmara University, 81040 Istanbul, Turkey
3 - Manne Siegbahn Laboratory, Stockholm University, 11814 Stockholm, Sweden
4 - Gesellschaft für Schwerionenforschung, 64291 Darmstadt, Germany
5 - Institut für Kernphysik, Universität Frankfurt, 60486 Frankfurt, Germany
Received 5 February 2009 / Accepted 22 February 2009
Abstract
Context. Absolute recombination rate coefficients for two astrophysically relevant Na-like ions are presented.
Aims. Recombination rate coefficients of S VI and Ar VIII are determined from merged-beam type experiments at the CRYRING electron cooler. Calculated rate coefficients are used to account for recombination into states that are field-ionized and therefore not detected in the experiment.
Methods. Dielectronic recombination rate coefficients were obtained over an energy range covering
![]() core excitations. For Na-like Ar a measurement was also performed over the
core excitations. For Na-like Ar a measurement was also performed over the
![]() type of resonances. In the low-energy part of the Ar VIII spectrum, enhancements of more than one order of magnitude are observed as compared to the calculated radiative recombination. The plasma recombination rate coefficients of the two Na-like ions are compared with calculated results from the literature. In the
103-104 K range, large discrepancies are observed between calculated plasma rate coefficients and our data. At higher temperatures, above 105 K, in the case of both ions our data is 30% higher than two calculated plasma rate coefficients, other data from the literature having even lower values.
type of resonances. In the low-energy part of the Ar VIII spectrum, enhancements of more than one order of magnitude are observed as compared to the calculated radiative recombination. The plasma recombination rate coefficients of the two Na-like ions are compared with calculated results from the literature. In the
103-104 K range, large discrepancies are observed between calculated plasma rate coefficients and our data. At higher temperatures, above 105 K, in the case of both ions our data is 30% higher than two calculated plasma rate coefficients, other data from the literature having even lower values.
Results. Discrepancies below 104 K show that at such temperatures even state-of-the-art calculations yield plasma rate coefficients that have large uncertainties. The main reason for these uncertainties are the contributions from low-energy resonances, which are difficult to calculate accurately.
Key words: atomic data - plasmas - Sun: corona - Sun: atoms
1 Introduction
Highly charged ions are abundant in astrophysical plasmas. Recently, 40% of the baryons ``missing'' from the nearby universe were found as ionized intergalactic gas, absorbing in the UV spectral range (Danforth & Shull 2008; Day 2008). About 30% of the missing ions are in photoionized plasma at
![]() K and another 10% are in the form of shock-heated gas at
105-106 K. The remaining part of the missing baryonic matter is believed to be at even higher temperatures, absorbing in the X-ray regime.
K and another 10% are in the form of shock-heated gas at
105-106 K. The remaining part of the missing baryonic matter is believed to be at even higher temperatures, absorbing in the X-ray regime.
Dielectronic recombination (DR) was first recognized by Burgess (1964) as the dominant recombination channel in the Solar corona. DR is a strong recombination channel at plasma temperatures where highly charged ions are common. In the calculation of fractional abundances of various charge states the results depend crucially on the atomic data used as input in the calculations (Bryans et al. 2006). Sulfur and argon are astrophysically abundant elements (Anders & Grevesse 1989), accurate DR rate coefficients for their ions are thus important for the diagnostics and modeling of astrophysical plasmas.
The majority of DR data available in the literature originates from calculations. Generally, for open L and M shell ions the discrepancies between the results of state-of-the-art calculations amount to ![]() 35% (Bryans et al. 2006). For DR resonances below 1-3 eV energy, the uncertainties are much higher, due to the inability of modern theory to accurately predict resonance positions, widths and strengths. These uncertainties directly affect the plasma recombination rate coefficients below
35% (Bryans et al. 2006). For DR resonances below 1-3 eV energy, the uncertainties are much higher, due to the inability of modern theory to accurately predict resonance positions, widths and strengths. These uncertainties directly affect the plasma recombination rate coefficients below ![]()
![]() 104 K. In this range, large differences between calculated and measured rate coefficients are common. The low energy recombination spectra of ions belonging to the same isoelectronic sequence can be very different, even for neighboring elements. Consequently, at low temperatures, no clear Z-dependence of the plasma DR exists. Therefore, the spectrum of each relevant ion needs to be evaluated individually, especially when low-energy DR resonances are present.
104 K. In this range, large differences between calculated and measured rate coefficients are common. The low energy recombination spectra of ions belonging to the same isoelectronic sequence can be very different, even for neighboring elements. Consequently, at low temperatures, no clear Z-dependence of the plasma DR exists. Therefore, the spectrum of each relevant ion needs to be evaluated individually, especially when low-energy DR resonances are present.
Even seemingly insignificant differences in the description of free and bound electron orbitals can lead to large differences in the calculated DR rate coefficients (see e.g. Fu et al. 2008, where depending on the description, 50% difference was observed in the DR rate coefficients of Ne-like Mg). Additionally, calculation of the DR spectra of even relatively low-Z and low-charged ions require relativistic treatment (Mannervik et al. 1998). Storage rings equipped with electron cooler devices presently yield the most accurate low-energy recombination spectra and can benchmark the different theoretical descriptions.
In this publication we present absolute recombination rate coefficients for two astrophysically relevant Na-like ions, S VI and Ar VIII, measured at the CRYRING electron cooler (Danared et al. 2000). The DR of these ions in the presence of external electric fields has been investigated in another publication (Orban et al. 2009). This paper is organized as follows: In the next section we give a short description of the DR process. In Sect. 3 the experiment and data analysis are presented. We describe the calculations in Sect. 4. Merged-beam and plasma DR rate coefficients of the two Na-like ions are compared with data available in the literature in Sects. 5.1 and in 5.2, respectively. Our conclusions are given in Sect. 6.
2 Dielectronic recombination
Dielectronic recombination is a resonant recombination channel that takes place through an intermediate doubly excited state (Burgess 1964; Tokman et al. 2002). The first step of DR is dielectronic capture, in which a free electron is attached typically into a Rydberg state of a non-bare ion, with the simultaneous excitation of a core electron.
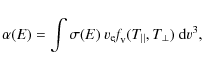
The energy balance of DR is given by:
i.e., the sum of the kinetic energy
3 Experiment
![\begin{figure}
\par\includegraphics[width=17.5cm,clip]{1799fig1.eps}
\end{figure}](/articles/aa/full_html/2009/18/aa11799-09/img15.png) |
Figure 1:
Merged-beam rate coefficients of a) S VI and b) Ar VIII. Note the different scales on the vertical axis, before and after the axis brake. Experimentally derived spectra are shown by the gray areas. The RR contribution to the experimental spectrum is shown by the hatched area. All solid lines show
|
| Open with DEXTER | |
Recombination spectra of both Na-like ions were measured in separate experiments at the CRYRING storage ring (Abrahamsson et al. 1993), located at the Manne Siegbahn Laboratory in Stockholm, Sweden. The ions were produced in an electron cyclotron resonance ion source and were transported to the storage ring. Following injection and storage on a stable orbit, the S and Ar ions were accelerated in the storage ring to energies of 74 MeV and 115 MeV, respectively. Following acceleration, about 1.4 ![]() 106 S5+ and
106 S5+ and ![]()
![]() 106 Ar7+ ions were circulating in the ring. In the electron cooler, a low-temperature electron beam was merged with the stored ions over an interaction length of
106 Ar7+ ions were circulating in the ring. In the electron cooler, a low-temperature electron beam was merged with the stored ions over an interaction length of ![]() 0.8 m. The ion beam was electron cooled for 2 s with a velocity matched, cold electron beam. Following electron cooling, the electron energy was scanned in a zig-zag pattern. First, the electron energy was increased in order to cover the electron-ion collision-energy range of DR resonances associated with excitation of the 3s core electron within the same n=3 shell (
0.8 m. The ion beam was electron cooled for 2 s with a velocity matched, cold electron beam. Following electron cooling, the electron energy was scanned in a zig-zag pattern. First, the electron energy was increased in order to cover the electron-ion collision-energy range of DR resonances associated with excitation of the 3s core electron within the same n=3 shell (
![]() type DR), up to the 3pnl series limit. Then the electron energy was decreased through the ion-electron velocity-match condition and the same collision energy range was covered with electrons slower than the ions. The electron energy was then scanned back to the velocity match cooling condition. After the electron energy scan, the ions were dumped and a new ion-injection was performed. After the measurement of the
type DR), up to the 3pnl series limit. Then the electron energy was decreased through the ion-electron velocity-match condition and the same collision energy range was covered with electrons slower than the ions. The electron energy was then scanned back to the velocity match cooling condition. After the electron energy scan, the ions were dumped and a new ion-injection was performed. After the measurement of the
![]() type DR resonances, the DR spectrum of Ar VIII covering the
type DR resonances, the DR spectrum of Ar VIII covering the
![]() type of DR resonances was also measured. The energy scan over this range was performed only with electrons faster than the ions.
type of DR resonances was also measured. The energy scan over this range was performed only with electrons faster than the ions.
During the measurements, the electron current was kept constant, with electron densities at cooling energy, of 4 ![]() 106
106
![]() and 7.9
and 7.9 ![]() 106
106
![]() in case of the S VI and Ar VIII experiments, respectively. Recombined ions were separated from the stored beam in the first dipole magnet after the electron cooler and were detected by a surface barrier silicon detector with unity efficiency.
in case of the S VI and Ar VIII experiments, respectively. Recombined ions were separated from the stored beam in the first dipole magnet after the electron cooler and were detected by a surface barrier silicon detector with unity efficiency.
Motional electric fields at the dipole magnet field-ionized Rydberg states with the principle quantum number higher than
![]() in the S VI experiment and
in the S VI experiment and
![]() in the Ar VIII experiment. A fraction of the ions recombined into high-n states decayed below
in the Ar VIII experiment. A fraction of the ions recombined into high-n states decayed below
![]() before arriving at the dipole magnet. These ions were not field-ionized and their contribution can be observed in the experimental spectra above the energy corresponding to the field-ionization limits (see Fig. 1). Hereafter, data affected by field-ionization will be referred to as
before arriving at the dipole magnet. These ions were not field-ionized and their contribution can be observed in the experimental spectra above the energy corresponding to the field-ionization limits (see Fig. 1). Hereafter, data affected by field-ionization will be referred to as
![]() rate coefficients.
rate coefficients.
Merged-beam recombination rate coefficients were obtained from the energy-dependent count rates, with a similar procedure as described in DeWitt et al. (1996) and in Zong et al. (1997). Corresponding electron-ion collision energies were calculated using space-charge corrected electron and drag-force corrected ion energies.
4 AUTOSTRUCTURE calculations
Calculations were carried out within the isolated resonance approximation. The AUTOSTRUCTURE code (Badnell 1986) was used to obtain level-resolved DR cross sections in a multiconfiguration intermediate coupling Breit-Pauli (MCBP) approximation. Both
![]() and
and
![]() core excitations from the ground state were considered. Radiative stabilization of the doubly excited states through both the decay of the excited core and the decay of the Rydberg electron was considered. For
core excitations from the ground state were considered. Radiative stabilization of the doubly excited states through both the decay of the excited core and the decay of the Rydberg electron was considered. For
![]() core-excitations, the calculated
core-excitations, the calculated
![]() series limits were adjusted to match the corresponding 3s
series limits were adjusted to match the corresponding 3s
![]() 3p core-excitation energies from the NIST evaluated database (Ralchenko et al. 2008).
3p core-excitation energies from the NIST evaluated database (Ralchenko et al. 2008).
In the case of
![]() type DR, all Rydberg orbitals were explicitly included up to n = 30 and l = 15, and a quantum-defect theory approximation was used for higher levels, up to n = 1000 (Badnell et al. 2003). In the case of
type DR, all Rydberg orbitals were explicitly included up to n = 30 and l = 15, and a quantum-defect theory approximation was used for higher levels, up to n = 1000 (Badnell et al. 2003). In the case of
![]() core excitations, leading to
core excitations, leading to
![]() excited states (
excited states (
![]() excitations), Rydberg states with
excitations), Rydberg states with ![]() and
and
![]() were described explicitly, whereas for
were described explicitly, whereas for
![]() excited states (
excited states (
![]() excitations), Rydberg states with
excitations), Rydberg states with ![]() and
and
![]() were calculated explicitly. Again, for higher levels up to n=1000, approximations were used.
were calculated explicitly. Again, for higher levels up to n=1000, approximations were used.
Calculations including only states up to the experimental field-ionization limits were also performed (see solid curves in Fig. 1). These curves contain contributions arising from ions that initially recombined into states above the field-ionization limit, but decayed below
![]() before arriving at the dipole magnet, as explained in Sect. 3.
before arriving at the dipole magnet, as explained in Sect. 3.
In order to compare with the experimentally derived rate coefficients, the calculated cross sections ![]() were multiplied by the average electron velocity
were multiplied by the average electron velocity ![]() and were convoluted with the electron velocity distribution from the experiment:
and were convoluted with the electron velocity distribution from the experiment:
where
5 Results and discussion
In order to have a more transparent presentation of our results, we distinguish between the merged-beam and plasma recombination spectra. The merged-beam recombination spectra show the resonant peak structure of the DR spectrum as a function of electron-ion interaction energy. The plasma rate coefficients show the DR rate coefficients as a function of plasma temperature and contain at each temperature contributions from a large number of DR channels, with strengths weighted by the electron energy distribution characteristic for that particular temperature. The merged-beam and plasma recombination spectra are discussed in the next two sections.
5.1 Merged-beam rate coefficients
Experimentally derived merged-beam recombination rate coefficients and AUTOSTRUCTURE results for Na-like S and Na-like Ar, over the energy range of the
![]() DR resonances, are shown in Fig. 1. Quantum mechanically, radiative recombination (RR) and DR into the same final states are indistinguishable processes and can interfere. However, interferences between RR and DR have been shown to be usually negligible. Thus treating RR and DR separately is to a first approximation correct (Pindzola et al. 1992). The RR contributions to the experimentally determined recombination spectra, shown by the hatched areas in Fig. 1, were estimated using the Bethe & Salpeter (1957) formula, corrected by the Gaunt factors (Lindroth & Schuch 2003) for recombination into low-n states.
DR resonances, are shown in Fig. 1. Quantum mechanically, radiative recombination (RR) and DR into the same final states are indistinguishable processes and can interfere. However, interferences between RR and DR have been shown to be usually negligible. Thus treating RR and DR separately is to a first approximation correct (Pindzola et al. 1992). The RR contributions to the experimentally determined recombination spectra, shown by the hatched areas in Fig. 1, were estimated using the Bethe & Salpeter (1957) formula, corrected by the Gaunt factors (Lindroth & Schuch 2003) for recombination into low-n states.
In order to compare with the experimentally derived rate coefficients, the AUTOSTRUCTURE rate coefficients were multiplied by 0.8 in the case of both ions and were added to the RR contribution. Such differences between calculated rate coefficients and measured spectra are not uncommon (see e.g. Schippers et al. 2001) and are here at the limit of the experimental systematic uncertainties. DR resonance positions shown by the vertical bars were calculated using Eq. (1), where the binding energy of the Rydberg electrons were estimated with:

where Ry is the Rydberg constant, and Q is the ionic charge. Toward higher energies, DR peaks of the
At energies above 2.5 eV, good agreement can be observed between the experimentally derived merged-beam spectra and the scaled AUTOSTRUCTURE rate coefficients, with the S VI experiment containing some spectral features at ![]() 7.5 eV and
7.5 eV and ![]() 9.5 eV, most likely due to DR through
9.5 eV, most likely due to DR through
![]() states, underestimated by the calculation. Below 2.5 eV the agreement is less satisfactory, with the calculated and experimental spectra having different resonance positions and strengths. The insets in Fig. 1 show the low-energy parts of the merged-beam spectra in more detail. In the S VI case, the calculated RR contribution is in good agreement with the experiment down to 1 meV. Although the AUTOSTRUCTURE calculation predicts two strong DR resonances at
states, underestimated by the calculation. Below 2.5 eV the agreement is less satisfactory, with the calculated and experimental spectra having different resonance positions and strengths. The insets in Fig. 1 show the low-energy parts of the merged-beam spectra in more detail. In the S VI case, the calculated RR contribution is in good agreement with the experiment down to 1 meV. Although the AUTOSTRUCTURE calculation predicts two strong DR resonances at ![]() 100 meV, no such resonances are observed in the experiment. Below 1 meV, the experimental recombination rate is clearly enhanced compared to the calculated RR contribution. This low-energy enhancement is a common characteristic of storage ring experiments and typically amounts to a factor of
100 meV, no such resonances are observed in the experiment. Below 1 meV, the experimental recombination rate is clearly enhanced compared to the calculated RR contribution. This low-energy enhancement is a common characteristic of storage ring experiments and typically amounts to a factor of ![]() 3 increase, compared to the calculated RR (Gao et al. 1995).
3 increase, compared to the calculated RR (Gao et al. 1995).
In contrast to the S VI case, in the Ar VIII spectrum the experimentally determined rate coefficients are substantially larger than the calculated RR rate coefficients already below 100 meV. With the enhancement beginning only below 1 meV, the increasing difference between the experiment and calculated RR toward lower energies is most likely due to DR. However, it is difficult to assess the exact contribution of the low-energy DR, because of the width of the resonance structure. In the experimental spectrum it seems that the resonance overlaps the 0 eV threshold. Additionally, one should consider the 1/E scaling of DR strength, which produces an increasing tail in the resonance profile toward 0 eV (see e.g. Orban et al. 2007). It is interesting to note that in the recombination spectrum of Ar VIII, the enhancement below 1 meV is quite large, compared to the RR level. Extending a trend line to the low-energy DR resonance profile, the enhancement at 10-5 eV is more than an order of magnitude larger than the RR, which seems to suggest that the enhancement takes place not only in the RR, but also in the low-energy DR channel. Large enhancements were observed in the recombination spectra of other ions, also containing low-energy DR resonances (see e.g. Ar XIV, Gao et al. 1995; and Pb LIV, Lindroth et al. 2001). The AUTOSTRUCTURE calculation predicts a strong resonance in the low-energy part of the Ar VIII spectrum, at ![]() 30 meV.
30 meV.
Results of AUTOSTRUCTURE calculations, containing recombination into states with the principal quantum number of the Rydberg electron extending up to n=1000 are shown in Fig. 1 by the dashed lines. DR into states with ![]() is insignificant, therefore the calculated DR rate coefficients shown by the dashed lines are good approximations for the total DR. Hereafter spectra containing DR up to n=1000 will be referred to as field-ionization-free DR rate coefficients.
is insignificant, therefore the calculated DR rate coefficients shown by the dashed lines are good approximations for the total DR. Hereafter spectra containing DR up to n=1000 will be referred to as field-ionization-free DR rate coefficients.
![\begin{figure}
\par\includegraphics[width=9cm,clip]{1799fig2.eps}
\end{figure}](/articles/aa/full_html/2009/18/aa11799-09/img42.png) |
Figure 2:
Overview of the Ar VIII merged-beam rate coefficients up to the
|
| Open with DEXTER | |
The recombination spectrum of Ar VIII at higher energies, up to the
![]() series limits is shown in Fig. 2. Here the energy scale of the measured spectrum was multiplied by 0.986. As observed in the DR spectra of other Na-like ions, the strongest DR contributions are associated with DR resonances located below the
series limits is shown in Fig. 2. Here the energy scale of the measured spectrum was multiplied by 0.986. As observed in the DR spectra of other Na-like ions, the strongest DR contributions are associated with DR resonances located below the
![]() thresholds (Schmidt et al. 2007). This energy range also contains
thresholds (Schmidt et al. 2007). This energy range also contains
![]() and
and
![]() DR resonances in the case of S VI and Ar VIII having comparable strengths to the
DR resonances in the case of S VI and Ar VIII having comparable strengths to the
![]() peaks. The
peaks. The
![]() resonances at energies above the
resonances at energies above the
![]() series limits, on the other hand, are about one order of magnitude smaller, due to the opening of alternative autoionization channels to excited states of the Na-like ions. In this range, the agreement between the field-ionization-free AUTOSTRUCTURE results and experiments is poor. Most notably, the calculation underestimates the size of the
series limits, on the other hand, are about one order of magnitude smaller, due to the opening of alternative autoionization channels to excited states of the Na-like ions. In this range, the agreement between the field-ionization-free AUTOSTRUCTURE results and experiments is poor. Most notably, the calculation underestimates the size of the
![]() and
and
![]() series limits, which even in the field-ionization limited experiment are larger than what the field-ionization-free calculation predicts.
series limits, which even in the field-ionization limited experiment are larger than what the field-ionization-free calculation predicts.
![\begin{figure}
\par\includegraphics[width=9cm,clip]{1799fig3.eps}
\end{figure}](/articles/aa/full_html/2009/18/aa11799-09/img46.png) |
Figure 3:
Various curves showing
|
| Open with DEXTER | |
5.2 Plasma DR rate coefficients
To obtain
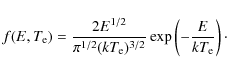
![]() plasma recombination rate coefficients, the RR contributions first were subtracted from the merged-beam recombination spectra, using the RR curves shown in Fig. 1. The resulting merged-beam DR spectra were then convoluted with Maxwell-Boltzmann electron energy distributions (Savin 1999):
plasma recombination rate coefficients, the RR contributions first were subtracted from the merged-beam recombination spectra, using the RR curves shown in Fig. 1. The resulting merged-beam DR spectra were then convoluted with Maxwell-Boltzmann electron energy distributions (Savin 1999):
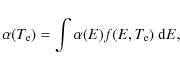
where
The validity of the above double-convolution for the preparation of plasma recombination rate coefficients was investigated by Schippers et al. (2001).
![\begin{figure}
\par\includegraphics[width=17.5cm,clip]{1799fig4.eps}
\end{figure}](/articles/aa/full_html/2009/18/aa11799-09/img52.png) |
Figure 4:
Plasma DR rate coefficients of a) S VI and b) Ar VIII. Solid lines and gray areas show
|
| Open with DEXTER | |
Plasma DR rate coefficients obtained from the experimentally derived DR spectrum of Ar VIII are shown in Fig. 3. The contributions from DR resonances located above the
![]() series limits are shown by the differences between the solid curve, containing all measured DR resonances and the thick dashed curve, containing only DR resonances below the
series limits are shown by the differences between the solid curve, containing all measured DR resonances and the thick dashed curve, containing only DR resonances below the
![]() series limits. The contributions amount to
series limits. The contributions amount to ![]() at 106 K.
at 106 K.
In order to estimate the contribution from the low-energy DR structure, several low-energy ranges of the merged-beam spectrum were removed. The resulting spectra were then used to obtain plasma rate coefficients, identified by the corresponding labels in Fig. 3. The exclusion of the range up to 10-3 meV (the typical energy range of enhancements in recombination spectra measured at storage rings) results in a decrease of 8% in the plasma DR rates at 103 K. In contrast, removing the entire low-energy contribution below 100 meV decreases the plasma DR rates by 98% of the full value at 103 K, and even at 104 K causes a decrease of ![]() %. Clearly, recombination in low-temperature plasma takes place predominantly through these low-energy DR channels. However, the enhancement of the low-energy rate coefficients, the experimental broadening, and the vecinity of the threshold in combination with the width of the DR feature which seems to extend over the threshold, hinders the determination of the exact contribution to the plasma DR rate coefficients.
%. Clearly, recombination in low-temperature plasma takes place predominantly through these low-energy DR channels. However, the enhancement of the low-energy rate coefficients, the experimental broadening, and the vecinity of the threshold in combination with the width of the DR feature which seems to extend over the threshold, hinders the determination of the exact contribution to the plasma DR rate coefficients.
As discussed in Sect. 3, field-ionization limits the range of detectable states populated by recombination. In order to account for the states not detected in the experiment, the experimentally derived and RR subtracted rate coefficient spectra were replaced by the field-ionization-free calculations over the field-affected part of the
![]() series limits. The resulting spectra were then convoluted using Eq. (4), to yield field-ionization-free plasma DR rate coefficients shown by the gray areas in Fig. 4.
series limits. The resulting spectra were then convoluted using Eq. (4), to yield field-ionization-free plasma DR rate coefficients shown by the gray areas in Fig. 4.
The experimental
![]() and field-ionization-free DR plasma rate coefficients shown in Fig. 4 were fitted using a formula with the same temperature dependence as the formula given by Burgess (1965):
and field-ionization-free DR plasma rate coefficients shown in Fig. 4 were fitted using a formula with the same temperature dependence as the formula given by Burgess (1965):
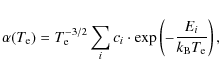
where
Table 1:
Fit coefficients for the
![]() and field-ionization-free plasma DR rate coefficients of S VI and Ar VIII. The dimensions of ci and Ei are
and field-ionization-free plasma DR rate coefficients of S VI and Ar VIII. The dimensions of ci and Ei are
![]() and eV, respectively. Numbers in the square brackets are powers of 10.
and eV, respectively. Numbers in the square brackets are powers of 10.
The S VI and Ar VIII plasma DR rate coefficients are compared with data from the literature in Fig. 4. In the spectrum of S VI, DR is higher than the RR rate coefficients (Badnell 2006) for temperatures above 5 ![]() 103 K, whereas in case of Ar VIII, DR is higher than RR over the entire investigated temperature range.
103 K, whereas in case of Ar VIII, DR is higher than RR over the entire investigated temperature range.
Above 2 ![]() 104 K and 3
104 K and 3 ![]() 104 K in the plasma DR rate coefficient spectra of S VI and Ar VIII, respectively, DR into states affected by field-ionization becomes important (see Fig. 4). The contribution from the field-ionized states is shown by the fraction of the gray areas located above the solid curves. At
104 K in the plasma DR rate coefficient spectra of S VI and Ar VIII, respectively, DR into states affected by field-ionization becomes important (see Fig. 4). The contribution from the field-ionized states is shown by the fraction of the gray areas located above the solid curves. At
![]() K, where the plasma DR rate coefficients reach their peak values, calculated data from the literature have values between the pure experimentally derived plasma DR rate coefficients and the field-ionization-free plasma rate coefficients. Closest to our plasma DR rate coefficients above this temperature are the data of Gu (2004) and Aldrovandi & Pequignot (1973) for S VI and the data of Gu (2004) and Mazzotta et al. (1998) in the case of Ar VIII. Above 4
K, where the plasma DR rate coefficients reach their peak values, calculated data from the literature have values between the pure experimentally derived plasma DR rate coefficients and the field-ionization-free plasma rate coefficients. Closest to our plasma DR rate coefficients above this temperature are the data of Gu (2004) and Aldrovandi & Pequignot (1973) for S VI and the data of Gu (2004) and Mazzotta et al. (1998) in the case of Ar VIII. Above 4 ![]() 104 K, all these curves are
104 K, all these curves are
![]() lower than our corresponding field-ionization-free rate coefficients. S VI plasma rate coefficents by Badnell (1991) and Altun et al. (2006) have similar values and are
lower than our corresponding field-ionization-free rate coefficients. S VI plasma rate coefficents by Badnell (1991) and Altun et al. (2006) have similar values and are
![]() lower than our data, while above 6
lower than our data, while above 6 ![]() 104 K, the rate coefficients by Jacobs et al. (1979) are
104 K, the rate coefficients by Jacobs et al. (1979) are
![]() lower than our data.
lower than our data.
Below 1.3 ![]() 104 K and 2
104 K and 2 ![]() 104 K the S VI and Ar VIII plasma DR rate coefficients respectively contain mostly DR channels located below the field-ionization limits and are not affected by the procedure used to account for the field-ionization in the measurement. In this range, the plasma DR rate coefficients obtained from the AUTOSTRUCTURE calculations are larger than the experimentally derived data for both ions. These discrepancies are due to differences in the low-energy DR channels (see insets in Fig. 1). In the case of S VI the AUTOSTRUCTURE calculation shows two strong DR peaks at 80 and 145 meV, not observed in the experiment. These two peaks cause a factor of 23 difference between the AUTOSTRUCTURE and experimental plasma DR rate coefficients at 103 K.
104 K the S VI and Ar VIII plasma DR rate coefficients respectively contain mostly DR channels located below the field-ionization limits and are not affected by the procedure used to account for the field-ionization in the measurement. In this range, the plasma DR rate coefficients obtained from the AUTOSTRUCTURE calculations are larger than the experimentally derived data for both ions. These discrepancies are due to differences in the low-energy DR channels (see insets in Fig. 1). In the case of S VI the AUTOSTRUCTURE calculation shows two strong DR peaks at 80 and 145 meV, not observed in the experiment. These two peaks cause a factor of 23 difference between the AUTOSTRUCTURE and experimental plasma DR rate coefficients at 103 K.
In the case of Ar VIII, both the experimentally derived and the calculated merged beam rate coefficients contain DR contributions at low energies. As a consequence of the differences between the experimentally derived and calculated spectra, at 103 K, the AUTOSTRUCTURE plasma DR rate coefficients are a factor of 6.5 larger than the experimentally derived values. The very low energy position, a width that is comparable with the energy position, and the broadening of the low-energy DR feature by the finite experimental energy resolution, and additionally the enhancement at low energies, all affect the accuracy of our procedure to obtain plasma rate coefficients. It is therefore difficult to make a valid comparison of the Ar VIII plasma rate coefficients at low temperatures.
At low temperatures, below 2 ![]() 104 K, large spreads can be observed between the data available in the literature for both ions. The S VI plasma rate coefficients by Aldrovandi & Pequignot (1973) and Jacobs et al. (1979) neglect DR into the lowest available n states and have negligible values at these temperatures.
104 K, large spreads can be observed between the data available in the literature for both ions. The S VI plasma rate coefficients by Aldrovandi & Pequignot (1973) and Jacobs et al. (1979) neglect DR into the lowest available n states and have negligible values at these temperatures.
Below 104 K, the rate coefficients by Gu (2004) are lower than our experimentally derived data in the case of S VI and higher in the case of the Ar VIII plasma DR spectrum. These discrepancies with the results of state-of-the-art calculations for two ions belonging to the same isoelectronic sequence, differing by only 2 atomic numbers, emphasize the need to individually evaluate the low-temperature plasma DR rate coefficients of the most relevant ions.
6 Conclusions
We present recombination spectra of two astrophysically relevant Na-like ions, S VI and Ar VIII. At low energies, the merged-beam spectrum of Ar VIII is strongly enhanced, and at 10-5 eV is more than a factor of 15 larger than the calculated RR contribution.
At high temperatures the calculated results closest to the obtained plasma DR rate coefficients are those of Gu (2004) and Aldrovandi & Pequignot (1973), in the case of S VI and the calculations by Gu (2004) and Mazzotta et al. (1998), in the case of Ar VIII. Above 105 K these rate coefficients are
![]() lower than our results for both ions, with the other data available in the literature having even lower values. At temperatures below 104 K, a large spread exists in the data available in the literature for both ions. State-of-the-art calculations are unreliable in this temperature range, in some cases underestimating and in other cases overestimating the plasma DR rate coefficients. These discrepancies are caused by uncertainties in low-energy DR resonances, which are difficult to calculate accurately. Storage ring measurements provide high resolution recombination spectra and are the most appropriate method for evaluating the calculated DR results, especially at low energies.
lower than our results for both ions, with the other data available in the literature having even lower values. At temperatures below 104 K, a large spread exists in the data available in the literature for both ions. State-of-the-art calculations are unreliable in this temperature range, in some cases underestimating and in other cases overestimating the plasma DR rate coefficients. These discrepancies are caused by uncertainties in low-energy DR resonances, which are difficult to calculate accurately. Storage ring measurements provide high resolution recombination spectra and are the most appropriate method for evaluating the calculated DR results, especially at low energies.
Acknowledgements
We acknowledge the financial support received from the Swedish Research Council VR.
References
- Abrahamsson, K., Andler, G., Bagge, L., et al. 1993, NIMPRB, 79, 269 [NASA ADS] (In the text)
- Aldrovandi, S. M. V., & Pequignot, D. 1973, A&A, 25, 137 [NASA ADS] (In the text)
- Altun, Z., Yumak, A., Badnell, N. R., Loch, S. D., & Pindzola, M. S. 2006, A&A, 447, 1165 [NASA ADS] [CrossRef] [EDP Sciences] (In the text)
- Anders, E., & Grevesse, N. 1989, Geochim. Cosmochim. Acta, 53, 197 [NASA ADS] [CrossRef] (In the text)
- Badnell, N. R. 1986, J. Phys. B: Atom. Molec. Phys., 19, 3827 [NASA ADS] [CrossRef] (In the text)
- Badnell, N. R. 1991, ApJ, 379, 356 [NASA ADS] [CrossRef] (In the text)
- Badnell, N. R. 2006, ApJS, 167, 334 [NASA ADS] [CrossRef] (In the text)
- Badnell, N. R., O'Mullane, M. G., Summers, H. P., et al. 2003, A&A, 406, 1151 [NASA ADS] [CrossRef] [EDP Sciences] (In the text)
- Bethe, H., & Salpeter, E. 1957, The quantum mechanics of one- and twoelectron systems, Handbuch der Physik (Berlin: Springer), 35 (In the text)
- Bryans, P., Badnell, N. R., Gorczyca, T. W., et al. 2006, ApJS, 167, 343 [NASA ADS] [CrossRef] (In the text)
- Burgess, A. 1964, ApJ, 139, 776 [NASA ADS] [CrossRef] (In the text)
- Burgess, A. 1965, ApJ, 141, 1588 [NASA ADS] [CrossRef] (In the text)
- Danared, H., Källberg, A., Andler, G., et al. 2000, NIMPRA, 441, 123 [NASA ADS] [CrossRef] (In the text)
- Danforth, C. W., & Shull, J. M. 2008, ApJ, 679, 194 [NASA ADS] [CrossRef]
- Day, C. 2008, Physics Today, 61, 070000
- DeWitt, D. R., Schuch, R., Gao, H., et al. 1996, Phys. Rev. A, 53, 2327 [NASA ADS] [CrossRef] (In the text)
- Fu, J., Gorczyca, T. W., Nikolic, D., et al. 2008, Phys. Rev. A, Atom., Molec., Opt. Phys., 77, 032713 (In the text)
- Gao, H., DeWitt, D. R., Schuch, R., et al. 1995, Phys. Rev. Lett., 75, 4381 [NASA ADS] [CrossRef] (In the text)
- Gu, M. F. 2004, ApJS, 153, 389 [NASA ADS] [CrossRef] (In the text)
- Jacobs, V. L., Davis, J., Rogerson, J. E., & Blaha, M. 1979, ApJ, 230, 627 [NASA ADS] [CrossRef] (In the text)
- Kallman, T., & Bautista, M. 2001, ApJ, 133, 221 [NASA ADS] [CrossRef] (In the text)
- Lindroth, E., & Schuch, R. 2003, The Physics of Multiply and Highly Charged Ions (Netherlands: Kluvert Academic Publishers), 1, 231 (In the text)
- Lindroth, E., Danared, H., Glans, P., et al. 2001, Phys. Rev. Lett., 86, 5027 [NASA ADS] [CrossRef] (In the text)
- Mannervik, S., DeWitt, D., Engström, L., et al. 1998, Phys. Rev. Lett., 81, 313 [NASA ADS] [CrossRef] (In the text)
- Mazzotta, P., Mazzitelli, G., Colafrancesco, S., & Vittorio, N. 1998, A&AS, 133, 403 [CrossRef] [EDP Sciences] (In the text)
- Orban, I., Böhm, S., & Schuch, R. 2009, ApJ, 694, 354 [NASA ADS] [CrossRef] (In the text)
- Orban, I., Lindroth, E., Glans, P., & Schuch, R. 2007, J. Phys. B: Atom., Molec. Opt. Phys., 40, 1063 (In the text)
- Pindzola, M. S., Badnell, N. R., & Griffin, D. C. 1992, Phys. Rev. A, 46, 5725 [NASA ADS] [CrossRef] (In the text)
- Ralchenko, Y., Kramida, A., Reader, J., & NIST ASD Team 2008, NIST Atomic Spectra Database, version 3.1.4, National Institute of Standards and Technology, Gaithersburg, MD, http://physics.nist.gov/asd3 (In the text)
- Savin, D. W. 1999, ApJ, 523, 855 [NASA ADS] [CrossRef] (In the text)
- Schippers, S., Müller, A., Gwinner, G., et al. 2001, ApJ, 555, 1027 [NASA ADS] [CrossRef] (In the text)
- Schmidt, E. W., Bernhardt, D., Muller, A., et al. 2007, Phys. Rev. A, Atom., Molec., Opt. Phys., 76, 032717 (In the text)
- Tokman, M., Eklöw, N., Glans, P., et al. 2002, Phys. Rev. A, 66, 012703 [NASA ADS] [CrossRef]
- Zong, W., Schuch, R., Lindroth, E., et al. 1997, Phys. Rev. A, 56, 386 [NASA ADS] [CrossRef] (In the text)
All Tables
Table 1:
Fit coefficients for the
![]() and field-ionization-free plasma DR rate coefficients of S VI and Ar VIII. The dimensions of ci and Ei are
and field-ionization-free plasma DR rate coefficients of S VI and Ar VIII. The dimensions of ci and Ei are
![]() and eV, respectively. Numbers in the square brackets are powers of 10.
and eV, respectively. Numbers in the square brackets are powers of 10.
All Figures
| |
Figure 1:
Merged-beam rate coefficients of a) S VI and b) Ar VIII. Note the different scales on the vertical axis, before and after the axis brake. Experimentally derived spectra are shown by the gray areas. The RR contribution to the experimental spectrum is shown by the hatched area. All solid lines show
|
| Open with DEXTER | |
| In the text | |
| |
Figure 2:
Overview of the Ar VIII merged-beam rate coefficients up to the
|
| Open with DEXTER | |
| In the text | |
| |
Figure 3:
Various curves showing
|
| Open with DEXTER | |
| In the text | |
| |
Figure 4:
Plasma DR rate coefficients of a) S VI and b) Ar VIII. Solid lines and gray areas show
|
| Open with DEXTER | |
| In the text | |
Copyright ESO 2009
Current usage metrics show cumulative count of Article Views (full-text article views including HTML views, PDF and ePub downloads, according to the available data) and Abstracts Views on Vision4Press platform.
Data correspond to usage on the plateform after 2015. The current usage metrics is available 48-96 hours after online publication and is updated daily on week days.
Initial download of the metrics may take a while.