| Issue |
A&A
Volume 498, Number 3, May II 2009
|
|
|---|---|---|
| Page(s) | 801 - 810 | |
| Section | Stellar structure and evolution | |
| DOI | https://doi.org/10.1051/0004-6361/200811242 | |
| Published online | 19 March 2009 | |
Precessing planetary magnetospheres in SiO stars?
First detection of quasi-periodic polarization fluctuations in R Leonis and V Camelopardalis
H. Wiesemeyer1,![]() - C. Thum1 - A. Baudry2,3 - F. Herpin2,3
- C. Thum1 - A. Baudry2,3 - F. Herpin2,3
1 - Institut de Radio Astronomie Millimétrique, 300 rue de la Piscine, 38406 Saint Martin d'Hères, France
2 - Université de Bordeaux, Laboratoire d'Astrophysique de Bordeaux, 33000 Bordeaux, France
3 - CNRS/INSU, UMR 5804, BP 89, 33270 Floirac, France
Received 28 October 2008 / Accepted 26 January 2009
Abstract
Context. The origin of magnetism around asymptotic giant branch (AGB) stars remains an uncertainty. These stars may drive an important dynamo, but if the magnetic energy dissipates entirely into X-rays, the observed X-ray luminosities are too low to maintain a strong, dynamically important global field. Other explanations of the circular polarization in SiO masers in AGB atmospheres may thus be required.
Aims. The interaction of the AGB wind with both previously ejected matter and planets is expected to produce complex magnetohydrodynamic phenomena on a short timescale, such that strong magnetic fields can be maintained locally. Here, we provide observational evidence of the corresponding magnetic fluctuations.
Methods. We use the circular polarization of the v=1, J=2-1 SiO masers as a tracer of magnetic activity. A correlation polarimeter allows us to record simultaneously all Stokes parameters. An SiO maser survey of 77 AGB stars was performed from which eight sources of the strongest circular polarization were selected for further monitoring.
Results. In two AGB stars, V Cam and R Leo, we find evidence of pseudo-periodic fluctuations in the fractional circular polarization on a timescale of a few hours, from which we infer magnetic fluctuations of ![]() 1 G. The phenomenon is rare and, if detected in an SiO star, restricted to a narrow range of velocities. It seems to be associated with planetary wake flows suggested by VLBI maps.
1 G. The phenomenon is rare and, if detected in an SiO star, restricted to a narrow range of velocities. It seems to be associated with planetary wake flows suggested by VLBI maps.
Conclusions. While scenarios involving magnetic activity in the extended stellar atmosphere have problems explaining all observed features, precessing Jovian magnetospheres predict all of them without difficulty. For the case of R Leo, we constrain the orbit of the planet (estimated period 5.2 years), derive a stellar mass estimate of
![]() from it, and discuss the impact of planetary magnetism on the survival of planets. Smooth velocity variations in the fluctuating circular polarization feature are predicted as the planet moves along its orbit.
from it, and discuss the impact of planetary magnetism on the survival of planets. Smooth velocity variations in the fluctuating circular polarization feature are predicted as the planet moves along its orbit.
Key words: masers - polarization - stars: AGB and post-AGB - stars: atmospheres - stars: magnetic fields - stars: planetary systems
1 Introduction
Towards the end of their lifetime, low- to intermediate mass stars undergo a phase in which they burn Helium in a shell on top of a Carbon-Oxygen core, and Hydrogen in another shell above the Helium shell. During this phase, when the stars appear in the Hertzsprung-Russell diagram in the upper asymptotic giant branch (AGB), they lose, due to pulsations, at least half of their mass, which forms a circumstellar envelope (see Herwig 2005, for a review). The inner part of this envelope, also called an extended atmosphere, is expected to bear complex magnetohydrodynamic phenomena, due to the interaction of the wind with the previously ejected matter and with planets (Struck et al. 2004; Struck et al. 2002; Struck-Marcell 1988). As in the solar system, where space weather changes on timescales of hours (e.g., Prangé et al. 2004), fluctuations in the magnetic field about a mean value can be expected due to this interaction, but observational evidence is still lacking. Here we show that for a narrow range of velocities, the circular polarization of SiO masers, generally accepted as a tracer of the magnetic field in the extended atmosphere of AGB stars (Nedoluha & Watson 1994; Elitzur 1996), varies in two AGB stars with a period of a few hours. Previous multi-epoch observations (Diamond & Kemball 2003; Pardo et al. 2004; Kang et al. 2006) of SiO masers were not polarimetric, while the sampling of the polarization variability study of Glenn et al. (2003) was insufficiently dense to detect such intraday magnetic fluctuations.
Our knowledge about magnetism within the extended atmosphere of AGB stars relies on circular polarization measurements of SiO masers at a distance of between 1.5 and 7 AU from a star with a typical radius of 0.7 to 1 AU. Maser theory implies that molecular excitation occurs in dense pockets of gas and amplification of light occurs in narrow tubes. Assuming that the circular polarization is caused by the Zeeman effect in the non-paramagnetic SiO molecules in the tubes, the reported fractional circular polarizations of up to 9% for the v=1, J=1-0 transition (v and J are the vibrational and rotational quantum numbers, respectively) yield line-of-sight averaged magnetic flux densities of up to 100 G (Barvainis et al. 1987). Observations by Herpin et al. (2006) of the v=1, J=2-1 masers (excited in gas layers close to those where v=1, J=1-0 is excited) also show the presence of circular and linear polarizations in many stars. These observations result in lower magnetic flux density estimates in the range 1 to 15 G, again assuming the circular polarization is due to the Zeeman effect. In the outer envelope, H2O and OH masers reside at between ![]() 100 and
100 and ![]() 400 AU and between
400 AU and between ![]() 1000 and
1000 and ![]() 10 000 AU, respectively, from the star. The Zeeman effect of H2O masers was used
(Vlemmings et al. 2002) to estimate, by extrapolation assuming a solar-type field topology, a magnetic flux density at the stellar surface of 100 G. In summary, it is now observationally evident that AGB stars maintain a magnetic flux throughout their envelope. Blackman et al. (2001) showed that AGB stars can generate a magnetic field by dynamo action at the interface between the rapidly rotating core and the extended convection zone. However, the importance of the magnetic field for global envelope dynamics remains a matter of debate (e.g., Soker 2006).
10 000 AU, respectively, from the star. The Zeeman effect of H2O masers was used
(Vlemmings et al. 2002) to estimate, by extrapolation assuming a solar-type field topology, a magnetic flux density at the stellar surface of 100 G. In summary, it is now observationally evident that AGB stars maintain a magnetic flux throughout their envelope. Blackman et al. (2001) showed that AGB stars can generate a magnetic field by dynamo action at the interface between the rapidly rotating core and the extended convection zone. However, the importance of the magnetic field for global envelope dynamics remains a matter of debate (e.g., Soker 2006).
Once the SiO maser spots form (often distributed along arcs around the star, hereafter referred to as maser shell, see e.g., Cotton et al. 2008), they are affected by magnetospheric events, which are known to be rapidly variable if we refer to the solar system. Here, we provide the first evidence of these fluctuations in the atmospheres of two AGB stars by frequent polarization sampling. The polarization monitoring by Glenn et al. (2003) was sensitive only to slow variations and therefore to a long-term readjustment of the magnetic field (on a timescale of several months).
2 Observations and data analysis
2.1 Instrumentation and observations
The bulk of our observations was completed in May 2006 with the IRAM 30 m telescope at Pico Veleta,
which is equipped with dual-polarization receivers. To confirm the rapid polarization variability
discussed here, Mira-type star R Leo was observed during an additional 4 h on 2008 August 1.
The receiver pair operating at 3 mm wavelength was tuned to the v=1, J=2-1 transition of SiO at 86.243 GHz and ensured of being coherent by using the same local oscillator reference. The signals were analyzed with XPOL (Thum et al. 2008), a correlation spectrometer enhanced with cross-correlation products of the signals from the orthogonally polarized
receivers, at 39.0625 kHz or 0.136 km s-1 channel spacing within the 16.2 MHz bandwidth. Receiver temperatures varied between 36 K and 64 K, and system temperatures between 70 K and 235 K, resulting in an antenna temperature (
![]() )
noise of
)
noise of
![]() mK across the spectral baseline. The conversion factor from
mK across the spectral baseline. The conversion factor from
![]() to the flux density scale is 6 Jy/K. The phase difference between the receivers was measured with a polarizing grid
mounted in front of the cold load (at about 70-80 K effective temperature) of the calibration unit. Whenever the temperature scale was calibrated (every 10 to 20 mn), the signal from the polarizer, of well known properties, was also observed and compared with the unpolarized calibration load at ambient temperature. The phase correction was then
applied to attribute the measured real and imaginary part of the cross-correlation product to both the Stokes U parameter (in the reference frame of the telescope's Nasmyth focus) and the Stokes V parameter (positive for a right-hand circularly polarized signal, according to IAU convention). Small residual phase errors result in a leakage of the Stokes Usignal into Stokes V, a subtle effect only worth worrying about when Stokes U is strong (which is the case here). The scaled (
to the flux density scale is 6 Jy/K. The phase difference between the receivers was measured with a polarizing grid
mounted in front of the cold load (at about 70-80 K effective temperature) of the calibration unit. Whenever the temperature scale was calibrated (every 10 to 20 mn), the signal from the polarizer, of well known properties, was also observed and compared with the unpolarized calibration load at ambient temperature. The phase correction was then
applied to attribute the measured real and imaginary part of the cross-correlation product to both the Stokes U parameter (in the reference frame of the telescope's Nasmyth focus) and the Stokes V parameter (positive for a right-hand circularly polarized signal, according to IAU convention). Small residual phase errors result in a leakage of the Stokes Usignal into Stokes V, a subtle effect only worth worrying about when Stokes U is strong (which is the case here). The scaled (![]() 3%) copy of the Stokes U signal that contaminates the measured circular polarization can then be removed, since it is affected by the parallactic rotation of the polarization vector, which manifests itself clearly. The remaining Stokes V signal is intrinsic, since the contributions of both the telescope and the receiver cabin optics are negligible (
3%) copy of the Stokes U signal that contaminates the measured circular polarization can then be removed, since it is affected by the parallactic rotation of the polarization vector, which manifests itself clearly. The remaining Stokes V signal is intrinsic, since the contributions of both the telescope and the receiver cabin optics are negligible (
![]() % on the optical axis).
% on the optical axis).
 |
Figure 1: Spectra of total power (Stokes I, i.e. polarized plus unpolarized flux density) and of fractional circular polarization. Grey-shaded histogram: Stokes I flux density in Jansky vs. (the radial velocity with respect to the local standard of rest). Dots with errorbars: fractional circular polarization , in % with respect to Stokes I. Left: Mira-type star V Cam. Right: Mira-type star R Leo. |
| Open with DEXTER | |
Seventy-seven AGB stars were observed, of which 62 are Mira stars, 10 are semiregular variable stars, and 2 red supergiants. Eight objects with the strongest circular polarization were targeted for intense monitoring (twice per hour). These are all Mira stars, in agreement with the finding of Herpin et al. (2006) that this source class tends to have the strongest linear and circular polarizations, and is therefore well suited to our aims.
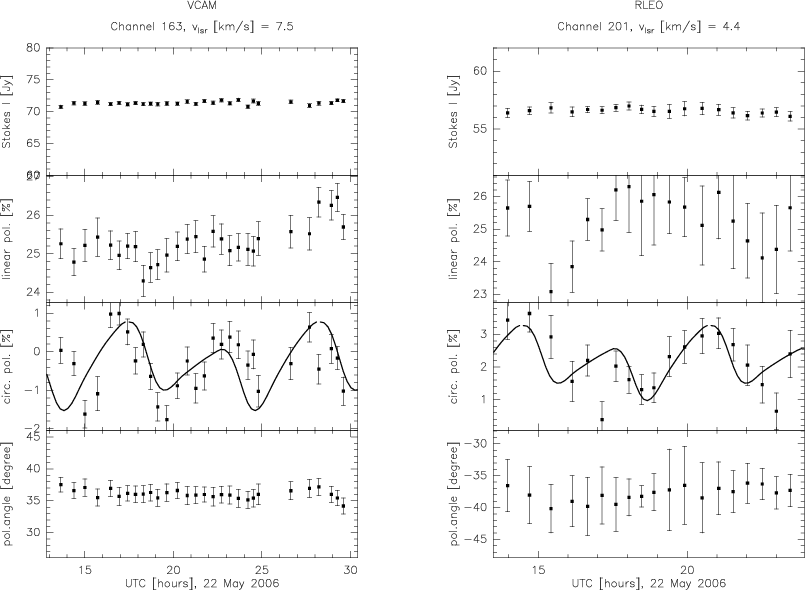 |
Figure 2:
Time series of polarization measurements. From top to bottom: Stokes I in Jansky, the fractional polarizations (linear) and ¸ (circular), and the polarization angle (i.e. the position angle of linear polarization, in degree E from N), for the SiO maser spots from V Cam at = 7.5 km s-1 ( left) and R Leo at = 4.4 km s-1 ( right). The continuous heavy lines in the plots for ¸ show model results (Wiesemeyer 2008) for a saturated maser in the equatorial plane, at
|
| Open with DEXTER | |
2.2 Data analysis
The temperature and phase calibration steps were performed with the MIRA raw data reduction software1. The Stokes spectra written by this software were subsequently processed with the CLASS and GREG software![]() as described in the following. Due to the irregular sampling, a determination of the spectral power density (SPD) of the time series using Fourier transform techniques would provide low
quality results, and preference was given to the SPD estimate provided by the Lomb technique (Lomb 1976, see also Press et al. 1994). This method only uses the measured data without any prior interpolation onto a regular sampling function, and does a least square fitting to the harmonic contents of the time series. A detection of quasi-periodic fluctuations of
the fractional circular polarization (hereafter
as described in the following. Due to the irregular sampling, a determination of the spectral power density (SPD) of the time series using Fourier transform techniques would provide low
quality results, and preference was given to the SPD estimate provided by the Lomb technique (Lomb 1976, see also Press et al. 1994). This method only uses the measured data without any prior interpolation onto a regular sampling function, and does a least square fitting to the harmonic contents of the time series. A detection of quasi-periodic fluctuations of
the fractional circular polarization (hereafter ![]() )
needs to pass three critical tests. First, we do not expect a significant fluctuation in the Stokes U residuals left after the subtraction of the stationary (within the timescales considered here) linear polarization feature. Second, the oscillation of
)
needs to pass three critical tests. First, we do not expect a significant fluctuation in the Stokes U residuals left after the subtraction of the stationary (within the timescales considered here) linear polarization feature. Second, the oscillation of ![]() was tested against the null hypothesis
that the data are not periodic, but random noise with a Gaussian distribution; this test yields a false-alarm probability. Third, because a restricted number of random samples cannot be strictly Gaussian, Monte-Carlo simulations, with random samples contemporaneous with the observed features, were used to confirm the significance of the false-alarm probabilities.
was tested against the null hypothesis
that the data are not periodic, but random noise with a Gaussian distribution; this test yields a false-alarm probability. Third, because a restricted number of random samples cannot be strictly Gaussian, Monte-Carlo simulations, with random samples contemporaneous with the observed features, were used to confirm the significance of the false-alarm probabilities.
Table 1: Observational results.
3 Results
Only two stars, the Mira variables V Cam and R Leo (Fig. 1) passed the three tests and show clear evidence of a quasi-periodic modulation of their fractional circular polarization ![]() (Fig. 2), of peak-to-peak amplitude
2.8% and 3.7% for V Cam and R Leo, respectively (Table 1). The observations were made
(Fig. 2), of peak-to-peak amplitude
2.8% and 3.7% for V Cam and R Leo, respectively (Table 1). The observations were made ![]() 40 days after the optical maximum of V Cam (pulsation period 522 d) and
40 days after the optical maximum of V Cam (pulsation period 522 d) and ![]() 30 days after that of R Leo (period 310 d), during an expansion phase of the SiO maser shell. Within a
30 days after that of R Leo (period 310 d), during an expansion phase of the SiO maser shell. Within a ![]() 0.4 km s-1 narrow range of radial velocities centred on 7.5 km s-1and 4.4 km s-1, we detect periods of
0.4 km s-1 narrow range of radial velocities centred on 7.5 km s-1and 4.4 km s-1, we detect periods of
![]() and
and
![]() ,
for V Cam and R Leo, respectively (Table 1). The phenomenon is both rare and localized in velocity space (and thus in circumstellar space, due to the velocity structure). The likelihood of misinterpretation of a time series of Gaussian noise is
,
for V Cam and R Leo, respectively (Table 1). The phenomenon is both rare and localized in velocity space (and thus in circumstellar space, due to the velocity structure). The likelihood of misinterpretation of a time series of Gaussian noise is ![]() 4% and
4% and ![]() 16% for
V Cam and R Leo, respectively (Fig. 3, left panels). We note that the Lomb periodograms of the Stokes U residuals do not show any significant periodic signal (Fig. 3, right panels).
16% for
V Cam and R Leo, respectively (Fig. 3, left panels). We note that the Lomb periodograms of the Stokes U residuals do not show any significant periodic signal (Fig. 3, right panels).
The Monte Carlo tests confirm the significance of the results. For 105 runs, only 0.28% of the Lomb periodograms mimic a periodic signal with ![]() 4% false-alarm probability (V Cam), and 2.9% a periodic signal with
4% false-alarm probability (V Cam), and 2.9% a periodic signal with ![]() 16% false-alarm probability (R Leo). We therefore conclude that it is unlikely (for V Cam extremely unlikely) that random noise
creates the observed fluctuations. If they were produced by an oscillation of the telescope tracking, moving the polarized sidelobes across the line-of-sight towards the source, all velocity channels would show fluctuations with the same period, which clearly is not observed and can therefore be safely excluded.
16% false-alarm probability (R Leo). We therefore conclude that it is unlikely (for V Cam extremely unlikely) that random noise
creates the observed fluctuations. If they were produced by an oscillation of the telescope tracking, moving the polarized sidelobes across the line-of-sight towards the source, all velocity channels would show fluctuations with the same period, which clearly is not observed and can therefore be safely excluded.
Variations in the circular polarization of 4% peak-to-peak amplitude were found again in August 2008 (Fig. 4), but now within two and wider velocity intervals, from = -3.6 to -2.7 km s-1 and from -0.5 to 0.7 km s-1. A meaningful Lomb analysis, as applied to the 2006 data, was impossible for these data, because the observing interval was too short to measure afull fluctuation period. The data (Fig. 4 left and middle) suggest a period of about 2 h with an estimated uncertainty of about 0.5 h. We note that in channels of relatively strong Stokes I emission, no significant polarization fluctuation was found (Fig. 4, right), while the linear polarization at about =0.6 km s-1, where Stokes I is strong, now also seems to fluctuate. This again excludes artifacts as being the reason for the fluctuations. If they were of instrumental origin, the entire spectral band would be affected.
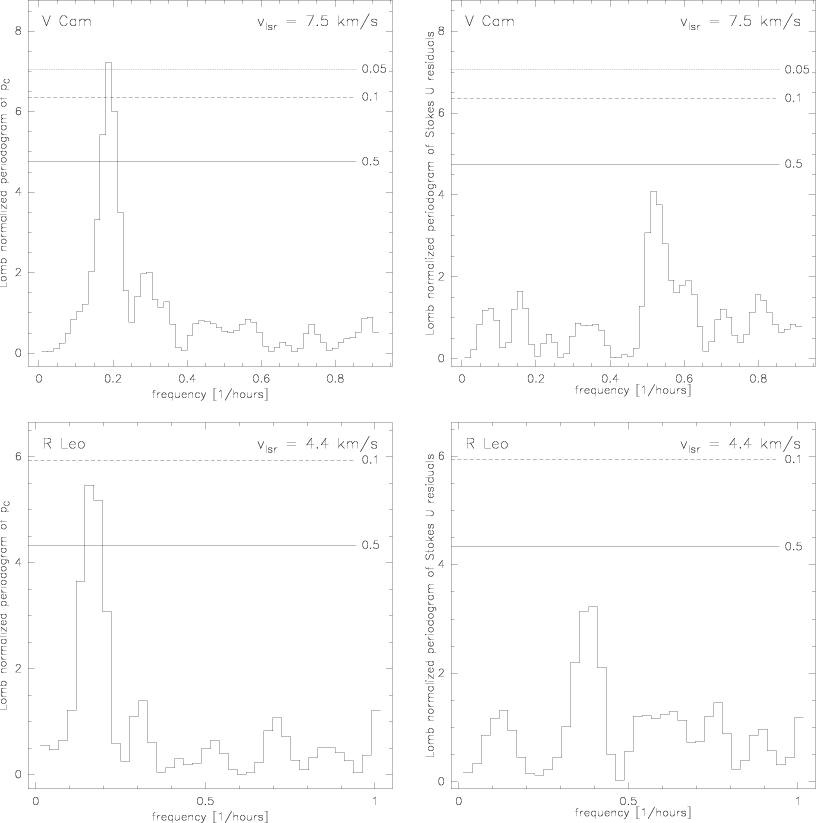 |
Figure 3: Lomb periodograms of the polarization time series (estimates of the spectral power density by least-square fits of their harmonic contents, Lomb 1976), normalized by the variance of the samples. Top left: lomb periodogram of ¸ from V Cam at = 7.5 km s-1. Top right: same for the residuals of Stokes U (normalized by Stokes I, after subtraction of the stationary linear polarization). Bottom left and right: as top panels, but for R Leo at =4.4 km s-1. The horizontal dashed lines indicate the spectral power density at which a periodic signal can be mimicked by Gaussian noise with a probability given by the labels (''false alarm probability''). For a given source, the plot scale for the Lomb periodograms of ¸ and the Stokes U residuals is the same, to make the comparison of the significance of the peaks easier. |
| Open with DEXTER | |
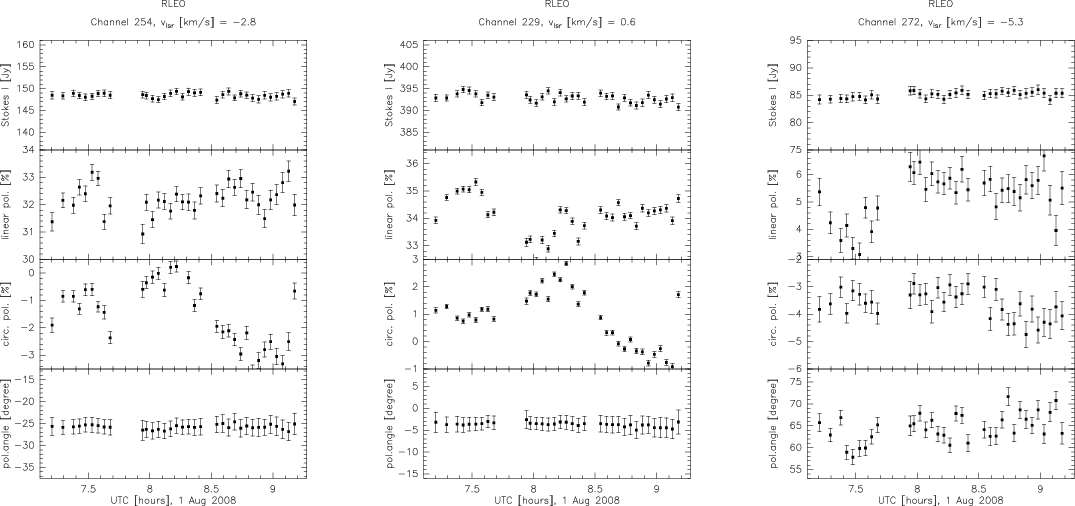 |
Figure 4: Same as Fig. 2, but for R Leo at three selected velocities (observations from 2008 August 1). Left: =-2.8 km s-1. Middle: =0.6 km s-1. Right: =-5.3 km s-1. |
| Open with DEXTER | |
4 Discussion
The fractional circular polarization is a more reliable magnetic tracer than
linear polarization, especially for spatially unresolved observations. This is because our telescope beam averages the polarization signal from all maser spots at the same radial velocity, and because the orientation of the linear polarization is either parallel or perpendicular to the maser shell (e.g., Diamond & Kemball 2003; Desmurs et al. 2000). This tends to decrease the beam-averaged linear polarization, except if it is dominated by a few, strong maser spots close
together (which may explain the linear polarization fluctuations evident in the August 2008 observations of R Leo, Fig. 4, middle). Furthermore, linear polarization can be produced entirely without magnetic fields by anisotropic pumping (Western & Watson 1983; Asensio Ramos et al. 2005), although polarization angle swings by ![]() in the aforementioned resolved observations are explained by changes in the magnetic field direction with respect to the propagation direction of radiation in the maser (Goldreich et al. 1973). By contrast, circular polarization is
enhanced in magnetized maser spots, either directly by Zeeman splitting (e.g., Watson & Wyld 2001), or indirectly by birefringent conversion of linear into circular polarization due to changes in the magnetic field topology along the maser slab (Wiebe & Watson 1998, for unsaturated masers), or due to maser saturation, rotating the quantization axis from the direction of the magnetic field to that of the radiation propagation in the maser (Nedoluha & Watson 1994). In the latter case, pump conditions would be required not only to vary in time but also quasi-periodically, an event which we cannot exclude but seems unlikely on short timescales. This would also produce a varying Stokes I flux density, which is not observed. We therefore suggest that the intraday fluctuations of ¸ are of magnetic origin. They are quasi-periodical, not stochastic, and rare and only at one velocity, which means that an ordered magnetic field structure with smooth gradients in time and space is locally maintained within the dense AGB winds of R Leo and V Cam.
in the aforementioned resolved observations are explained by changes in the magnetic field direction with respect to the propagation direction of radiation in the maser (Goldreich et al. 1973). By contrast, circular polarization is
enhanced in magnetized maser spots, either directly by Zeeman splitting (e.g., Watson & Wyld 2001), or indirectly by birefringent conversion of linear into circular polarization due to changes in the magnetic field topology along the maser slab (Wiebe & Watson 1998, for unsaturated masers), or due to maser saturation, rotating the quantization axis from the direction of the magnetic field to that of the radiation propagation in the maser (Nedoluha & Watson 1994). In the latter case, pump conditions would be required not only to vary in time but also quasi-periodically, an event which we cannot exclude but seems unlikely on short timescales. This would also produce a varying Stokes I flux density, which is not observed. We therefore suggest that the intraday fluctuations of ¸ are of magnetic origin. They are quasi-periodical, not stochastic, and rare and only at one velocity, which means that an ordered magnetic field structure with smooth gradients in time and space is locally maintained within the dense AGB winds of R Leo and V Cam.
4.1 A case for precessing Jovian magnetic fields?
The magnetopheres of Jovian planets have already been proposed to explain several features of SiO
maser polarization (Struck et al. 2002, 2004), providing a local explanation of the strong magnetism in the atmosphere of AGB stars. If the magnetic fields in which SiO masers are embedded, of typically 10 G, were global, one would assume, at the stellar surface, a magnetic field of about 100 to 1000 G, depending on assumptions about the gradient of the magnetic flux density. Such a field could be generated by a dynamo between the rotating core and the stellar convection zone (Blackman et al. 2001). However, we must now explain (see item 3 below) why Mira stars were not detected (Haisch et al. 1991) by the Rosat all-sky soft X-ray survey, which is sensitivity-limited to X-ray luminosities of typically above
![]() erg s-1. Kastner & Soker (2004a) found that the X-ray
luminosity of the single Mira stars TX Cam and T Cas is below the threshold expected for a dynamically important magnetic field. Their conclusion relied on the assumption that the X-ray luminosity equals the kinetic luminosity of the stellar wind
powered by magnetic fields. Since there may be ways of dissipating magnetic energy other than by X-ray emission from accelerated particles, this is still an open issue.
erg s-1. Kastner & Soker (2004a) found that the X-ray
luminosity of the single Mira stars TX Cam and T Cas is below the threshold expected for a dynamically important magnetic field. Their conclusion relied on the assumption that the X-ray luminosity equals the kinetic luminosity of the stellar wind
powered by magnetic fields. Since there may be ways of dissipating magnetic energy other than by X-ray emission from accelerated particles, this is still an open issue.
![\begin{figure}
\par\includegraphics[width=7.5cm,clip]{aa11242-fig5.eps}\\ [1.5mm]
\includegraphics[width=7.5cm,clip]{1242fg5b.ps}
\end{figure}](/articles/aa/full_html/2009/18/aa11242-08/img39.png) |
Figure 5:
Top: Keplerian velocity fit of maser features associated with the suggested planet (LSR velocities at the tip of the planetary wake flow, and velocities of polarization fluctuations). Time is in years since 2001 Aug. 4 (observations of Cotton et al. 2004). Other references: Soria-Ruiz et al. (2007, 2002 Dec. 7), (Cotton et al. 2008, 2004 Sep. 5), this work (2006 May 22 and 2008 Aug. 1). Bottom: available astrometric information and least-square fit of the derived planetary orbit (Appendix A), for d=113.5 pc stellar distance. VLBI positions are indicated by black dots. The planetary orbit is indicated by the black line, crosses mark the fitted position at the VLBI epochs. Empty circles give the positions of the planet at the epochs of our polarization measurements. The linear polarizations measured by us and their position angles are shown as bars (the bar in the top left corner indicates a fractional linear polarization of 30%). The grey-shaded disk indicates the measured |
| Open with DEXTER | |
We now summarize the arguments supporting the plausible planetary origin of our detections:
- 1.
- the rareness of the phenomenon can be explained by the number of Jovian planets around AGB stars, and by the requirement that the gain region of the maser needs to cross the magnetosphere where it is dominated by the dipole component. At present, we cannot distinguish which explanation prevails - the possible rareness of Jovian planets in AGB atmospheres due to infall of planets into the star (Villaver & Livio 2007; Nordhaus & Blackman 2006), or the unfavourable location of the SiO maser with respect to the precessing magnetosphere;
- 2.
- both in V Cam and R Leo, the signature is statistically significant only at one velocity. We interprete this velocity as the current line-of-sight velocity of a planet on its Keplerian orbit;
- 3.
- dedicated models (Wiesemeyer 2008) of saturated SiO maser emission in a precessing magnetic dipole field indicate that a dipole moment eight times stronger than that of Jupiter's magnetic field is sufficient to provide the
 1 G magnetic flux density at
 distance, required to explain the peak-to-peak variation of ¸
(Table 1). This reconciles maser polarization and the lack of an X-ray luminosity expected for a stellar corona. Saturated maser action is not required here, if the weak circular polarization of unsaturated masers is enhanced by the combined effect of anisotropic pumping and magnetorotation (Wiesemeyer 2008);
distance, required to explain the peak-to-peak variation of ¸
(Table 1). This reconciles maser polarization and the lack of an X-ray luminosity expected for a stellar corona. Saturated maser action is not required here, if the weak circular polarization of unsaturated masers is enhanced by the combined effect of anisotropic pumping and magnetorotation (Wiesemeyer 2008);
- 4.
- the fluctuations are quasi-periodic, not stochastic. The fluctuation periods derived from the Lomb periodograms of the ¸ fluctuations in R Leo and V Cam can be modelled as the first and second harmonic, respectively, of the planetary rotation period, which is
 and
and
 ,
respectively (cf. Jupiter's rotation period of
,
respectively (cf. Jupiter's rotation period of
 ,
and Saturn's
of
,
and Saturn's
of
 ). A misalignment of the dipole axis with the planetary rotation axis (10
 in the models,
 for Jupiter) naturally explains both the amplitude and the period of the fluctuation, due to the ordered
structure of the magnetic field. This implies that the magnetosphere is
protected by a Chapman-Ferraro type magnetopause, where ram pressure equals magnetic pressure, at about
for Jupiter) naturally explains both the amplitude and the period of the fluctuation, due to the ordered
structure of the magnetic field. This implies that the magnetosphere is
protected by a Chapman-Ferraro type magnetopause, where ram pressure equals magnetic pressure, at about
 (Jupiter radii) substellar distance (according to Struck-Marcell 1988). To date, it remains uncertain why
our R Leo data from 2008 yield a different period. This may be partly due to the incompleteness of
the data, partly due to the proper motion of the maser spots, which may cross
in 10 h and thus modify the pattern expected for a stationary fluctuation. Any intrinsic origin (changes in the angular momentum of accretion onto the planet, or of the spin of the latter) would be most difficult to model. Likewise, it is still unclear why in 2008, polarization fluctuations appeared in two well-separated velocity ranges;
(Jupiter radii) substellar distance (according to Struck-Marcell 1988). To date, it remains uncertain why
our R Leo data from 2008 yield a different period. This may be partly due to the incompleteness of
the data, partly due to the proper motion of the maser spots, which may cross
in 10 h and thus modify the pattern expected for a stationary fluctuation. Any intrinsic origin (changes in the angular momentum of accretion onto the planet, or of the spin of the latter) would be most difficult to model. Likewise, it is still unclear why in 2008, polarization fluctuations appeared in two well-separated velocity ranges;
- 5.
- if the pseudo-periods of the fluctuations were due only to the proper motion (10 km s-1) of SiO maser spots (with 0.1 AU diameter) across a quasi-stationary magnetic perturbation, this would result in periods that
are two orders of magnitude longer than the observed ones. This would then imply that the magnetic field diffuses through the gas of the maser slab, i.e., the ambipolar diffusion speed exceeds the maser velocity. A Jovian magnetic field provides both the required strength and curvature radius of the field lines (Struck et al. 2002), unlike a magnetic field of
stellar origin;
- 6.
- spatially resolved observations (Cotton et al. 2008) of the
v=1, J=1-0 SiO masers in R Leo show, at 4-7.9 km s-1 radial velocity (with the largest red-shifted velocity closest to the star), a remarkable elongated feature suggestive of a planetary wake flow as modelled by Struck et al. (2004). The corresponding feature in the
v=2,J=1-0 transition is even double-lobed. Similar features were found by Cotton et al. (2004) and Soria-Ruiz et al. (2007) at various circumstellar positions and different epochs.
4.2 Kinematical and astrometric evidence for a planet orbiting around R Leo
We consider here the presence of elongated features (see item 6 above) as the possible signature of a planetary wake, although explanations involving the theory of maser formation cannot be excluded. In the framework of this working hypothesis, we now use the available kinematic and astrometric information to illustrate the potential interest of combining SiO polarization monitoring observations with contemporaneous VLBI imaging of SiO masers. The VLBA observations of Cotton et al. (2008) were acquired in September 2004, 638 days after similar observations by Soria-Ruiz et al. (2007) in December 2002, while we observed in May 2006, 624 days after Cotton et al. (2008). Remarkably, the
v=1, J=1-0 map of Soria-Ruiz et al. shows, at about = -7 km s-1 (with respect to the local standard of rest, hereafter LSR), a similar elongated maser feature pointing radially away from the star towards the South-East, and another one
towards North-East, with velocities peaking at =2.5 km s-1 and -2 km s-1.
This suggestion is confirmed by inspection of the VLBA map taken in August 2001 by Cotton et al. (2004), again showing a quasi-radial alignment of maser spots, now towards the north. The repeated occurence of such features, systematically rotated counter-clockwise from North, strengthens the suggestion of a wake flow associated with the same planet.
However, the combined use of
v=1,J=2-1 polarization monitoring and
v=1,J=1-0 VLBI astrometry raises new questions. When studying R Leo, Soria-Ruiz et al. (2007) demonstrated that the former maser spots do not coincide with those corresponding to the latter transition. The characteristic ring radii of the respective maser shells are 29.2 mas and 33.8 mas, for the J=1-0 and J=2-1 transitions, whereas collisional and
radiative pumping models (see Soria-Ruiz et al. 2007, for further references) suggest that at a given time the maser spots of these transitions should be sufficiently close together for either transition to be used in our combined astrometric and kinematical analysis. With this inconsistency in mind, a lower limit to the astrometric error in the comparison of our polarization data with the VLBA positions can therefore
be estimated from the difference between the ring radii, 4.6 mas or 0.5 AU (for 113.5 pc distance, Fedele et al. 2007, further references therein). The true astrometric error may be higher, because the absolute astrometry of these VLBI data from different epochs is far less well constrained than the relative astrometry for a single observing date. Despite this limitation, we use the available combined
kinematics and astrometric information to constrain the planetary orbit. The velocity in the wake flows is
usually decelerated, and the maximum absolute value of the velocity should therefore be closest to the
planet. A sine fit (Fig. 5, top) yields a period of 5.2 years and a stellar velocity of = 1.7 km s-1,
but more observations are needed to assess the significance of the fit. Our 2008 data are described most accurately by the velocity of the more blue-shifted polarization fluctuation. The fitted stellar velocity is between the value derived by Bujarrabal et al. (1989) from thermal molecular lines in the circumstellar
envelope (-0.5 km s-1) and the catalogue value of 13.4 km s-1 (GCRV, Wilson 1953). Using the method
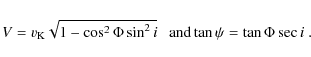
described in Appendix A, this velocity fit allows us to determine the radius of the planetary orbit to 23.8 mas, which corresponds to 2.7 AU at a distance of 113.5 pc. The inclination of the orbital plane with respect to the plane of the sky is
![]() .
The result of the least squares fit to the available astrometric information is shown in Fig. 5 (bottom). The linear polarization measured by us is predominantly parallel to the radius vector calculated from the model fit. Because uncertainties in our method and in the astrometric positions of the VLBI spot maps (no absolute uncertainties are derived in the works of Cotton et al. and Soria-Ruiz et al.), it is unsurprising to observe a discrepancy between
the observed and modelled positions, especially for the 2002 Dec. 7 VLBA observation (Soria-Ruiz 2007).
.
The result of the least squares fit to the available astrometric information is shown in Fig. 5 (bottom). The linear polarization measured by us is predominantly parallel to the radius vector calculated from the model fit. Because uncertainties in our method and in the astrometric positions of the VLBI spot maps (no absolute uncertainties are derived in the works of Cotton et al. and Soria-Ruiz et al.), it is unsurprising to observe a discrepancy between
the observed and modelled positions, especially for the 2002 Dec. 7 VLBA observation (Soria-Ruiz 2007).
As for the August 2008 data in R Leo showing polarization fluctuations at two different velocities,
contemporaneous VLBI observations would have been required to determine whether the second
velocity interval is due to a wake flow and therefore to another planet. However, it seems too
speculative at this stage to suggest that each elongated VLBI maser feature is associated with a
planet while jet-like features could as well be interpreted as ejections of matter (see e.g., Cotton et al. 2008). Our fit provides a stellar mass estimate of
![]() ,
below, but not unreasonably far from
the value inferred from measurements of stellar parameters by infrared K-band interferometry (Fedele et al. 2005), namely
,
below, but not unreasonably far from
the value inferred from measurements of stellar parameters by infrared K-band interferometry (Fedele et al. 2005), namely
![]() ,
for an equivalent non-pulsating star of the same luminosity. The discrepancy can either be due to observational error or model uncertainties. As a matter of fact, the R Leo maps of Cotton et al. (2008) mentioned above show several elongated maser features, and it is unlikely that each is associated with a planet (Cotton et al. 2008 rather suggest jet-like ejections of matter; see Sect. 4.3.6 below). The conclusion that the polarization fluctuations observed at two velocities in R Leo in 2008 are due to the presence of two planets would therefore be speculative, even if contemporaneous VLBI data were at hand.
,
for an equivalent non-pulsating star of the same luminosity. The discrepancy can either be due to observational error or model uncertainties. As a matter of fact, the R Leo maps of Cotton et al. (2008) mentioned above show several elongated maser features, and it is unlikely that each is associated with a planet (Cotton et al. 2008 rather suggest jet-like ejections of matter; see Sect. 4.3.6 below). The conclusion that the polarization fluctuations observed at two velocities in R Leo in 2008 are due to the presence of two planets would therefore be speculative, even if contemporaneous VLBI data were at hand.
4.3 Are alternative scenarios viable?
Boldly extrapolating the rich magnetic phenomena in the solar system to late-type stellar systems, alternative scenarios have to be seriously examined. One might suggest magnetic activity due to stellar companions, coronal loops, magnetic clouds or Parker instabilities in shocks forming in response to stellar pulsations.
4.3.1 Binarity
Here the mass transfer from the AGB star to a close companion generates flares and related magnetic
fluctuations, which are not necessarily located in the atmosphere of the former (e.g. the Mira AB system, Kastner & Soker 2004b). However, neither V Cam nor R Leo are known for having stellar companions, otherwise their X-ray luminosities would be higher. Tatebe et al. (2006, IR interferometry at ![]() m) did not detect any obvious asymmetry in the envelope of R Leo that could imply the presence of a companion (see also Gatewood 1992).
m) did not detect any obvious asymmetry in the envelope of R Leo that could imply the presence of a companion (see also Gatewood 1992).
The case of the 2003 soft X-ray outburst in the Mira AB system is, interestingly, unrelated to the binarity of the system. The spatially resolved Chandra observations (Karovska et al. 2005) clearly show that it occurred within the envelope of Mira A, and it would be worthwhile to estimate whether it was triggered by burst-like accretion onto a Jovian planet, as suggested by Struck et al. (2004). The position of the X-ray flare may coincide with a linear SiO feature seen by Cotton et al. (2004).
4.3.2 Coronal loops
Coronal loops are generated by the interplay of differential rotation in the sub-photosphere with the dynamo (Blackman et al. 2001) at the interface with the core. If the convection zone extends to at least 80% of the stellar radius (Holzwarth & Schüssler 2001), magnetic flux loops are trapped there, because magnetic stresses at the tips of the loops act against convective buoyancy. This also explains the
weakness of the coronal X-ray luminosity, and why the magnetic fluctuations are rare. One may suggest coronal loops to extend occasionally to the site of the SiO masers. If there were coronal flux loops, the timescale
for magnetic fluctuations would be, however, too long. This can be demonstrated in the following way: by assuming (by analogy with the sun) that the size of a loop corresponds to that of a super-granulation cell, it is found to equal 0.2 AU, for a 1 AU stellar radius and 400 convection cells in the stellar subphotosphere (Schwarzschild 1975), in contrast to
![]() convection cells for the Sun. Interferometric K-band size measurements (Fedele et al. 2005) yield a Rosseland radius of 1.6 AU at phase 0.08, close to the brightness maximum in April 2001 (cf. our measurements at phase 0.08 after the brightness maximum in 2006). Our orbital radius estimate of 2.7 AU thus infers that the maser is 1.1 AU above the stellar photosphere. Assuming a photospheric rotation speed of
convection cells for the Sun. Interferometric K-band size measurements (Fedele et al. 2005) yield a Rosseland radius of 1.6 AU at phase 0.08, close to the brightness maximum in April 2001 (cf. our measurements at phase 0.08 after the brightness maximum in 2006). Our orbital radius estimate of 2.7 AU thus infers that the maser is 1.1 AU above the stellar photosphere. Assuming a photospheric rotation speed of ![]() 1 km s-1 (a higher rotation speed is possible only for AGB stars with at least a brown dwarf companion, Soker 2006), a corotating flux loop would need
1 km s-1 (a higher rotation speed is possible only for AGB stars with at least a brown dwarf companion, Soker 2006), a corotating flux loop would need ![]() 100 days to cross a maser spot of 0.1 AU diameter. This is two orders of magnitude longer than our fluctuation periods, which makes it highly unlikely that coronal loops can generate the observed hour-scale magnetic fluctuations. The scenario involving trapped magnetic flux loops also demonstrates that from the weak X-ray luminosities one cannot infer the absence of an efficient stellar dynamo - the magnetically accelerated particles simply remain within the convective envelope and are therefore not evident in X-ray observations.
100 days to cross a maser spot of 0.1 AU diameter. This is two orders of magnitude longer than our fluctuation periods, which makes it highly unlikely that coronal loops can generate the observed hour-scale magnetic fluctuations. The scenario involving trapped magnetic flux loops also demonstrates that from the weak X-ray luminosities one cannot infer the absence of an efficient stellar dynamo - the magnetically accelerated particles simply remain within the convective envelope and are therefore not evident in X-ray observations.
4.3.3 Magnetic clouds
As coronal loops, magnetic clouds originate from the magnetic activity on the surface of the stellar
photosphere. If coronal loops are absent, due to a lack of magnetic activity, this also holds for magnetic clouds of the type encountered in the solar wind (e.g., Bothmer & Schwenn 1998). If magnetic clouds traverse the extended stellar atmosphere, we can approximate the timescale associated with the corresponding magnetic fluctuations. The size of magnetic clouds in the solar system is comparable to that of SiO masers (0.1 AU), and their magnetic field vector also rotates on a timescale of ![]() 10 h. However, solar system magnetic clouds expand with the speed (
10 h. However, solar system magnetic clouds expand with the speed (![]() 400 km s-1) of the magnetically driven solar wind. Since the solar wind speed is an order of magnitude above that of an AGB wind and SiO maser proper motions, the timescale would be too long and the resulting polarization would vary too slowly (especially if the magnetic cloud is decelerated by the dense ambient gas).
400 km s-1) of the magnetically driven solar wind. Since the solar wind speed is an order of magnitude above that of an AGB wind and SiO maser proper motions, the timescale would be too long and the resulting polarization would vary too slowly (especially if the magnetic cloud is decelerated by the dense ambient gas).
4.3.4 Parker instabilities
To produce polarized maser features of the observed lifetime (months to years, Glenn et al. 2003), the latter needs to be shorter than the ambipolar diffusion timescale, i.e., the magnetic flux has to be coupled with the masing matter. The fragments forming as a consequence of Parker instabilities (Hartquist & Dyson 1997) fulfil this requirement under the typical conditions in the extended atmosphere of AGB stars. Since Parker instabilities arise from a local indentation orthogonal to the field lines, some short-term variations in the magnetic field component along the line of sight may be expected if the ambipolar diffusion timescale of these fluctuations exceeds that of the maser lifetime and proper motion. The resulting variability of ¸ should globally affect all maser spots of an SiO star if they commonly arise from fragments formed by this mechanism, in contradiction with our observations. Furthermore, the mass of fragments forming in response to Parker instabilities scales with magnetic pressure, and the strongest fluctuations would be expected from the strongest masers, which has not been observed (cf. Figs. 2 and 4).
4.3.5 Alfvén waves
Our discussion would be incomplete without considering Alfvén waves (Alfvén 1942, see e.g. Sturrock 1994) as a possible origin of rapid magnetic fluctuations. However, our knowledge of hydromagnetic wave propagation in the dense AGB atmospheres is poor. The relevant timescale here would be
| (1) |
where D is the diameter of a maser slab, and
 |
(2) |
where, in the weak-coupling regime,
 |
(3) |
for a 10 G magnetic field and a hydrogen number density of
4.3.6 A precessing jet?
The role of a planetary or brown-dwarf companion in shaping the circumstellar envelopes was modelled by Nordhaus & Blackman (2006). Since in their scenarios the companion is already engulfed in the convective envelope of the star, it can no longer be detected by polarimetry. The deposit of the planetary angular momentum leads to a spin-up of the star and by consequence to the ejection of matter by equatorial mass loss or, if assisted by the stellar magnetic field, to a bipolar jet. Is it conceivable that we observed the polarization signature due to the precession of such a jet? If the precession is caused by the misalignment between the jet axis and the stellar rotation axis, we can estimate the timescale of the phenomenon as in the case of coronal loops (Sect. 4.3.2), except that we must account for the spin-up of the star. Nordhaus & Blackman showed that an infalling brown dwarf of
![]() may increase the stellar rotation rate by an order of magnitude. The fluctuation of the circular maser polarization due to
a crossing jet would therefore occur on a timescale of at least 10 days if the cross-sectional area of the jet perpendicular to its axis is smaller than the size of the maser spot, or longer otherwise. This is still one to two orders of magnitude above the fluctuations observed by us. Furthermore, to leave a signature only in a few SiO masers, the opening angle of the jet cannot be too large.
may increase the stellar rotation rate by an order of magnitude. The fluctuation of the circular maser polarization due to
a crossing jet would therefore occur on a timescale of at least 10 days if the cross-sectional area of the jet perpendicular to its axis is smaller than the size of the maser spot, or longer otherwise. This is still one to two orders of magnitude above the fluctuations observed by us. Furthermore, to leave a signature only in a few SiO masers, the opening angle of the jet cannot be too large.
5 Conclusions
In our opinion, we conclude that none of the non-planetary alternatives explains satisfactorily the present observations of R Leo and V Cam, while a single scenario, namely precessing Jovian-type magnetospheres, are consistent with all of them. Since the discovery of a planet around a star in the post-red giant phase (Silvotti et al. 2007), we have known that planets can survive in such an environment. Whether a given planet survives the AGB phase of its parent star depends on several factors (Villaver & Livio 2007). Evolution of the orbit is the main factor: depending on its distance from the star, the planet is either dragged inwards by tidal friction and evaporated, or repelled due to stellar mass loss, while for Jupiter-sized planets the
gain of mass due to Roche flow from the star or accretion from the stellar wind barely affect their orbits. If the suggested planet around R Leo, one of the best studied Mira stars, of solar mass and at 113.5 pc distance (Fedele et al. 2005), does not spiral in and evaporate during the remainder of the upper AGB phase, it will survive the subsequent planetary nebula stage against evaporation (Villaver & Livio 2007) only if it has at least two Jupiter masses and orbits at least at ![]() 3 AU. We note that the fluctuating SiO maser feature in R Leo has an orbital radius of 2.7 AU, close to the critical distance. We have demonstrated that
the orbital elements of its host planet can be determined by measuring the velocity of the fluctuation and the position of the corresponding maser spot. The orbital period of the planet is 5.2 years, which provides an estimate of the stellar mass of
3 AU. We note that the fluctuating SiO maser feature in R Leo has an orbital radius of 2.7 AU, close to the critical distance. We have demonstrated that
the orbital elements of its host planet can be determined by measuring the velocity of the fluctuation and the position of the corresponding maser spot. The orbital period of the planet is 5.2 years, which provides an estimate of the stellar mass of
![]() .
This agrees with mass estimates found in the literature, of about
.
This agrees with mass estimates found in the literature, of about
![]() for R Leo. In the long term, our method has the potential to reveal, together with an independent estimate of the stellar mass, sub-Keplerian orbital motion and thus migration of the planet
through the atmosphere towards the star. This requires correspondingly accurate observations. The situation may be complicated by the presence of several planets, whose orbits could be constrained by our method provided that the polarization fluctuations are not affected by a spectral blend of independent features at the same radial velocity and that the VLBI observations are free from a spatial blend of independent features along the same line of sight. The estimated mass loss of R Leo,
for R Leo. In the long term, our method has the potential to reveal, together with an independent estimate of the stellar mass, sub-Keplerian orbital motion and thus migration of the planet
through the atmosphere towards the star. This requires correspondingly accurate observations. The situation may be complicated by the presence of several planets, whose orbits could be constrained by our method provided that the polarization fluctuations are not affected by a spectral blend of independent features at the same radial velocity and that the VLBI observations are free from a spatial blend of independent features along the same line of sight. The estimated mass loss of R Leo, ![]()
![]() ,
is too weak to measure orbit evolution within a reasonable amount of time (
,
is too weak to measure orbit evolution within a reasonable amount of time (![]()
![]() as in 1000 years). The situation
may change if the opposite effect due to tidal friction, neglected in this estimate, is by several orders of magnitude more important than that of stellar mass loss.
as in 1000 years). The situation
may change if the opposite effect due to tidal friction, neglected in this estimate, is by several orders of magnitude more important than that of stellar mass loss.
Without further observational evidence at hand, one can only speculate on whether the suggested Jovian magnetic fields are decisive for evaporation or survival of the planets. They suppress turbulent viscosity and therefore the tidal friction induced by the latter (Zahn 1977), and also lead to spin angular momentum loss due to magnetic braking. This contrasts with scenarios where the coupling between the stellar magnetic field and the planetary one leads to an increased drag area and therefore infall of the planet, compared to the case of an unmagnetized planet. The finding that our observations most likely imply a planetary magnetopause may turn out to be important here and motivate studies of planetary evolution in late-type stars that include magnetic star-planet interaction (omitted by Villaver & Livio 2007, but included by Nordhaus & Blackman 2006, who predicted stellar outflows). The case for exoplanetary magnetism proposed here can only be strengthened by a combination of extensive simultaneous polarization monitoring and repeated spatially resolved observations. The experimentum crucis for an unambiguous evidence of planets will be the detection of orbital motion in the proper motion of maser spots showing the magnetic fluctuations, by contemporaneous direct imaging of the suggested wake flows at the same velocity as the fluctuations. This double set of pieces of evidence would exclude ambiguities: there may be planets without wake flows, if the wind density is insufficient to produce observable features, and there are radial alignments of maser spots not related to wake flows. The coincidence of a persisting pseudo-periodic magnetic fluctuation with a radial alignment of maser spots strongly suggests that these phenomena are associated and naturally explained by a precessing Jovian magnetosphere and a planetary wake flow, respectively.
Acknowledgements
Based on observations with the IRAM 30 m telescope. IRAM is supported by INSU/CNRS (France), MPG (Germany) and IGN (Spain). Gabriel Paubert, supported by the IRAM backend group, built VESPA which provides simultaneous measurements of all Stokes parameters. We used the valuable optical lightcurves of the AAVSO (http://www.aavso.org) and acknowledge support from the telescope staff. We thank the anonymous referee for his constructive and helpful comments. We dedicate this paper to the memory of Matthew Carter, who passed away in November 2008. Matt was a valued colleague and friend who made many important contributions to the success of the IRAM receivers.
Appendix A: Determination of orbital parameters
Here we summarize the determination of orbital parameters, which follows the classical method of analysing spatially and spectrally resolved binary systems. Without further observational evidence at hand, we treat only the case of a circular orbit here.
![\begin{figure}
\par\includegraphics[width=8.8cm,clip]{1242fg6.ps}
\end{figure}](/articles/aa/full_html/2009/18/aa11242-08/img59.png) |
Figure A.1:
Definition of the orbital parameters. The xyz coordinate system is shown by
solid arrows (the yz plane, i.e. the drawing plane, is the plane of the sky), the
|
| Open with DEXTER | |
The coordinate systems applied and the orbital parameters are defined in Fig. A.1.
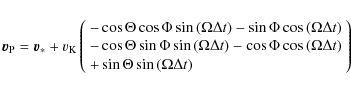
The transformation of the radius vector (pointing from the star to the planet) between the
orbital plane, which defines the system
![]() and the xyz coordinate system (where the
x axis is the line of sight to the observer, and where the yz plane is the sky plane) is given by
and the xyz coordinate system (where the
x axis is the line of sight to the observer, and where the yz plane is the sky plane) is given by
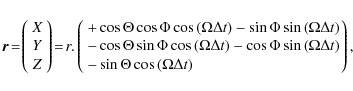
where r is the distance between the star and planet,
Furthermore,
where
where
The analysis of the observations is now straightforward. We need to identify a predominantly
radial alignment of SiO maser spots at the velocity where the fluctuations of circular
polarization are observed, suggesting that they are located in the wake flow of a planet
whose magnetic dipole axis is misaligned with its rotation axis. The velocity at which the
fluctuations occur is interpreted as the line-of-sight velocity of the planet in the
LSR,
![]() .
A sine wave fit to the measurements of
.
A sine wave fit to the measurements of
at several epochs yields the stellar LSR velocity
 |
(A.6) |
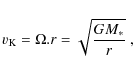
These parameters are used together with the positions of the wake flows in the VLBI maps to constrain the radius of the orbit, r (and therefore the Keplerian velocity
The main uncertainty in this combined kinematical and astrometrical method is the association of a magnetic fluctuation with a precessing planetary magnetosphere, and the planet's position with the head of the wake flow. It is therefore advisable to overdetermine the velocity and position fit, to minimize the impact of the observational uncertainties inherent to the method.
References
- Alfvén, H. 1942, Nature, 150, 405 [NASA ADS] [CrossRef]
- Asensio Ramos, A., Landi Degl'Innocenti, E., & Trujillo Bueno, J. 2005, ApJ, 625, 985 [NASA ADS] [CrossRef] (In the text)
- Barvainis, R., McIntosh, G., & Predmore, C. R. 1987, Nature, 329, 613 [NASA ADS] [CrossRef] (In the text)
- Blackman, E. G., Frank, A., Markiel, J. A., Thomas, J. H., & Van Horn, H. M. 2001, Nature, 409, 485 [NASA ADS] [CrossRef] (In the text)
- Bothmer, V., & Schwenn, R. 1998, Annales Geophysicae, 16, 1 [NASA ADS] [CrossRef] (In the text)
- Bujarrabal, V., Gomez-Gonzales, J., & Planesas, P. 1989, A&A, 219, 256 [NASA ADS] (In the text)
- Cotton, W. D., Mennesson, B., Diamond, P., et al. 2004, A&A, 414, 275 [NASA ADS] [CrossRef] [EDP Sciences] (In the text)
- Cotton, W. D., Perrin, G., & Lopez, B. 2008, A&A, 477, 853 [NASA ADS] [CrossRef] [EDP Sciences] (In the text)
- Desmurs, J. F., Bujarrabal, V., Colomer, F., & Alcolea, J. 2000, A&A, 360, 189 [NASA ADS] (In the text)
- Diamond, P. J., & Kemball, A. J. 2003, ApJ, 599, 1372 [NASA ADS] [CrossRef] (In the text)
- Elitzur, M. 1996, ApJ, 457, 415 [NASA ADS] [CrossRef] (In the text)
- Fedele, D., Wittkowski, M., Paresce, F., Scholz, M., Wood, P. R., & Ciroi, S. 2005, A&A, 431, 1019 [NASA ADS] [CrossRef] [EDP Sciences] (In the text)
- Gatewood, G. 1992, PASP, 104, 23 [NASA ADS] [CrossRef] (In the text)
- Glenn, J., Jewell, P. R., Fourre, R., & Miaja, L. 2003, ApJ, 588, 478 [NASA ADS] [CrossRef] (In the text)
- Goldreich, P., Keeley, D. A., & Kwan, J. Y. 1973, ApJ, 179, 111 [NASA ADS] [CrossRef] (In the text)
- Haisch, B., Schmitt, J. H. M. M., & Rosso, C. 1991, ApJ, 383, L15 [NASA ADS] [CrossRef] (In the text)
- Hartquist, T. W., & Dyson, J. E. 1997, A&A, 319, 589 [NASA ADS] (In the text)
- Herpin, F., Baudry, A., Thum, C., Morris, D., & Wiesemeyer, H. 2006, A&A, 450, 667 [NASA ADS] [CrossRef] [EDP Sciences] (In the text)
- Herwig, F. 2005, ARA&A, 43, 435 [NASA ADS] [CrossRef] (In the text)
- Holzwarth, V., & Schüssler, M. 2001, A&A, 377, 251 [NASA ADS] [CrossRef] [EDP Sciences] (In the text)
- Kang, J., Cho, S.-H., Kim, H.-G., et al. 2006, ApJS, 165, 360 [NASA ADS] [CrossRef] (In the text)
- Karovska, M., Schlegel, E., Hack, W., Raymond, J. C., & Wood, B. E. 2005, ApJ, 623, L137 [NASA ADS] [CrossRef] (In the text)
- Kastner, J. H., & Soker, N. 2004a, ApJ, 608, 978 [NASA ADS] [CrossRef]
- Kastner, J. H., & Soker, N. 2004b, ApJ, 616, 1188 [NASA ADS] [CrossRef] (In the text)
- Lomb, N. R. 1976, Ap&SS, 39, 447 [NASA ADS] [CrossRef] (In the text)
- Nedoluha, G. E., & Watson, W. D. 1994, ApJ, 423, 394 [NASA ADS] [CrossRef] (In the text)
- Nordhaus, J., & Blackman, E. G. 2006, MNRAS, 370, 2004 [NASA ADS] (In the text)
- Pardo, J. R., Alcolea, J., Bujarrabal, V., et al. 2004, A&A, 424, 145 [NASA ADS] [CrossRef] [EDP Sciences] (In the text)
- Prangé, R., Pallier, L., Hansen, K. C., et al. 2004, Nature, 432, 78 [NASA ADS] [CrossRef] (In the text)
- Press, W. H., Teukolsky, S. A., Vetterling, W. T., & Flannery, B. P. 1994, Numerical Recipes in C. The Art of Scienctific Computing, 2nd Ed. (Cambridge University Press), 575 (In the text)
- Schwarzschild, M. 1975, ApJ, 195, 137 [NASA ADS] [CrossRef] (In the text)
- Silvotti, R., Schuh, S., & Janulis, R. 2007, Nature, 449, 189 [NASA ADS] [CrossRef]
- Soker, N. 2006, PASP, 118, 260 [NASA ADS] [CrossRef] (In the text)
- Soria-Ruiz, R., Alcolea, J., Colomer, F., Bujarrabal, V., & Desmurs, J.-F. 2007, A&A, 468, L1 [NASA ADS] [CrossRef] [EDP Sciences] (In the text)
- Struck, C., Cohanim, B. E., & Willson, L. A. 2004, MNRAS, 347, 173 [NASA ADS] [CrossRef] (In the text)
- Struck, C., Cohanim, B. E., & Willson, L. A. 2002, ApJ, 572, L83 [NASA ADS] [CrossRef] (In the text)
- Struck-Marcell, C. 1988, ApJ, 330, 986 [NASA ADS] [CrossRef] (In the text)
- Sturrock, P. A. 1994, Plasma Physics, An Introduction to the Theory of Astrophysical, Geophysical and Laboratory Plasmas (Cambridge University Press) (In the text)
- Tatebe, K., Chandler, A. A., Hale, D. D. S., & Townes, C. H. 2006, ApJ, 652, 666 [NASA ADS] [CrossRef] (In the text)
- Thum, C., Wiesemeyer, H., Paubert, G., Navarro, S., & Morris, D. 2008, PASP, 120, 777 [NASA ADS] [CrossRef] (In the text)
- Villaver, E., & Livio, M. 2007, ApJ, 661, 1192 [NASA ADS] [CrossRef] (In the text)
- Vlemmings, W. H. T., Diamond, P. J., & van Langevelde, H. J. 2002, A&A, 394, 589 [NASA ADS] [CrossRef] [EDP Sciences] (In the text)
- Watson, W. D., & Wyld, H. W. 2001, ApJ, 558, L55 [NASA ADS] [CrossRef] (In the text)
- Western, L. R., & Watson, W. D. 1983, ApJ, 275, 195 [NASA ADS] [CrossRef] (In the text)
- Wiebe, D. S., & Watson, W. D. 1998, ApJ, 503, L71 [NASA ADS] [CrossRef] (In the text)
- Wiesemeyer, H. 2008, A&A, accepted [arXiv:0809.0214] (In the text)
- Wilson, R. E. 1953, Carnegie Institute Washington D.C. Publication, 0 (In the text)
- Zahn, J.-P. 1977, A&A, 57, 383 [NASA ADS] (In the text)
- Zweibel, E. G. 1989, ApJ, 340, 550 [NASA ADS] [CrossRef] (In the text)
Footnotes
- ...
![[*]](/icons/foot_motif.png)
- On leave to Instituto de Radioastronomía Milimétrica, Granada, Spain.
- ... software
- GILDAS collection, see http://www.iram.fr/IRAMFR/GILDAS
All Tables
Table 1: Observational results.
All Figures
| |
Figure 1: Spectra of total power (Stokes I, i.e. polarized plus unpolarized flux density) and of fractional circular polarization. Grey-shaded histogram: Stokes I flux density in Jansky vs. (the radial velocity with respect to the local standard of rest). Dots with errorbars: fractional circular polarization , in % with respect to Stokes I. Left: Mira-type star V Cam. Right: Mira-type star R Leo. |
| Open with DEXTER | |
| In the text | |
| |
Figure 2:
Time series of polarization measurements. From top to bottom: Stokes I in Jansky, the fractional polarizations (linear) and ¸ (circular), and the polarization angle (i.e. the position angle of linear polarization, in degree E from N), for the SiO maser spots from V Cam at = 7.5 km s-1 ( left) and R Leo at = 4.4 km s-1 ( right). The continuous heavy lines in the plots for ¸ show model results (Wiesemeyer 2008) for a saturated maser in the equatorial plane, at
|
| Open with DEXTER | |
| In the text | |
| |
Figure 3: Lomb periodograms of the polarization time series (estimates of the spectral power density by least-square fits of their harmonic contents, Lomb 1976), normalized by the variance of the samples. Top left: lomb periodogram of ¸ from V Cam at = 7.5 km s-1. Top right: same for the residuals of Stokes U (normalized by Stokes I, after subtraction of the stationary linear polarization). Bottom left and right: as top panels, but for R Leo at =4.4 km s-1. The horizontal dashed lines indicate the spectral power density at which a periodic signal can be mimicked by Gaussian noise with a probability given by the labels (''false alarm probability''). For a given source, the plot scale for the Lomb periodograms of ¸ and the Stokes U residuals is the same, to make the comparison of the significance of the peaks easier. |
| Open with DEXTER | |
| In the text | |
| |
Figure 4: Same as Fig. 2, but for R Leo at three selected velocities (observations from 2008 August 1). Left: =-2.8 km s-1. Middle: =0.6 km s-1. Right: =-5.3 km s-1. |
| Open with DEXTER | |
| In the text | |
| |
Figure 5:
Top: Keplerian velocity fit of maser features associated with the suggested planet (LSR velocities at the tip of the planetary wake flow, and velocities of polarization fluctuations). Time is in years since 2001 Aug. 4 (observations of Cotton et al. 2004). Other references: Soria-Ruiz et al. (2007, 2002 Dec. 7), (Cotton et al. 2008, 2004 Sep. 5), this work (2006 May 22 and 2008 Aug. 1). Bottom: available astrometric information and least-square fit of the derived planetary orbit (Appendix A), for d=113.5 pc stellar distance. VLBI positions are indicated by black dots. The planetary orbit is indicated by the black line, crosses mark the fitted position at the VLBI epochs. Empty circles give the positions of the planet at the epochs of our polarization measurements. The linear polarizations measured by us and their position angles are shown as bars (the bar in the top left corner indicates a fractional linear polarization of 30%). The grey-shaded disk indicates the measured |
| Open with DEXTER | |
| In the text | |
| |
Figure A.1:
Definition of the orbital parameters. The xyz coordinate system is shown by
solid arrows (the yz plane, i.e. the drawing plane, is the plane of the sky), the
|
| Open with DEXTER | |
| In the text | |
Copyright ESO 2009
Current usage metrics show cumulative count of Article Views (full-text article views including HTML views, PDF and ePub downloads, according to the available data) and Abstracts Views on Vision4Press platform.
Data correspond to usage on the plateform after 2015. The current usage metrics is available 48-96 hours after online publication and is updated daily on week days.
Initial download of the metrics may take a while.