| Issue |
A&A
Volume 498, Number 2, May I 2009
|
|
|---|---|---|
| Page(s) | 445 - 453 | |
| Section | Interstellar and circumstellar matter | |
| DOI | https://doi.org/10.1051/0004-6361/200811292 | |
| Published online | 11 March 2009 | |
A molecular outflow revealing star formation activity in the vicinity of the HII region G034.8-0.7 and the SNR W44
S. Paron1 - M. E. Ortega1 - M. Rubio2 - G. Dubner1
1 - Instituto de Astronomía y Física del Espacio (IAFE),
CC 67, Suc. 28, 1428 Buenos Aires, Argentina
2 - Departamento de Astronomía, Universidad de Chile, Casilla 36-D,
Santiago, Chile
Received 4 November 2008 / Accepted 6 February 2009
Abstract
Aims. This work aims at investigating the molecular gas component in the vicinity of two young stellar object (YSO) candidates identified at the border of the HII region G034.8-0.7 that is evolving within a molecular cloud shocked by the SNR W44. The purpose is to explore signatures of star forming activity in this complex region.
Methods. We performed a near and mid infrared study towards the border of the HII region G034.8-0.7 and observed a
![]() region near 18
region near 18![]() 56
56![]() 48
48![]() ,
+01
,
+01![]() 18
18![]() 45
45
![]() (J2000) using the Atacama Submillimeter Telescope Experiment (ASTE) in the 12CO J=3-2, 13CO J=3-2, HCO+ J=4-3 and CS J=7-6 lines with an angular resolution of 22
(J2000) using the Atacama Submillimeter Telescope Experiment (ASTE) in the 12CO J=3-2, 13CO J=3-2, HCO+ J=4-3 and CS J=7-6 lines with an angular resolution of 22
![]() .
.
Results. Based on the infrared study we propose that the source 2MASS 18564827+0118471 (IR1 in this work) is a YSO candidate. We discovered a bipolar 12CO outflow in the direction of the line of sight and a HCO+ clump towards IR1, confirming that it is a YSO. From the detection of the CS J=7-6 line we infer the presence of high density (>107 cm-3) and warm (>60 K) gas towards IR1, probably belonging to the protostellar envelope where the YSO is forming. We investigated the possible connection of IR1 with the SNR and the HII region. By comparing the dynamical time of the outflows and the age of the SNR W44, we conclude that the possibility that the SNR triggered the formation of IR1 is unlikely. On the other hand, we suggest that the expansion of the HII region G034.8-0.7 is responsible for the formation of IR1 through the ``collect and collapse'' process.
Conclusions.
1 Introduction
The formation of stars occurs deep inside molecular clouds. In the standard scenario for the formation of an isolated low-mass star, a cold core contracts as magnetic and turbulent support are lost and subsequently collapses to form a protostar with a surrounding disk. Then, a stellar wind breaks out along the rotational axis of the system and drives a bipolar outflow, which gradually disperses the protostellar envelope revealing a pre-main sequence star with a disk (van Dishoeck & Jørgensen 2008).
Several authors have studied the role of supersonic turbulence in star forming processes (e.g. Mac Low & Klessen 2004). They suggest that when stars form the process is quick and dynamic, with gravitational collapse occurring at a rate controlled by supersonic turbulence. The balance between turbulence and gravity provides a natural explanation for the widely varying star formation rates seen on both cloud and galactic scales.
As the largest contribution to interstellar turbulence comes from supernova explosions, it is thought that the dominant driving mechanism in star-forming regions of galaxies, appears to be supernovae, while elsewhere coupling of rotation to the gas through magnetic fields or gravity may be important (Mac Low & Klessen 2004).
Since the early suggestion made by Opik (1953), several numerical studies (e.g. Melioli et al. 2006; Vanhala & Cameron 1998)
proposed that supernova remnants (SNRs) can initiate the formation of new generations of stars. However,
observational evidence of star formation triggered by SNRs is still scarce.
The bright SNR W44 and the environment in which it is evolving is a good target to explore this possibility.
W44 is one of the few demonstrated cases of an SNR-molecular cloud interacting system. Seta et al. (1998)
discovered six giant molecular clouds that appear to be partially surrounding the remnant. Later, Seta et al. (2004)
proved that some of these clouds (at
![]() km s-1)
are physically interacting with the remnant on its southeastern side. The
CO spectra corresponding to these
molecular structures present wing emission that, as
the authors conclude, unambiguously confirm the interaction between W44 and the molecular gas.
The physical interaction of the blast wave with a clumpy interstellar medium is also supported by the detection
of bright OH (1720 MHz) masers at LSR velocities approximately between 43 and
47 km s-1 (Hoffman et al. 2005,
and references therein) and shocked H2 emission observed with Spitzer-IRAC (Reach et al. 2006).
Many infrared sources are embedded in the portion of the giant molecular cloud that is being shocked by the SNR.
In particular IRAS 18542+0114, an IRAS point source
that coincides with the border of the HII region G034.8-0.7 (Ortega et al. 2007; Kuchar & Clark 1997) appears immersed in a region of
shocked molecular gas interior to the SNR shell as seen in projection.
Figure 1 shows the molecular cloud
in the 13CO J=1-0 line (as extracted from the GRS
km s-1)
are physically interacting with the remnant on its southeastern side. The
CO spectra corresponding to these
molecular structures present wing emission that, as
the authors conclude, unambiguously confirm the interaction between W44 and the molecular gas.
The physical interaction of the blast wave with a clumpy interstellar medium is also supported by the detection
of bright OH (1720 MHz) masers at LSR velocities approximately between 43 and
47 km s-1 (Hoffman et al. 2005,
and references therein) and shocked H2 emission observed with Spitzer-IRAC (Reach et al. 2006).
Many infrared sources are embedded in the portion of the giant molecular cloud that is being shocked by the SNR.
In particular IRAS 18542+0114, an IRAS point source
that coincides with the border of the HII region G034.8-0.7 (Ortega et al. 2007; Kuchar & Clark 1997) appears immersed in a region of
shocked molecular gas interior to the SNR shell as seen in projection.
Figure 1 shows the molecular cloud
in the 13CO J=1-0 line (as extracted from the GRS![]() ) from the average between 40 and 50 km s-1, the velocity
range where the molecular cloud peaks, and also in coincidence with the systemic velocity of W44.
The radio continuum of
the SNR and the HII region at 20 cm as extracted from the MAGPIS (Helfand et al. 2006) are depicted in thick blue
contours.
) from the average between 40 and 50 km s-1, the velocity
range where the molecular cloud peaks, and also in coincidence with the systemic velocity of W44.
The radio continuum of
the SNR and the HII region at 20 cm as extracted from the MAGPIS (Helfand et al. 2006) are depicted in thick blue
contours.
The distance to W44 and the shocked
molecular cloud was estimated to be ![]() 3 kpc (Caswell et al. 1975; Seta et al. 2004; Radhakrishnan et al. 1972). Taking into
account the recombination line velocity of
3 kpc (Caswell et al. 1975; Seta et al. 2004; Radhakrishnan et al. 1972). Taking into
account the recombination line velocity of
![]() km s-1 derived by Lockman (1989) and the HI absorption
study performed by Ortega et al. (2007), the same distance as the SNR is suggested for the HII region G034.8-0.7.
In what follows we adopt 3 kpc as the distance for the SNR W44, the giant molecular cloud GMC G34.8-0.6 and
the HII region G034.8-0.7.
km s-1 derived by Lockman (1989) and the HI absorption
study performed by Ortega et al. (2007), the same distance as the SNR is suggested for the HII region G034.8-0.7.
In what follows we adopt 3 kpc as the distance for the SNR W44, the giant molecular cloud GMC G34.8-0.6 and
the HII region G034.8-0.7.
IRAS 18542+0114 (cross in Fig. 1) is resolved into several sources in the Two Micron All-Sky Point Source Catalog (2MASS, Cutri et al. 2003), and according to color criteria (see Sect. 3.1) some of them are young stellar object (YSO) candidates.
![\begin{figure}
\par\includegraphics[width=7cm]{1292fig1.ps}
\end{figure}](/articles/aa/full_html/2009/17/aa11292-08/img18.gif) |
Figure 1: 13CO J=1-0 line averaged between 40 and 50 km s-1 showing the giant molecular cloud GMC G34.8-0.6. The thick blue contours outline the radio continuum emission of the SNR W44 and the HII region G034.8-0.7 at 20 cm. The cross shows the position of IRAS 18542+0114. |
| Open with DEXTER | |
Thus, the scenario is that there are YSO candidates within a shocked molecular cloud located in a region peripheric to a SNR and simultaneously on the border of an expanding HII region.
In this work we present a near and mid infrared study and molecular observations in the 12CO and 13CO J=3-2, HCO+ J=4-3 and CS J=7-6 lines towards IRAS 18542+0114 carried out with the purpose of exploring the star forming activity in the region and its connection with the local SNR and the HII region.
2 Observations
The molecular observations were performed on June 25, 2008 with the 10 m Atacama Submillimeter Telescope Experiment (ASTE,
Ezawa et al. 2004). We used the CATS345 GHz band receiver, which is a two-single band SIS receiver remotely tunable
in the LO frequency range of 324-372 GHz. We simultaneously observed 12CO J=3-2 at 345.796 GHz and HCO+ J=4-3 at
356.734 GHz, mapping a region of 90
![]()
![]() 90
90
![]() centered at the position of IRAS 18542+0114
(RA = 18
centered at the position of IRAS 18542+0114
(RA = 18![]() 56
56![]() 47.8
47.8![]() ,
dec. = +01
,
dec. = +01![]() 18
18![]() 45
45
![]() ,
J2000). The mapping grid spacing was 10
,
J2000). The mapping grid spacing was 10
![]() and the integration
time was 72 s. per pointing. Additionally we observed 13CO J=3-2 at
330.588 GHz and CS J=7-6 at
342.883 GHz
towards the centre of the region. All the observations were performed in position switching mode. The off position
was RA = 18
and the integration
time was 72 s. per pointing. Additionally we observed 13CO J=3-2 at
330.588 GHz and CS J=7-6 at
342.883 GHz
towards the centre of the region. All the observations were performed in position switching mode. The off position
was RA = 18![]() 55
55![]() 30
30![]() ,
dec. = +01
,
dec. = +01![]() 39
39![]() 55
55
![]() (J2000) that was checked to be free of emission.
(J2000) that was checked to be free of emission.
We used the XF digital spectrometer with a bandwidth and spectral resolution set to 128 MHz and 125 kHz, respectively.
The velocity resolution was 0.11 km s-1 and the half-power beamwidth (HPBW) was 22
![]() at 345 GHz. The system temperature
varied from
at 345 GHz. The system temperature
varied from
![]() to 700 K. The typical rms noise (in units of
to 700 K. The typical rms noise (in units of
![]() )
ranged between 0.1 and 0.4 K and the main beam efficiency was
)
ranged between 0.1 and 0.4 K and the main beam efficiency was
![]() .
.
The spectra were Hanning smoothed to improve the signal-to-noise ratio and only linear or/and some third order polynomia were used for baseline fitting. The spectra were processed using the XSpec software package developed at the Onsala Space Observatory.
![\begin{figure}
\par\includegraphics[width=8.5cm]{1292fig2.ps}
\end{figure}](/articles/aa/full_html/2009/17/aa11292-08/img22.gif) |
Figure 2:
Spitzer-IRAC three color image (3.5 |
| Open with DEXTER | |
3 Results
3.1 Infrared emission
Figure 2 shows a Spitzer-IRAC three color image of a region about 22![]()
![]() 22
22![]() around
IRAS 18542+0114 as extracted from GLIMPSE (Fazio et al. 2004; Werner et al. 2004). The three
IR bands are 3.6
around
IRAS 18542+0114 as extracted from GLIMPSE (Fazio et al. 2004; Werner et al. 2004). The three
IR bands are 3.6 ![]() m
(in blue), 4.5
m
(in blue), 4.5 ![]() m (in green) and 8
m (in green) and 8 ![]() m (in red). Contours of the radio continuum emission at 20 cm of
the SNR W44 and the HII region G034.8-0.7 are included.
m (in red). Contours of the radio continuum emission at 20 cm of
the SNR W44 and the HII region G034.8-0.7 are included.
The IRAC 4.5 ![]() m band contains both H2 (
m band contains both H2 (![]() -0, S(9, 10, 11)) lines and CO (
-0, S(9, 10, 11)) lines and CO (
![]() )
band heads.
As noticed by Cyganowski et al. (2008), all of these lines may be excited by shocks, such as those expected when protostellar
outflows crash into the ambient ISM. In Fig. 2 it can be noticed that IRAS 18542+0114
appears slightly extended in the 4.5
)
band heads.
As noticed by Cyganowski et al. (2008), all of these lines may be excited by shocks, such as those expected when protostellar
outflows crash into the ambient ISM. In Fig. 2 it can be noticed that IRAS 18542+0114
appears slightly extended in the 4.5 ![]() m emission (green), therefore suggesting that it may be a YSO outflow candidate.
It is important to note the difference between the emission from this YSO candidate
and from the gas shocked by the SNR, both seen in green. The first one is
bright and concentrated around IRAS 18542+0114, while the second one is seen as diffuse filaments.
From Fig. 2 the presence of an infrared dark cloud is also evident
(IRDC 34.776-0.554
as catalogued in the Glimpse Dark Cloud Catalog). IRAS 18542+0114 is seen in projection over a border of
this infrared dark cloud (IRDC). The IRDCs have been shown in recent years to be sites of the earliest stages
of star formation (Rathborne et al. 2006,2007).
m emission (green), therefore suggesting that it may be a YSO outflow candidate.
It is important to note the difference between the emission from this YSO candidate
and from the gas shocked by the SNR, both seen in green. The first one is
bright and concentrated around IRAS 18542+0114, while the second one is seen as diffuse filaments.
From Fig. 2 the presence of an infrared dark cloud is also evident
(IRDC 34.776-0.554
as catalogued in the Glimpse Dark Cloud Catalog). IRAS 18542+0114 is seen in projection over a border of
this infrared dark cloud (IRDC). The IRDCs have been shown in recent years to be sites of the earliest stages
of star formation (Rathborne et al. 2006,2007).
Figure 3 shows near infrared (NIR) JHK three-color image in a region of about 10![]()
![]() 10
10![]() that
contains IRDC 34.776-0.554 obtained from the 2MASS Survey (Skrutskie et al. 2006). The most reddened NIR sources are indicated with numbers. Among these sources is included the bright 2MASS 18564827+0118471,
the possible counterpart of IRAS 18542+0114.
that
contains IRDC 34.776-0.554 obtained from the 2MASS Survey (Skrutskie et al. 2006). The most reddened NIR sources are indicated with numbers. Among these sources is included the bright 2MASS 18564827+0118471,
the possible counterpart of IRAS 18542+0114.
![\begin{figure}
\par\includegraphics[width=6cm]{1292fig3.ps}
\end{figure}](/articles/aa/full_html/2009/17/aa11292-08/img25.gif) |
Figure 3: 2MASS JHK three-color image towards IRDC 34.776-0.554. The most reddened NIR sources are indicated with numbers. IRAS 18542+0114 is resolved into several 2MASS sources. The brightest and the most reddened one is 2MASS 18564827+0118471. |
| Open with DEXTER | |
To look for primary tracers of star formation activity in the
vicinity of the IRDC, we used the 2MASS All-Sky Point Source Catalogue
in bands J (1.25 ![]() m), H (1.65
m), H (1.65 ![]() m) and K (2.17
m) and K (2.17 ![]() m). We performed photometry
in the region shown in Fig. 3.
Figure 4 shows the (H-Ks) versus (J-H) color-color (CC) diagram.
We selected sources with
m). We performed photometry
in the region shown in Fig. 3.
Figure 4 shows the (H-Ks) versus (J-H) color-color (CC) diagram.
We selected sources with
![]() and with detection in at least two bands. The typical
color errors are about 5%.
Based on the above criteria we found 1029 sources in the mentioned region.
Following Hanson et al. (1997), we calculated for each source the parameter
and with detection in at least two bands. The typical
color errors are about 5%.
Based on the above criteria we found 1029 sources in the mentioned region.
Following Hanson et al. (1997), we calculated for each source the parameter
![]() ,
which determines the distance to the reddened vector.
YSO candidates, located at the Infrared Excess Sources region in Fig. 4, have
q-values less than -0.15. From this criterium we found 364 YSO candidates.
The most reddened sources shown in Fig. 4 as circled dots present
the best quality detection in the H and K bands. The numbers
correspond to the numbered sources in Fig. 3.
Their locations in the CC diagram indicate that they are likely YSOs,
where the NIR excess around protostars is due to the optically thick circumstellar disk/envelopes.
Figure 4 also shows two different groups of sources located between the parallel dashed lines. The
first one, close to the origin of the diagram corresponds to several blue sources which can be seen
in Fig. 3. They are
probably foreground stars not related to the IRDC, and as can be noticed in the
CC diagram
they are clustered near the main sequence curve with visual extinction values
from
,
which determines the distance to the reddened vector.
YSO candidates, located at the Infrared Excess Sources region in Fig. 4, have
q-values less than -0.15. From this criterium we found 364 YSO candidates.
The most reddened sources shown in Fig. 4 as circled dots present
the best quality detection in the H and K bands. The numbers
correspond to the numbered sources in Fig. 3.
Their locations in the CC diagram indicate that they are likely YSOs,
where the NIR excess around protostars is due to the optically thick circumstellar disk/envelopes.
Figure 4 also shows two different groups of sources located between the parallel dashed lines. The
first one, close to the origin of the diagram corresponds to several blue sources which can be seen
in Fig. 3. They are
probably foreground stars not related to the IRDC, and as can be noticed in the
CC diagram
they are clustered near the main sequence curve with visual extinction values
from
![]() to 8 mag. The second group is located between a visual extinction that
ranges from
to 8 mag. The second group is located between a visual extinction that
ranges from
![]() to 28 mag. Most of these sources correspond to background and
possible molecular cloud embedded main sequence stars.
to 28 mag. Most of these sources correspond to background and
possible molecular cloud embedded main sequence stars.
![\begin{figure}
\par\hspace*{3mm}\includegraphics[totalheight=0.24\textheight,viewport=0 0 660 450,clip]{1292fig4.eps}
\end{figure}](/articles/aa/full_html/2009/17/aa11292-08/img30.gif) |
Figure 4: Color-color diagram of the infrared sources in the vicinity of IRDC 34.776-0.554. The two solid curves represent the location of the main sequence (thin line) and the giant stars (thicker line) derived from Bessell & Brett (1988). The parallel dashed lines are reddening vectors with the crosses placed at intervals corresponding to five magnitudes of visual extinction. We have assumed the interstellar reddening law of Rieke & Lebofsky (1985) ( AJ/AV=0.282; AH/AV=0.175 and AK/AV=0.112). The plot is classified into three regions: cool giants, normally reddened stars and infrared excess sources. The most reddened sources are indicated as circled dots and the numbers correspond to the numbered sources of Fig. 3. |
| Open with DEXTER | |
![\begin{figure}
\par\includegraphics[width=9cm]{1292fig5.ps}
\end{figure}](/articles/aa/full_html/2009/17/aa11292-08/img31.gif) |
Figure 5:
IRAC 8 |
| Open with DEXTER | |
Figure 5 displays the spatial distribution of the most reddened sources mentioned above over
the IRAC 8 ![]() m band emission. The emission in this IR band clearly depicts the border of the HII region,
with the IR radiation mainly originating in
the policyclic aromatic hydrocarbons (PAHs). The figure also includes the contours of the radio continuum
emission of the SNR and the HII region and a box that indicates the region where the photometric
study was performed. From this figure, it is seen that the most reddened sources lie on the border of the
HII region that is seen
in projection interior to the SNR shell. The location of these sources delineates the border of
IRDC 34.776-0.554.
m band emission. The emission in this IR band clearly depicts the border of the HII region,
with the IR radiation mainly originating in
the policyclic aromatic hydrocarbons (PAHs). The figure also includes the contours of the radio continuum
emission of the SNR and the HII region and a box that indicates the region where the photometric
study was performed. From this figure, it is seen that the most reddened sources lie on the border of the
HII region that is seen
in projection interior to the SNR shell. The location of these sources delineates the border of
IRDC 34.776-0.554.
![\begin{figure}
\par\includegraphics[totalheight=0.25\textheight,viewport=0 0 660 480,clip]{1292fig6.eps}
\end{figure}](/articles/aa/full_html/2009/17/aa11292-08/img32.gif) |
Figure 6: GLIMPSE color-color diagram, [3.6]-[4.5] versus [5.8]-[8.0], for the most reddened sources from Fig. 3. Class I and Class II regions are indicated following Allen et al. (2004). The ellipse centered at 0, 0 encloses the region of main sequence and giant stars. |
| Open with DEXTER | |
Figure 6 shows the IRAC color-color diagram for the most reddened sources highlighted and numbered in Fig. 3. The regions that indicate the stellar evolutionary stages are based on the criteria presented by Allen et al. (2004). The sources IR1 and 8 are not included because they are not detected in some IRAC bands. Only source 7 lies in the region of protostars with circumstellar envelopes (Class I), the sources 2, 5, 6, 10 and 12 lie in the region of the main sequence and giant stars (Class III). No source occupies the region of young stars with only disk emission (Class II). However the sources 1, 3, 4, 9 and 11, located outside the delimited regions, could therefore be reddened Class II objets (Allen et al. 2004).
In particular, in a region of 90
![]()
![]() 90
90
![]() towards IRAS 18542+0114 (IR1), the region analyzed
in molecular lines (see next sections), the above 2MASS color criteria (Hanson et al. 1997) identifies two
sources: 2MASS 18564827+0118471, the most reddened source in the whole studied region (box in Fig. 5), and 2MASS 18564849+0118597, both indicated in the CC diagram (Fig. 4). In what follows
we analyze the molecular gas in this region.
towards IRAS 18542+0114 (IR1), the region analyzed
in molecular lines (see next sections), the above 2MASS color criteria (Hanson et al. 1997) identifies two
sources: 2MASS 18564827+0118471, the most reddened source in the whole studied region (box in Fig. 5), and 2MASS 18564849+0118597, both indicated in the CC diagram (Fig. 4). In what follows
we analyze the molecular gas in this region.
3.2 Molecular emission
3.2.1 HCO+ J = 4-3
Figure 7 shows a 90
![]()
![]() 90
90
![]() map obtained towards the infrared source IRAS 18542+0114 in the
HCO+ J=4-3 line integrated between 40 and 50 km s-1. As noticed above, in this region there are
two 2MASS sources, YSO candidates:
2MASS 18564827+0118471 (source 1 in Fig. 7, hereafter IR1) and 2MASS 18564849+0118597
(source 2 in Fig. 7, hereafter IR2).
map obtained towards the infrared source IRAS 18542+0114 in the
HCO+ J=4-3 line integrated between 40 and 50 km s-1. As noticed above, in this region there are
two 2MASS sources, YSO candidates:
2MASS 18564827+0118471 (source 1 in Fig. 7, hereafter IR1) and 2MASS 18564849+0118597
(source 2 in Fig. 7, hereafter IR2).
![\begin{figure}
\par\includegraphics[width=8.8cm]{1292fig7.ps}
\end{figure}](/articles/aa/full_html/2009/17/aa11292-08/img33.gif) |
Figure 7:
HCO+ J=4-3 emission integrated between 40 and 50 km s-1 towards the infrared source IRAS 18542+0114. The
contours levels are 3.5, 5, 7, 9 and 11 K km s-1. The crosses indicate the positions of the 2MASS point sources that
according to the color criteria described in the text could be YSOs. The angular resolution is |
| Open with DEXTER | |
In Fig. 7 a dense HCO+ clump is evident with IR1 exactly lying over
the HCO+ maximum and IR2 towards a border of the clump. By assuming as the limit of the
HCO+ J=4-3 structure the 3.5 K km s-1 contour (![]() times above the noise level), we can estimate a radius
of
times above the noise level), we can estimate a radius
of ![]() 25
25
![]() for this clump, 0.36 pc at the adopted distance of 3 kpc.
for this clump, 0.36 pc at the adopted distance of 3 kpc.
Figure 8 shows an HCO+ J=4-3 spectrum obtained from the average over the whole observed feature.
From these observations we derived line parameters of the HCO+ J=4-3 that are presented in Table 1.
The average main-beam brightness
temperature
![]() ,
center line velocity, line width (FWHP), the average integrated
HCO+ intensity
,
center line velocity, line width (FWHP), the average integrated
HCO+ intensity
![]() and the radius, are given in Cols. 1 to 5, respectively.
Errors are formal 1
and the radius, are given in Cols. 1 to 5, respectively.
Errors are formal 1![]() value for the model of the Gaussian line shape.
value for the model of the Gaussian line shape.
![\begin{figure}
\par\includegraphics[angle=-90,width=8.5cm,clip]{1292fig8.ps}
\end{figure}](/articles/aa/full_html/2009/17/aa11292-08/img38.gif) |
Figure 8:
HCO+ J=4-3 average profile of the region where emission is detected. The rms noise is
|
| Open with DEXTER | |
The HCO+ J=4-3 profile presented in Fig. 8
presents a dip at ![]() km s-1, the central velocity of the whole molecular complex. Only the profiles
towards the center of the clump, that is, towards IR1, clearly display this feature (see Fig. 9).
Such a dip can be interpreted as a self-absorption effect caused by less excited gas.
As Hiramatsu et al. (2007) propose, this kind of spectral feature may indicate a significant population of the
J = 3 level in the outer gas, that requires a moderately high density
but with lower J=4-3 excitation temperature than in the center of the clump. Such an effect might be revealing
the existence of a density gradient in the clump.
km s-1, the central velocity of the whole molecular complex. Only the profiles
towards the center of the clump, that is, towards IR1, clearly display this feature (see Fig. 9).
Such a dip can be interpreted as a self-absorption effect caused by less excited gas.
As Hiramatsu et al. (2007) propose, this kind of spectral feature may indicate a significant population of the
J = 3 level in the outer gas, that requires a moderately high density
but with lower J=4-3 excitation temperature than in the center of the clump. Such an effect might be revealing
the existence of a density gradient in the clump.
We have also analyzed the existence of a possible blue asymmetry which would be evidence of infalling gas towards a protostar (Zhou 1992; Leung & Brown 1977). In the star formation model of an infalling envelope, the blueshifted component is stronger than the redshifted one. This is due to the fact that the redshifted component is absorbed by the cooler infalling gas in the near half of the envelope along the line of sight. We did not find such an asymmetry in our spectra. However, as discussed by Gregersen et al. (2000,1997), the blue asymmetry line profiles do not appear in any of the known YSOs. One reason could be that if a redshifted outflow exists in the telescope beam, the redshifted components absorbed by the infalling envelope would be compensated.
Table 1: Molecular clump parameters from the HCO+ J=4-3emission.
![\begin{figure}
\par\includegraphics[width=8cm]{1292fig9.ps}
\end{figure}](/articles/aa/full_html/2009/17/aa11292-08/img44.gif) |
Figure 9:
HCO+ J=4-3 spectra obtained towards IR1, whose offset position is approximately (10
|
| Open with DEXTER | |
3.2.2 12CO J = 3-2
Analyzing the 12CO J=3-2 data we find that the profiles towards IR1 are remarkably broader than those towards the border of the surveyed region. For comparison Fig. 10 shows two spectra: the upper one, obtained towards the center of the region and the bottom one towards the edge of the map. Such phenomena can be interpreted as evidence of an outflow observed along the line of sight driven by the source IR1. In effect, the blue component extends from 27 to 37 km s-1 while the red component goes from 50 to 63 km s-1. Figure 11 displays the 12CO J=3-2 emission integrated in both velocity ranges. The blue and red shifted components are presented in thin and thick contours, respectively. The crosses indicate the positions of the 2MASS sources IR1 and IR2.
![\begin{figure}
\par\includegraphics[angle=-90,width=6cm]{1292fi10.eps}
\end{figure}](/articles/aa/full_html/2009/17/aa11292-08/img45.gif) |
Figure 10:
12CO J=3-2 spectra. Upper: spectrum towards the center of the observed region. Bottom: spectrum
towards the edge of the region. The borders between outflow and line core are shown with two vertical lines.
The rms noise is
|
| Open with DEXTER | |
The 12CO J=3-2 line almost always appears self-absorbed
towards star-forming regions and often reveals information on the gas kinematics (Johnstone et al. 2003).
Inspecting our data, most of the 12CO profiles in the region have a dip at
![]() km s-1.
This velocity is very close to the peak velocity of the 13CO J=3-2 line (see Sect. 3.2.3),
which is an optically thinner line. Such correspondence strongly suggests that the dip in the 12CO profiles is indeed caused
by self-absorption by less excited gas (see e.g. Zhou et al. 1993). Thus we can discard the possibility of
two 12CO emission components with different velocities along the line of sight.
km s-1.
This velocity is very close to the peak velocity of the 13CO J=3-2 line (see Sect. 3.2.3),
which is an optically thinner line. Such correspondence strongly suggests that the dip in the 12CO profiles is indeed caused
by self-absorption by less excited gas (see e.g. Zhou et al. 1993). Thus we can discard the possibility of
two 12CO emission components with different velocities along the line of sight.
![\begin{figure}
\par\includegraphics[width=7.6cm,clip]{1292fi11.ps}
\end{figure}](/articles/aa/full_html/2009/17/aa11292-08/img47.gif) |
Figure 11: The thin contours represents the 12CO J=3-2 emission integrated between 27 and 37 km s-1 (blueshifted component). The contour levels are 5, 10, 15 and 20 K km s-1. The thick contours show the 12CO J=3-2 emission integrated between 50 to 63 km s-1 (redshifted component) and the levels are 10, 15, 20 and 25 K km s-1. The crosses indicate the positions of the 2MASS sources IR1 and IR2. |
| Open with DEXTER | |
Figure 12 (left) displays the 12CO position-velocity diagram along a line
at constant Right Ascension (18![]() 56
56![]() 48
48![]() ), while Fig. 12 (right) shows the same diagram along a line
at constant Declination (+01
), while Fig. 12 (right) shows the same diagram along a line
at constant Declination (+01![]() 18
18![]() 45
45
![]() ). Redshifted and blueshifted features extending in velocity
are clearly evident in both images.
). Redshifted and blueshifted features extending in velocity
are clearly evident in both images.
| |
Figure 12:
12CO position-velocity diagrams. Left: along a line at constant
RA = 18 |
| Open with DEXTER | |
Based on these observational results we can confirm that
we are observing gas outflows originating in the source IR1.
These results together with the above noticed slightly extended emission in the IRAC 4.5 ![]() m
band (indicative of gas shocked by outflows) and its position in the infrared color-color diagram (see Sect. 3.1),
confirm that IR1 is a YSO.
In Fig. 13 we present a three dimensional picture of the HCO+ structure and the outflows mapped by the 12CO.
The figure shows the 12CO and the HCO+ data as isosurfaces
of intensity. The vertical axis corresponds to the velocity while the horizontal axes represent the spatial coordinates.
The feature at
m
band (indicative of gas shocked by outflows) and its position in the infrared color-color diagram (see Sect. 3.1),
confirm that IR1 is a YSO.
In Fig. 13 we present a three dimensional picture of the HCO+ structure and the outflows mapped by the 12CO.
The figure shows the 12CO and the HCO+ data as isosurfaces
of intensity. The vertical axis corresponds to the velocity while the horizontal axes represent the spatial coordinates.
The feature at
![]() km s-1 is the HCO+ emission at 0.7 K. The extended features in velocity are the
12CO emission at 1.8 K, which clearly show the outflow structure.
km s-1 is the HCO+ emission at 0.7 K. The extended features in velocity are the
12CO emission at 1.8 K, which clearly show the outflow structure.
![\begin{figure}
\par\includegraphics[width=5.6cm,clip]{1292fi13.eps}
\end{figure}](/articles/aa/full_html/2009/17/aa11292-08/img50.gif) |
Figure 13:
Three dimensional picture showing isosurfaces of intensity. The
feature between |
| Open with DEXTER | |
3.2.3 13CO J = 3-2 and CS J = 7-6
Figure 14 displays the profiles of the 13CO J = 3-2 and CS J = 7-6 emission, left and right, respectively,
obtained towards the center of the studied region (RA = 18![]() 56
56![]() 47.8
47.8![]() ,
dec. = +01
,
dec. = +01![]() 18
18![]() 45
45
![]() ,
J2000).
The parameters determined from Gaussian fitting of these lines are presented in Table 2.
,
J2000).
The parameters determined from Gaussian fitting of these lines are presented in Table 2.
![]() represents the peak brightness temperature,
represents the peak brightness temperature,
![]() the central velocity,
the central velocity,
![]() the line width and I the integrated line intensity. Errors are formal 1
the line width and I the integrated line intensity. Errors are formal 1![]() values for the model
of a Gaussian line shape.
values for the model
of a Gaussian line shape.
| |
Figure 14:
13CO J=3-2 profile ( left) and CS J=7-6 profile ( right) obtained towards RA = 18 |
| Open with DEXTER | |
We have calculated the ratio of the integrated line intensities between the 13CO J=3-2 and J=1-0 lines
(
13 R3-2/1-0).
The latter was extracted from the GRS (Jackson et al. 2006) and the J=3-2 line was convolved to the J=1-0 beam.
We obtain
![]() .
.
In order to compare the 13CO J=3-2 with the 12CO
J=3-2 to obtain an isotopic ratio between peak temperatures for the different velocity components,
we fit the 13CO J=3-2 spectrum with three Gaussians.
We use the Gaussians with lower and higher velocities, closer to the blueshifted and redshifted components, respectively,
as seen in the 12CO emission (see Fig. 10). Thus we obtain the following peak temperature ratios:
![]() and
and
![]() for the emissions close to the blueshifted and
redshifted components, respectively. From these ratios we derive the optical depths for each line.
For this region of the Galaxy, according to Milam et al. (2005), we use an isotopic abundance
ratio of [12CO]/[13CO]
for the emissions close to the blueshifted and
redshifted components, respectively. From these ratios we derive the optical depths for each line.
For this region of the Galaxy, according to Milam et al. (2005), we use an isotopic abundance
ratio of [12CO]/[13CO] ![]() 70. Assuming an excitation temperature of
70. Assuming an excitation temperature of
![]() K for both lines,
we derive the following optical depths:
K for both lines,
we derive the following optical depths:
![]() and
and
![]() for the emission close to the blueshifted component
and
for the emission close to the blueshifted component
and
![]() and
and
![]() for the emission close to the redshifted one.
for the emission close to the redshifted one.
Table 2:
Observed parameters of the 13CO J=3-2 and CS J=7-6 emissions towards
RA = 18![]() 56
56![]() 47.8
47.8![]() ,
dec. = +01
,
dec. = +01![]() 18
18![]() 45
45
![]() (J2000).
(J2000).
Table 3: Outflows parameters.
3.3 Kinematics and dynamics of the outflows
In this section we investigate the physical parameters of the discovered outflows.
To carry out these calculations we applied the relations from Choi et al. (1993).
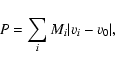
The CO column density (
![]() )
and the mass (Mi) for each channel are
calculated from:
)
and the mass (Mi) for each channel are
calculated from:
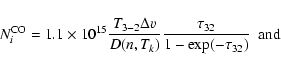
![\begin{displaymath}M_{i} = \mu {\rm m}_{H_{2}} {\rm d}^{2} \Omega N_{i}^{\rm CO} \frac{{\rm [H]}}{{\rm [C]}} \frac{{\rm [C]}}{{\rm [CO]}},\end{displaymath}](/articles/aa/full_html/2009/17/aa11292-08/img71.gif)
where
T3-2 is the peak temperature of the 12CO J=3-2 line,

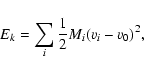
where v0 is the systemic velocity,
4 Discussion
From the 2MASS data study we found that the sources with the highest NIR excess lie on the border
of the HII region G034.8-0.7 and around the dark cloud IRDC 34.776-0.554, a scenario that strongly suggests
active star formation. The source 2MASS 18564827+0118471 (IR1 in this paper) is the most reddened source in the NIR
and is also bright and slightly extended in the IRAC 4.5 ![]() m band. This latter emission,
which contains H2 and CO vibrational lines, can be produced when protostellar outflows crash
into the ambient ISM, suggesting that IR1 could be a YSO.
m band. This latter emission,
which contains H2 and CO vibrational lines, can be produced when protostellar outflows crash
into the ambient ISM, suggesting that IR1 could be a YSO.
Our molecular observations have revealed the existence of a HCO+ clump where IR1 is embedded. It is known that such molecular species is enhanced in molecular outflows (Rawlings et al. 2004). In effect, a strong enhancement of the HCO+ abundance is expected to occur in the boundary layer between the outflow jet and the surrounding molecular core. This would be due to the liberation and photoprocessing by the shock of the molecular material stored in the icy mantles of the dust. Indeed, through the 12CO J=3-2 line we discovered the presence of outflows extended along the line of sight related to the HCO+ clump and IR1. In this context, we conclude that the source IR1 is a YSO driving bipolar outflows which are enhancing the abundance of HCO+.
The obtained outflow masses are similar to those obtained
for the outflows of the source IRS6, a low-mass YSO in Cederblad 110 (Hiramatsu et al. 2007).
We compared the derived parameters for the outflows (see Table 3) with those of
the statistical study carried out by Wu et al. (2004)
based on the properties of a sample of about 391 molecular outflows. In that work the sources
were divided into outflows with low mass and outflows with high mass according to either the available bolometric
luminosity of the central source or the outflow mass. Based on the compiled data the authors conclude
that the outflow phenomenon is common either in low and high mass star formation regions.
The red and blue outflow masses that we derived for IR1 are
slightly lower than the lowest masses discussed by Wu et al. (2004). Therefore,
IR1 would correspond to the ``low mass group'' as catalogued by them. It is important to remark that since
we made no corrections to the velocities for possible projection effects, the momenta and kinetic energies that
we derive are lower limits. Also, as Choi et al. (1993) note, these effects can increase (if the flow is in the plane of
the sky) or decrease (if the flow is along the line of sight) the timescale (
![]() in Table 3) by
substantial factors. In addition, this time would be shorter if we use the maximum velocity rather than
in Table 3) by
substantial factors. In addition, this time would be shorter if we use the maximum velocity rather than
![]() .
However our
.
However our
![]() values are very close to the average dynamical time of the ``low mass group'' presented in
Wu et al. (2004). Other physical parameters, like kinetic energy, momentum and driving force listed in
Table 3 also agree with those of the ``low mass group''. We can therefore conclude that we
are probably observing a source with outflows of low mass.
values are very close to the average dynamical time of the ``low mass group'' presented in
Wu et al. (2004). Other physical parameters, like kinetic energy, momentum and driving force listed in
Table 3 also agree with those of the ``low mass group''. We can therefore conclude that we
are probably observing a source with outflows of low mass.
One stage in the formation of a star is the main accretion phase. This is the phase during which
the central object builds up its mass from a surrounding infalling envelope and accretion disk. Observational
evidence shows that the main accretion phase is always accompanied by a powerful ejection of a small fraction of
the accreted material in the form of prominent bipolar outflows (e.g. Bachiller 1996; McKee & Ostriker 2007). Class 0protostars are considered the earlier stage of star formation with typical ages of
![]() years. Most of them, if not all, drive powerful ``jet-like'' CO molecular outflows, which
gradually disappear as the protostar goes into the following evolutionary stages. Thus, the dynamical times of
the outflows can be used as an approximation of the life time of YSOs. Therefore we suggest an age of a few
years. Most of them, if not all, drive powerful ``jet-like'' CO molecular outflows, which
gradually disappear as the protostar goes into the following evolutionary stages. Thus, the dynamical times of
the outflows can be used as an approximation of the life time of YSOs. Therefore we suggest an age of a few
![]() years for IR1.
years for IR1.
Additionally, we performed a Spectral Energy Distribution (SED) fit of IR1 near and mid IR fluxes extracted from
the 2MASS Point Source Catalog (J, H and K bands), from the Glimpse Catalog (Spitzer-IRAC bands) and
from the MSX Point Source Catalog (8.28, 12.13, 14.65 and 21.30 ![]() m bands).
Based on the SED models
m bands).
Based on the SED models![]() presented by Robitaille et al. (2007,2006) and considering a visual extinction between 15 and 30 mag (see Sect. 3.1),
we suggest that IR1 can be a high mass YSO of
presented by Robitaille et al. (2007,2006) and considering a visual extinction between 15 and 30 mag (see Sect. 3.1),
we suggest that IR1 can be a high mass YSO of ![]() 20
20 ![]() .
Besides,
the models predict an age between
.
Besides,
the models predict an age between
![]() and 105 years for this YSO, and a
circumstellar disk of 0.01
and 105 years for this YSO, and a
circumstellar disk of 0.01 ![]() with an accretion rate of
with an accretion rate of ![]() 10-6
10-6 ![]() yr-1.
The outflows and accretion rates presented in Table 3 and derived from the SED models, respectively,
are considerably lower than the typical rates of massive YSOs (10-4
yr-1.
The outflows and accretion rates presented in Table 3 and derived from the SED models, respectively,
are considerably lower than the typical rates of massive YSOs (10-4 ![]() yr-1 in both cases; McKee & Tan 2003).
As noticed above, IR1 presents a high NIR excess, which suggests that it is embedded
in a very dense envelope. Taking into account the YSO mass obtained from the SED models, the estimated ages
and the mentioned outflow and accretion rates for IR1, we suggest that this source is probably a massive YSO that
could be near the end of the accretion process and has not ionized and dissipated its envelope yet.
yr-1 in both cases; McKee & Tan 2003).
As noticed above, IR1 presents a high NIR excess, which suggests that it is embedded
in a very dense envelope. Taking into account the YSO mass obtained from the SED models, the estimated ages
and the mentioned outflow and accretion rates for IR1, we suggest that this source is probably a massive YSO that
could be near the end of the accretion process and has not ionized and dissipated its envelope yet.
The integrated line 13CO 3-2/1-0 ratio (
13 R3-2/1-0) obtained towards the center of the region is very
similar to that obtained towards a circumstellar disk around a pre-main sequence star by van Zadelhoff et al. (2001). As the
authors remark, the 13
R3-2/1-0 could indicate temperatures of ![]() 20-40 K.
However, care should be taken with the interpretation of this result since the emission of the two lines most
likely comes from different regions of the disk due to the difference in optical depth of the
two lines.
20-40 K.
However, care should be taken with the interpretation of this result since the emission of the two lines most
likely comes from different regions of the disk due to the difference in optical depth of the
two lines.
The sulphur-bearing species, like the CS, have been associated with shocks and/or outflows. However it is still debatable whether sulphur-bearing species are good diagnostics of outflows (Johnstone et al. 2003). According to Moriarty-Schieven et al. (1995), the CS J=7-6 line traces high densities (>107 cm-3) and warm temperatures (>60 K) in the protostellar envelopes. Thus, we propose that the detection of this transition indicates the presence of dense and warm gas, showing the inner denser and warmer part of the protostellar envelope where IR1 is forming.
4.1 Could the SNR W44 or the HII region G034.8-0.7 have triggered the formation of IR1?
From our molecular results and the IR emission study, we conclude that IR1 is indeed a YSO. As it lies on the border of the HII region G034.8-0.7, which is in turn evolving in a molecular cloud shocked by the SNR W44, we investigate their relatedness.
According to the derived outflow dynamical times (see Table 3) and to the SED age estimate,
IR1 might be a YSO with an age
of a few
![]() or maybe
or maybe
![]() years. Based on the age of the associated
pulsar, Wolszczan et al. (1991) estimated an age of about
years. Based on the age of the associated
pulsar, Wolszczan et al. (1991) estimated an age of about
![]() years for the
SNR W44. Taking into account
that the ages of IR1 and W44 are comparable and that a delay between the main triggering agent and the subsequent
star formation is expected, it is unlikely that the SNR triggered the formation of IR1.
years for the
SNR W44. Taking into account
that the ages of IR1 and W44 are comparable and that a delay between the main triggering agent and the subsequent
star formation is expected, it is unlikely that the SNR triggered the formation of IR1.
On the other hand, as mentioned above, IR1 is seen in the plane of the sky overlapping
the photodissociation region (PDR) associated with the HII region G034.8-0.7, located
at the same distance as W44 (Ortega et al. 2007).
In the literature there are many works about star formation triggered by the expansion of HII regions
(e.g. Deharveng et al. 2003; Comerón et al. 2005; Zavagno et al. 2006; Elmegreen & Lada 1977; Deharveng et al. 2005). In what follows we investigate this possibility.
From the 12CO J=1-0 study performed by Seta et al. (2004), a dense molecular shell surrounding the HII region G034.8-0.7
is evident in the velocity range 35-40 km s-1, which suggests that in this region the ``collect and
collapse'' process can take place (Zavagno et al. 2006; Deharveng et al. 2005). In this process, the compressed shocked layer generated
in the inhomogeneous
medium by the expansion of the HII region may become gravitationally unstable along its surface on a long timescale.
The process produces massive fragments of material which allow the formation of massive stars and/or clusters.
According to Ortega et al. (2007), taking into account that the exciting star of the
HII region G034.8-0.7 should be of
spectral type between O9.5 and O3, the age of the HII region would be
105-
![]() years. These times are compatible with star forming processes in the associated PDR.
Besides, as noticed in Sect. 3.1, the most reddened sources in the analyzed region lie
preferentially on the border of the HII region that is seen in projection interior to the W44 shell.
We can therefore conclude that a scenario where the expansion of the HII region G034.8-0.7 has triggered
the formation of IR1 is more possible.
Careful modeling of this scenario, including the actions of the HII region and the SNR,
is planned for the near future.
years. These times are compatible with star forming processes in the associated PDR.
Besides, as noticed in Sect. 3.1, the most reddened sources in the analyzed region lie
preferentially on the border of the HII region that is seen in projection interior to the W44 shell.
We can therefore conclude that a scenario where the expansion of the HII region G034.8-0.7 has triggered
the formation of IR1 is more possible.
Careful modeling of this scenario, including the actions of the HII region and the SNR,
is planned for the near future.
Future molecular observations are planned to be performed towards this region in order to look for more YSOs embedded in the perturbed molecular cloud. Also extended CS observations towards IR1 would be important. The transitions of this molecular species are very useful to derive the detailed density structure within the molecular envelopes of star-forming regions.
5 Summary
We present an infrared study and molecular observations towards the IR source
IRAS 18542+0114 carried out to explore signatures of star forming activity on
the border of the HII region G034.8-0.7, which evolves within a molecular cloud shocked by the SNR W44.
We found that IRAS 18542+0114 presents a slight extended emission in the
IRAC 4.5 ![]() m band, which suggests
that this source may be a YSO driven outflow. IRAS 18542+0114 is resolved into several sources
in the 2MASS All-Sky Point Source Catalog, and two of them according to color criteria are YSO candidates.
One of these candidates, 2MASS 18564827+0118471 (IR1 in this work), is the most reddened source in the NIR
in the studied region. From SED models we suggest that IR1 is probably a massive YSO that could be near the end of
the accretion process. Our molecular results confirm that IR1 is indeed a YSO. These results can be
summarized as follows:
m band, which suggests
that this source may be a YSO driven outflow. IRAS 18542+0114 is resolved into several sources
in the 2MASS All-Sky Point Source Catalog, and two of them according to color criteria are YSO candidates.
One of these candidates, 2MASS 18564827+0118471 (IR1 in this work), is the most reddened source in the NIR
in the studied region. From SED models we suggest that IR1 is probably a massive YSO that could be near the end of
the accretion process. Our molecular results confirm that IR1 is indeed a YSO. These results can be
summarized as follows:
- (a)
- We discovered a HCO+ clump towards IR1. It is known that such molecular species is enhanced
in molecular outflows, which is strong evidence of star forming activity.
- (b)
- We discovered 12CO outflows towards IR1 extended along the line of sight.
From the dynamical time of these outflows and an SED age estimate, we suggest an age of a few
 or maybe
 years for IR1. The discovery of molecular outflows confirms that IR1 is a YSO.
- (c)
- From the detection of the CS J=7-6 line we confirm the presence of high density
(>107 cm-3) and warm (>60 K) gas towards IR1, probably belonging to the protostellar envelope where
this YSO is forming.
- (d)
- By comparing the estimated age for IR1 and the age of the SNR W44 (
 years),
we conclude that it is unlikely that the SNR triggered the formation of IR1. On the
other hand, taking into account the age of the HII region G034.8-0.7 and that IR1, as other reddened sources, lie on
its border, we find that the HII region may have initiated star formation through the ``collect and collapse''
process.
years),
we conclude that it is unlikely that the SNR triggered the formation of IR1. On the
other hand, taking into account the age of the HII region G034.8-0.7 and that IR1, as other reddened sources, lie on
its border, we find that the HII region may have initiated star formation through the ``collect and collapse''
process.
Acknowledgements
We wish to thank the referee Dr. Zavagno whose constructive criticism has helped to improve the paper. S.P. is grateful to the staff of ASTE for the support received during the observations, especially to Juan Cortés. S.P. acknowledges the support of Viviana Guzmán during the observations. S.P. is a postdoctoral fellow of CONICET, Argentina. M.O. is a doctoral fellow of CONICET, Argentina. G.D. is member of the Carrera del Investigador Científico of CONICET, Argentina. This work was partially supported by the CONICET grant 6433/05, UBACYT A023 and ANPCYT PICT 04-14018. M.R. is supported by the Chilean Center for Astrophysics FONDAP No. 15010003. M.R. and S.P. aknowledge support from FONDECYT N1080335.
References
- Allen, L. E., Calvet, N., D'Alessio, P., et al. 2004, ApJS, 154, 363 [NASA ADS] [CrossRef] (In the text)
- Bachiller, R. 1996, ARA&A, 34, 111 [NASA ADS] [CrossRef]
- Bessell, M. S., & Brett, J. M. 1988, PASP, 100, 1134 [NASA ADS] [CrossRef] (In the text)
- Caswell, J. L., Murray, J. D., Roger, R. S., Cole, D. J., & Cooke, D. J. 1975, A&A, 45, 239 [NASA ADS]
- Choi, M., Evans, II, N. J., & Jaffe, D. T. 1993, ApJ, 417, 624 [NASA ADS] [CrossRef] (In the text)
- Comerón, F., Schneider, N., & Russeil, D. 2005, A&A, 433, 955 [NASA ADS] [CrossRef] [EDP Sciences]
- Cutri, R. M., Skrutskie, M. F., van Dyk, S., et al. 2003, 2MASS All Sky Catalog of point sources. (The IRSA 2MASS All-Sky Point Source Catalog, NASA/IPAC Infrared Science Archive, http://irsa.ipac.caltech.edu/applications/Gator/) (In the text)
- Cyganowski, C. J., Whitney, B. A., Holden, E., et al. 2008, AJ, 136, 2391 [NASA ADS] [CrossRef] (In the text)
- Deharveng, L., Zavagno, A., Salas, L., et al. 2003, A&A, 399, 1135 [NASA ADS] [CrossRef] [EDP Sciences]
- Deharveng, L., Zavagno, A., & Caplan, J. 2005, A&A, 433, 565 [NASA ADS] [CrossRef] [EDP Sciences]
- Dickman, R. L. 1978, ApJS, 37, 407 [NASA ADS] [CrossRef]
- Elmegreen, B. G., & Lada, C. J. 1977, ApJ, 214, 725 [NASA ADS] [CrossRef]
- Ezawa, H., Kawabe, R., Kohno, K., & Yamamoto, S. 2004, SPIE Conf. Ser., 5489, ed. J. M. Oschmann, Jr., 763 (In the text)
- Fazio, G. G., Hora, J. L., Allen, L. E., et al. 2004, ApJS, 154, 10 [NASA ADS] [CrossRef]
- Gregersen, E. M., Evans, II, N. J., Zhou, S., & Choi, M. 1997, ApJ, 484, 256 [NASA ADS] [CrossRef]
- Gregersen, E. M., Evans, II, N. J., Mardones, D., & Myers, P. C. 2000, ApJ, 533, 440 [NASA ADS] [CrossRef]
- Grevesse, N., Lambert, D. L., Sauval, A. J., et al. 1991, A&A, 242, 488 [NASA ADS] (In the text)
- Hanson, M. M., Howarth, I. D., & Conti, P. S. 1997, ApJ, 489, 698 [NASA ADS] [CrossRef] (In the text)
- Helfand, D. J., Becker, R. H., White, R. L., Fallon, A., & Tuttle, S. 2006, AJ, 131, 2525 [NASA ADS] [CrossRef] (In the text)
- Hiramatsu, M., Hayakawa, T., Tatematsu, K., et al. 2007, ApJ, 664, 964 [NASA ADS] [CrossRef] (In the text)
- Hoffman, I. M., Goss, W. M., Brogan, C. L., & Claussen, M. J. 2005, ApJ, 627, 803 [NASA ADS] [CrossRef] (In the text)
- Jackson, J. M., Rathborne, J. M., Shah, R. Y., et al. 2006, ApJS, 163, 145 [NASA ADS] [CrossRef] (In the text)
- Johnstone, D., Boonman, A. M. S., & van Dishoeck, E. F. 2003, A&A, 412, 157 [NASA ADS] [CrossRef] [EDP Sciences] (In the text)
- Kuchar, T. A., & Clark, F. O. 1997, ApJ, 488, 224 [NASA ADS] [CrossRef]
- Leung, C. M., & Brown, R. L. 1977, ApJ, 214, L73 [NASA ADS] [CrossRef]
- Lockman, F. J. 1989, ApJS, 71, 469 [NASA ADS] [CrossRef] (In the text)
- Mac Low, M.-M., & Klessen, R. S. 2004, Rev. Mod. Phys., 76, 125 [NASA ADS] [CrossRef] (In the text)
- McKee, C. F., & Ostriker, E. C. 2007, ARA&A, 45, 565 [NASA ADS] [CrossRef]
- McKee, C. F., & Tan, J. C. 2003, ApJ, 585, 850 [NASA ADS] [CrossRef] (In the text)
- Melioli, C., de Gouveia Dal Pino, E. M., de La Reza, R., & Raga, A. 2006, MNRAS, 373, 811 [NASA ADS] [CrossRef]
- Milam, S. N., Savage, C., Brewster, M. A., Ziurys, L. M., & Wyckoff, S. 2005, ApJ, 634, 1126 [NASA ADS] [CrossRef] (In the text)
- Moriarty-Schieven, G. H., Wannier, P. G., Mangum, J. G., Tamura, M., & Olmsted, V. K. 1995, ApJ, 455, 190 [NASA ADS] [CrossRef] (In the text)
- Opik, E. J. 1953, Irish Astron. J., 2, 219 [NASA ADS] (In the text)
- Ortega, M. E., Cichowolski, S., Castelletti, G., & Dubner, G. 2007, Boletín de la Asociación Argentina de Astronomía, La Plata, Argentina, 50, 189
- Radhakrishnan, V., Brooks, J. W., Goss, W. M., Murray, J. D., & Schwarz, U. J. 1972, ApJS, 24, 1 [NASA ADS] [CrossRef]
- Rathborne, J. M., Jackson, J. M., & Simon, R. 2006, ApJ, 641, 389 [NASA ADS] [CrossRef]
- Rathborne, J. M., Simon, R., & Jackson, J. M. 2007, ApJ, 662, 1082 [NASA ADS] [CrossRef]
- Rawlings, J. M. C., Redman, M. P., Keto, E., & Williams, D. A. 2004, MNRAS, 351, 1054 [NASA ADS] [CrossRef] (In the text)
- Reach, W. T., Rho, J., Tappe, A., et al. 2006, AJ, 131, 1479 [NASA ADS] [CrossRef] (In the text)
- Rieke, G. H., & Lebofsky, M. J. 1985, ApJ, 288, 618 [NASA ADS] [CrossRef] (In the text)
- Robitaille, T. P., Whitney, B. A., Indebetouw, R., Wood, K., & Denzmore, P. 2006, ApJS, 167, 256 [NASA ADS] [CrossRef]
- Robitaille, T. P., Whitney, B. A., Indebetouw, R., & Wood, K. 2007, ApJS, 169, 328 [NASA ADS] [CrossRef]
- Seta, M., Hasegawa, T., Dame, T. M., et al. 1998, ApJ, 505, 286 [NASA ADS] [CrossRef] (In the text)
- Seta, M., Hasegawa, T., Sakamoto, S., et al. 2004, AJ, 127, 1098 [NASA ADS] [CrossRef] (In the text)
- Skrutskie, M. F., Cutri, R. M., Stiening, R., et al. 2006, AJ, 131, 1163 [NASA ADS] [CrossRef] (In the text)
- van Dishoeck, E. F., & Jørgensen, J. K. 2008, Ap&SS, 313, 15 [NASA ADS] [CrossRef] (In the text)
- van Dishoeck, E. F., Glassgold, A. E., Guelin, M., et al. 1992, in Astrochemistry of Cosmic Phenomena, ed. P. D. Singh, IAU Symp., 150, 285
- van Zadelhoff, G.-J., van Dishoeck, E. F., Thi, W.-F., & Blake, G. A. 2001, A&A, 377, 566 [NASA ADS] [CrossRef] [EDP Sciences] (In the text)
- Vanhala, H. A. T., & Cameron, A. G. W. 1998, ApJ, 508, 291 [NASA ADS] [CrossRef]
- Werner, M. W., Roellig, T. L., Low, F. J., et al. 2004, ApJS, 154, 1 [NASA ADS] [CrossRef]
- Wolszczan, A., Cordes, J. M., & Dewey, R. J. 1991, ApJ, 372, L99 [NASA ADS] [CrossRef] (In the text)
- Wu, Y., Wei, Y., Zhao, M., et al. 2004, A&A, 426, 503 [NASA ADS] [CrossRef] [EDP Sciences] (In the text)
- Zavagno, A., Deharveng, L., Comerón, F., et al. 2006, A&A, 446, 171 [NASA ADS] [CrossRef] [EDP Sciences]
- Zhou, S. 1992, ApJ, 394, 204 [NASA ADS] [CrossRef]
- Zhou, S., Evans, II, N. J., Koempe, C., & Walmsley, C. M. 1993, ApJ, 404, 232 [NASA ADS] [CrossRef] (In the text)
Footnotes
- ... GRS
![[*]](/icons/foot_motif.gif)
- Galactic Ring Survey (Jackson et al. 2006).
- ... models
- http://caravan.astro.wisc.edu/protostars
All Tables
Table 1: Molecular clump parameters from the HCO+ J=4-3emission.
Table 2:
Observed parameters of the 13CO J=3-2 and CS J=7-6 emissions towards
RA = 18![]() 56
56![]() 47.8
47.8![]() ,
dec. = +01
,
dec. = +01![]() 18
18![]() 45
45
![]() (J2000).
(J2000).
Table 3: Outflows parameters.
All Figures
| |
Figure 1: 13CO J=1-0 line averaged between 40 and 50 km s-1 showing the giant molecular cloud GMC G34.8-0.6. The thick blue contours outline the radio continuum emission of the SNR W44 and the HII region G034.8-0.7 at 20 cm. The cross shows the position of IRAS 18542+0114. |
| Open with DEXTER | |
| In the text | |
| |
Figure 2:
Spitzer-IRAC three color image (3.5 |
| Open with DEXTER | |
| In the text | |
| |
Figure 3: 2MASS JHK three-color image towards IRDC 34.776-0.554. The most reddened NIR sources are indicated with numbers. IRAS 18542+0114 is resolved into several 2MASS sources. The brightest and the most reddened one is 2MASS 18564827+0118471. |
| Open with DEXTER | |
| In the text | |
| |
Figure 4: Color-color diagram of the infrared sources in the vicinity of IRDC 34.776-0.554. The two solid curves represent the location of the main sequence (thin line) and the giant stars (thicker line) derived from Bessell & Brett (1988). The parallel dashed lines are reddening vectors with the crosses placed at intervals corresponding to five magnitudes of visual extinction. We have assumed the interstellar reddening law of Rieke & Lebofsky (1985) ( AJ/AV=0.282; AH/AV=0.175 and AK/AV=0.112). The plot is classified into three regions: cool giants, normally reddened stars and infrared excess sources. The most reddened sources are indicated as circled dots and the numbers correspond to the numbered sources of Fig. 3. |
| Open with DEXTER | |
| In the text | |
| |
Figure 5:
IRAC 8 |
| Open with DEXTER | |
| In the text | |
| |
Figure 6: GLIMPSE color-color diagram, [3.6]-[4.5] versus [5.8]-[8.0], for the most reddened sources from Fig. 3. Class I and Class II regions are indicated following Allen et al. (2004). The ellipse centered at 0, 0 encloses the region of main sequence and giant stars. |
| Open with DEXTER | |
| In the text | |
| |
Figure 7:
HCO+ J=4-3 emission integrated between 40 and 50 km s-1 towards the infrared source IRAS 18542+0114. The
contours levels are 3.5, 5, 7, 9 and 11 K km s-1. The crosses indicate the positions of the 2MASS point sources that
according to the color criteria described in the text could be YSOs. The angular resolution is |
| Open with DEXTER | |
| In the text | |
| |
Figure 8:
HCO+ J=4-3 average profile of the region where emission is detected. The rms noise is
|
| Open with DEXTER | |
| In the text | |
| |
Figure 9:
HCO+ J=4-3 spectra obtained towards IR1, whose offset position is approximately (10
|
| Open with DEXTER | |
| In the text | |
| |
Figure 10:
12CO J=3-2 spectra. Upper: spectrum towards the center of the observed region. Bottom: spectrum
towards the edge of the region. The borders between outflow and line core are shown with two vertical lines.
The rms noise is
|
| Open with DEXTER | |
| In the text | |
| |
Figure 11: The thin contours represents the 12CO J=3-2 emission integrated between 27 and 37 km s-1 (blueshifted component). The contour levels are 5, 10, 15 and 20 K km s-1. The thick contours show the 12CO J=3-2 emission integrated between 50 to 63 km s-1 (redshifted component) and the levels are 10, 15, 20 and 25 K km s-1. The crosses indicate the positions of the 2MASS sources IR1 and IR2. |
| Open with DEXTER | |
| In the text | |
| |
Figure 12:
12CO position-velocity diagrams. Left: along a line at constant
RA = 18 |
| Open with DEXTER | |
| In the text | |
| |
Figure 13:
Three dimensional picture showing isosurfaces of intensity. The
feature between |
| Open with DEXTER | |
| In the text | |
| |
Figure 14:
13CO J=3-2 profile ( left) and CS J=7-6 profile ( right) obtained towards RA = 18 |
| Open with DEXTER | |
| In the text | |
Copyright ESO 2009
Current usage metrics show cumulative count of Article Views (full-text article views including HTML views, PDF and ePub downloads, according to the available data) and Abstracts Views on Vision4Press platform.
Data correspond to usage on the plateform after 2015. The current usage metrics is available 48-96 hours after online publication and is updated daily on week days.
Initial download of the metrics may take a while.