| Issue |
A&A
Volume 498, Number 1, April IV 2009
|
|
|---|---|---|
| Page(s) | 115 - 126 | |
| Section | Interstellar and circumstellar matter | |
| DOI | https://doi.org/10.1051/0004-6361/200810936 | |
| Published online | 30 January 2009 | |
A new spectroscopic and interferometric study of the young stellar object V645 Cygni![[*]](/icons/foot_motif.gif)
A. S. Miroshnichenko1,2 - K.-H. Hofmann1 - D. Schertl1 - G. Weigelt1 - S. Kraus1 - N. Manset3 - L. Albert3 - Y. Y. Balega4 - V. G. Klochkova4 - R. J. Rudy5 - D. K. Lynch5 - S. Mazuk5 - C. C. Venturini5 - R. W. Russell5 - K. N. Grankin6 - R. C. Puetter7 - R. B. Perry8
1 - Max-Planck-Institut für Radioastronomie, Auf dem Hügel 69, 53121 Bonn, Germany
2 -
University of North Carolina at Greensboro, Department of Physics and Astronomy, PO Box
26170, Greensboro, NC 27402-6170, USA
3 -
CFHT Corporation, 65-1238 Mamalahoa Hwy, Kamuela, HI 96743, Hawaii, USA
4 -
Special Astrophysical Observatory of the Russian Academy of Sciences, Nizhnyj Arkhyz 369167, Russia
5 -
The Aerospace Corp. M2/266, PO Box 92957, Los Angeles, CA 90009, USA
6 -
Crimean Astrophysical Observatory, Nauchny, Crimea 334413, Ukraine
7 -
Center for Astrophysics and Space Science, University of California, San Diego, C-0111, La Jolla, CA 92093, USA
8 -
Earth and Space Science Support Office, M/S 160, NASA Langley Research Center, Hampton, VA 23681, USA
Received 8 September 2008 / Accepted 25 November 2008
Abstract
Aims. We present the results of high-resolution optical spectroscopy, low-resolution near-IR spectroscopy and near-infrared speckle interferometry of the massive young stellar object candidate V645 Cyg, acquired to refine its fundamental parameters and the properties of its circumstellar envelope.
Methods. Speckle interferometry in the H- and K-bands and an optical spectrum in the range 5200-6680 Å with a spectral resolving power of R = 60 000 were obtained at the 6 m telescope of the Russian Academy of Sciences. Another optical spectrum in the range 4300-10 500 Å with R = 79 000 was obtained at the 3.6 m CFHT. Low-resolution spectra in the ranges 0.46-1.4  m and 1.4-2.5 m with R
  800 and 700, respectively, were obtained at the 3 m Shane telescope of the Lick Observatory.
Results. Using a novel kinematical method based on the non-linear modeling of the neutral hydrogen density profile in the direction toward the object, we propose a distance of D = 4.2  0.2 kpc. We also suggest a revised estimate of the star's effective temperature,
 25 000 K. We resolved the object in both H- and K-bands. Using a two-component ring fit, we derived a compact component size of 14 mas and 12 mas in the H- and K-band, respectively, which correspond to 29 and 26 AU at the revised distance. Analysis of our own and previously published data indicates a 2 mag decrease in the near-infrared brightness of V645 Cyg at the beginning of the 1980's. At the same time, the cometary nebular condensation N1 appears to fade in this wavelength range with respect to the N0 object, representing the star with a nearly pole-on optically-thick disk and an optically-thin envelope.
Conclusions. We conclude that V645 Cyg is a young, massive, main-sequence star, which recently emerged from its cocoon and has already experienced its protostellar accretion stage. The presence of accretion is not necessary to account for the high observed luminosity of (2-6)  104
104  yr-1. The receding part of a strong, mostly uniform outflow with a terminal velocity of 800 km s-1 is only blocked from view far from the star, where forbidden lines form. The near-infrared size of the source is consistent with the dust sublimation distance close to this hot and luminous star and is the largest among all young stellar objects observed interferometrically to-date.
Key words: techniques: spectroscopic - techniques: interferometric - stars: early-type - stars: winds, outflows -
circumstellar matter - stars: individual: V645 Cyg
1 Introduction
The object was discovered as a variable star with long-term wave-like variations by Hoffmeister et al. (1951) and received its name of (Obj)V645 Cyg(Obj) in the General Catalog of Variable Stars (Kholopov et al. 1985-1990). A strong IR source was detected at the same location in the course of the CRL survey ((Obj)CRL 2789(Obj), Walker & Price 1975) and identified with an optically faint, starlike nebula (N0), accompanied by a cometary shape structure (N1) a few arcseconds apart (Cohen 1977). Goodrich (1986) discovered a more complex structure in the object's optical image and called it the ``Duck nebula''.
Several initial studies of the object gave controversial results, some of which are summarized in Table 1. Absorption lines in the spectrum of N1 were attributed to an expanding shell (Humphreys et al. 1980). No evidence of the nature of the underlying star was found. The reddening derived from the optical color-indices was attributed to the interstellar (IS) medium.
Table 1: Published results for the nature and evolutionary state of V645 Cyg.
Hamann & Persson (1989) used medium-resolution optical spectroscopy and concluded that N0 and N1 represent reflected light. Analyzing line profiles in their spectra, they proposed the presence of a circumstellar (CS) disk and a bipolar outflow. Distinctive features of the spectrum are blue-shifted, forbidden, emission lines of [O I] and [S II], which can be explained by blocking the receding part of the outflow by the optically-thick disk. Later these authors suggested that V645 Cyg might be a FU Ori type star with an accretionally heated disk (Hamann & Persson 1992). The object's morphology (a central condensation accompanied by an arc-shaped filament), sometimes referred to as cometary nebula, is sometimes observed in FU Ori type objects (e.g., (Obj)Z CMa(Obj)) as well as in Herbig Be candidate stars (e.g., (Obj)MWC 137(Obj)). Thus, it cannot by itself be an indicator of the object's type.
Photometric data (see Sect. 4) imply that V645 Cyg has had no FU Ori type outburst in the past 60 years. Moreover, optical color-indices of V645 Cyg are typical for
reddened early B-type stars, while FU Ori type objects have color-indices typical of F-type supergiants. On the other hand, blue-shifted forbidden lines, similar to those of V645 Cyg, are
seen in the spectrum of Z CMa (a FU Ori candidate associated with a similar cometary nebula), which shows bluer colors at maximum brightness. The latter are due to a variable contribution of a
high-excitation source (early B-type) in addition to a mid F-type supergiant spectrum.
V645 Cyg is a prominent IR source detected by the IRAS, ISO, and MSX satellites. The mid-IR spectra exhibit a  10 m silicate feature in absorption (shown in Fig. 9 below), which
may be attributed to the IS extinction (Bowey et al. 2003). Lorenzetti et al. (1999) reported detection of forbidden emission lines of [O I] at 63.2 m, [O III] at 88.5 m, and of [C II] at 157.8 m in the ISO spectrum of the object. They found that these lines are also present in the spectra of Herbig Ae/Be stars and that the [O III] line
was associated only with the hottest objects (earlier than B0).
10 m silicate feature in absorption (shown in Fig. 9 below), which
may be attributed to the IS extinction (Bowey et al. 2003). Lorenzetti et al. (1999) reported detection of forbidden emission lines of [O I] at 63.2 m, [O III] at 88.5 m, and of [C II] at 157.8 m in the ISO spectrum of the object. They found that these lines are also present in the spectra of Herbig Ae/Be stars and that the [O III] line
was associated only with the hottest objects (earlier than B0).
Near-IR imaging polarimetry (Minchin et al. 1991) shows that the polarization decreases with wavelength from 10% in the J-band to 3.6% in the K-band. The polarization
position angle rotates significantly with wavelength (9 in the J-band to 36
in the K-band). These results were interpreted as evidence of a disk around N0 and N1 being a slab of
material swept-up by the outflow from N0.
in the J-band to 36
in the K-band). These results were interpreted as evidence of a disk around N0 and N1 being a slab of
material swept-up by the outflow from N0.
Variable methanol (Slysh et al. 1999; Szymchak et al. 2000; Blaszkiewicz & Kus 2004) and water vapour (Comoretto et al. 1990) maser emission from the source was detected in several studies. These types of masers are common in massive young stars.
Clarke et al. (2006, hereafter C06) published low-resolution optical and near-IR spectra, near/mid IR imaging, and 13CO line observations of V645 Cyg. They found redshifted (1800-2000 km s-1), weak, emission features close to the H and He I 1.701 m lines, and the CO 2.29 m band. Their presence was interpreted as a possible manifestation of the receding part of the outflow. They suggested that the star is
surrounded by a pseudo-photosphere, which implies that the object resembles a late O-type supergiant obscuring a hotter star inside. They also concluded that N0 coincides with the position of the star.
No emission from the knot N1 was observed at
and He I 1.701 m lines, and the CO 2.29 m band. Their presence was interpreted as a possible manifestation of the receding part of the outflow. They suggested that the star is
surrounded by a pseudo-photosphere, which implies that the object resembles a late O-type supergiant obscuring a hotter star inside. They also concluded that N0 coincides with the position of the star.
No emission from the knot N1 was observed at
 m.
m.
Despite a general consensus that V645 Cyg is a young stellar object, there is still no agreement about its physical parameters. Some authors prefer the O-type classification (e.g., Testi et al. 1998), while others adopt the A-supergiant idea (e.g., Bowey et al. 2003). The distance toward the object is also not well-constrained.
In this paper, we attempt a revised analysis of the properties of this remarkable object based on high-resolution (R  60 000) optical spectroscopy and near-IR speckle interferometry, which have been obtained for the first time.
Our observations and results are described in Sects. 2 and 3, respectively. Analysis of our and the other available data is presented in Sect. 4, and our conclusions, predictions, and suggestions for future observations are given in Sect. 5.
2 Observations
The speckle interferograms of V645 Cyg were recorded in September 2002 with the 6 m telescope of the Special Astrophysical Observatory (SAO) of the Russian Academy of Sciences (see Table 2). The detector of our speckle camera was a Rockwell HAWAII array. A K-band filter with a central wavelength of 2115 nm and a bandwidth 214 nm, and a H-band filter with a central wavelength of 1648 nm and a bandwidth 317 nm were used. In the K- and H-band observations, the sizes of one pixel on the sky corresponded to 27 mas and 20 mas, respectively. Further observational parameters are listed in Table 2.
![\begin{figure}
\par\hspace*{0.8cm}\includegraphics[width=5cm,clip]{0936f1a.eps}\...
....eps}\hspace*{1cm}
\includegraphics[width=5.8cm,clip]{0936f1f.eps}
\end{figure}](/articles/aa/full_html/2009/16/aa10936-08/img14.gif) |
Figure 1: Measured diffraction-limited two-dimensional visibilities of V645 Cyg in the H-band ( top left) and K-band ( top right) as a function of spatial frequency in cycles/arcsec on both axes. Radial dependence of the azimuthally averaged two-dimensional visibilities is shown together with one-component Gaussian and uniform disc (UD) fits ( middle panels) as well as two-component Gaussian fits ( lower panels). The H-band data are presented in the left column, and the K-band data in the right column. The fit range is up to the telescope cut-off frequency. The numbers are the FWHM diameters of the large/small component of the two-component model (see Table 3). |
| Open with DEXTER | |
![\begin{figure}
\par\includegraphics[width=6cm,clip]{0936f2a.eps}\hspace*{1cm}
\includegraphics[width=6cm,clip]{0936f2b.eps}
\end{figure}](/articles/aa/full_html/2009/16/aa10936-08/img15.gif) |
Figure 2: Visibilities of the best-fitting two-component models consisting of two centered rings fitted to the azimuthally averaged measured visibilities. The thickness of each ring was assumed to be 20% of the ring diameter. The fit range is up to the telescope cut-off frequency. The listed numbers are the diameters of the large/small component of the two-component model (see Table 4). |
| Open with DEXTER | |
The modulus of the Fourier transform of the object (visibility) was obtained with the speckle interferometry method (Labeyrie 1970). The speckle interferograms of the unresolved stars
HD 206824 (in the K-band) and BD+48
 3475 (in the H-band) were recorded immediately before and after the object's observations, and served to determine the speckle transfer function.
The reconstructed two-dimensional visibility of V645 Cyg in both filters and their model fits are shown in Figs. 1 and 2.
3475 (in the H-band) were recorded immediately before and after the object's observations, and served to determine the speckle transfer function.
The reconstructed two-dimensional visibility of V645 Cyg in both filters and their model fits are shown in Figs. 1 and 2.
Table 2: Details of the speckle interferometry observations.
High-resolution optical spectroscopy of V645 Cyg was obtained on July 10, 2004 at the SAO 6 m telescope, and in August 2006 at the 3.6 m CFHT. At SAO, we used the échelle spectrometer NES (Panchuk et al. 2007), which provides a spectral resolving power of R = 60 000. The spectral range observed was 5280-6680 Å. The resulting spectrum was a sum of two one-hour exposures with an average signal-to-noise (S/N) ratio of 30 per pixel. The spectroscopic data were processed using standard procedures of the MIDAS package.
![\begin{figure}
\par\includegraphics[width=7cm,clip]{0936f3a.eps}\hspace*{2cm}
\includegraphics[width=7cm,clip]{0936f3b.eps}
\end{figure}](/articles/aa/full_html/2009/16/aa10936-08/img21.gif) |
Figure 3:
Portions of our CFHT and SAO spectra of V645 Cyg. All the portions are from the CFHT spectrum, except for the weaker H |
| Open with DEXTER | |
The spectroscopic mode of the échelle spectropolarimeter ESPaDOnS (Manset & Donati 2003) was used at CFHT. The resulting spectrum was a sum of twelve individual spectra (five taken on 2006 August 6 and seven on 2006 August 8) of a total exposure time of 7970 s obtained with an average R
79 000 (per resolution element, 2 pixels) in the range
 3600-10 500 Å. The S/N ratio gradually increased from 15 at H
 to
100 at H
due to the object's reddened SED. The data reduction was completed with Libre-ESpRIT, written by Donati of Observatoire Midi-Pyrénées, and provided by CFHT. We identified
nearly 150 spectral lines in the range
4320-8750 Å, and present their parameters in Table 5. The hydrogen Paschen series lines were detected up to P22, but those that are
heavily contaminated by telluric absorption bands are not included in the table.
to
100 at H
due to the object's reddened SED. The data reduction was completed with Libre-ESpRIT, written by Donati of Observatoire Midi-Pyrénées, and provided by CFHT. We identified
nearly 150 spectral lines in the range
4320-8750 Å, and present their parameters in Table 5. The hydrogen Paschen series lines were detected up to P22, but those that are
heavily contaminated by telluric absorption bands are not included in the table.
The low-resolution spectrum of V645 Cyg was obtained at the 3 m Shane telescope of the Lick Observatory with the Near-InfraRed Imaging Spectrograph (NIRIS, Rudy et al. 1999)
on 2006 June 14. NIRIS has three channels and provides an almost continuous coverage between 0.48 and 2.5 m as well as a nearly uniform dispersion within each channel. The average R was
800 in the optical channel (0.48 m 
 m) and 700 in both IR channels (0.8 m
 m and 1.4 m
 m).
m).
3 Results
3.1 Optical spectroscopy
Qualitatively our high-resolution optical spectra are similar to those published by Hamann & Persson (1989) obtained in the 1980's and by C06 obtained in the 1990's. Even the emission line widths (e.g., the Ca II IR triplet and Fe I lines, see Fig. 3) are virtually identical, providing evidence of the long-term (25 years) stability of the underlying star and its CS structures.
![\begin{figure}
\par\includegraphics[width=8cm,clip]{0936f4.eps}
\end{figure}](/articles/aa/full_html/2009/16/aa10936-08/img27.gif) |
Figure 4: Red part of the CFHT spectrum of V645 Cyg. The three strong unmarked lines are blends of the IR Ca I triplet and hydrogen lines of the Paschen series. The intensity is normalized to nearby continuum, and the wavelengths are heliocentric. |
| Open with DEXTER | |
The combination of our spectral resolution (5-10 km s-1) and spectral coverage significantly exceeds in both quality and quantity all previously published data for V645 Cyg. This allowed us to
obtain for the first time a detailed profile of the H line, detect a faint He I 7065 Å line (both have P Cyg type profiles), and measure parameters of several diffuse IS bands (DIBs). Portions of our CFHT and SAO optical spectra of V645 Cyg are shown in Figs. 3-6.
![\begin{figure}
\par\includegraphics[width=9cm,clip]{0936f5.eps}
\end{figure}](/articles/aa/full_html/2009/16/aa10936-08/img28.gif) |
Figure 5: Blueshifted forbidden lines in the CFHT spectrum of V645 Cyg. The sharp emission components on the red wings of the [O I] lines are telluric. The intensity is normalized to nearby continuum. The velocity scales is heliocentric. Similar profiles were presented by Hamann & Persson (1989) for the [S II] lines and by Acke et al. (2005) for the [O I] lines. |
| Open with DEXTER | |
The equivalent widths of the DIBs at 5780 Å and 5797 Å (0.63 Å and 0.20 Å, respectively) are consistent with a color-excess of E(B-V) = 1.28
0.05 mag
(Herbig 1993). This result is in good agreement with E(B-V)
1.35
0.10 mag, deduced from optical photometry (see Sect. 4.3) by assuming an O- to early B-type for the underlying star. Along with the conclusion of C06 that the position of N0 corresponds to the star's position, it also indicates a small amount of CS reddening. Nevertheless, despite detecting weak DIBs (e.g., 6699 Å with an equivalent width of 0.02 Å and an intensity of 0.98 with respect to the continuum), no photospheric lines were detectable in our spectra. We address possible reasons for this situation in Sect. 4.2.
Our data allowed us to approach the spectral line identification in greater detail. We detected a number of previously unreported lines of singly ionized and neutral metals. The neutral metal lines, which are assumed to form in a disk, are single-peaked and narrow. Their radial velocities are close to those of Fe II lines, providing support to our suggestion that they represent the systemic velocity. This indicates a close to pole-on disk orientation to the line of sight.
3.2 Near-IR spectroscopy
Our flux-calibrated near-IR spectrum of V645 Cyg is consistent with earlier published observations (e.g., Geballe & Persson 1987, C06). It exhibits hydrogen, He I, Fe II, O I lines in emission. The He I line at 1.083 m has a P Cyg type profile. Other He I lines (1.701 m and 2.058 m) are not clearly detected due to a higher noise level.
![\begin{figure}
\par\includegraphics[width=9cm,clip]{0936f6.eps}
\end{figure}](/articles/aa/full_html/2009/16/aa10936-08/img29.gif) |
Figure 6:
DIBs and sodium lines in the CFHT spectrum of V645 Cyg. Position of the He I |
| Open with DEXTER | |
The fluxes integrated within the  -bands are 0.8 mag brighter than more recently obtained data (e.g., 2MASS), but are of lower brightness than in the late 1970's (see discussion in Sect. 4.3). The flux level in the optical region is lower than expected from the published photometry. This is probably due to a less confident removal of the atmospheric extinction, which is
higher at shorter wavelengths. Nevertheless, the spectrum clearly shows a change in the slope at
-bands are 0.8 mag brighter than more recently obtained data (e.g., 2MASS), but are of lower brightness than in the late 1970's (see discussion in Sect. 4.3). The flux level in the optical region is lower than expected from the published photometry. This is probably due to a less confident removal of the atmospheric extinction, which is
higher at shorter wavelengths. Nevertheless, the spectrum clearly shows a change in the slope at
 m due to the increasing contribution of the CS dust radiation.
3.3 Speckle interferometry
Figure 1 shows the power spectra and visibility curves for V645 Cyg in both H- and K-bands. The azimuthally averaged visibilities were fitted with both one- and two-component models. One-component uniform disk and Gaussian models (the results are shown in the middle panels of Fig. 1) do not show good fits in the entire range of detected visibilities, while the two-component ring fits are more consistent with the data. The results for two-component Gaussian and ring functions are presented in Tables 3 and 4, respectively. The thickness of each ring was assumed to be 20 per cent of the ring diameter. The smaller component contributes much more (a factor of10) to the total emission than the larger one in both filters. Also, both smaller and larger components have the same size within the uncertainties in both filters. Our data show that V645 Cyg is clearly resolved in both the H- and K-bands.
Table 3: Two-component fit diameters (Gaussian functions).
Table 4: Two-component fit diameters (ring functions).
Table 5: Line identification in the optical spectrum of V645 Cyg.
4 Discussion
We now use our results along with the data collected from the literature to place new constraints on the physical parameters of the underlying star and its complex CS environments.
4.1 Distance
The luminosity of V645 Cyg is not well-constrained mainly because of its unknown distance. Some distance estimates listed in Table 1 range from 3 to 6 kpc, while the most recent one is 5.7
1.0 kpc (based on the CO velocity in the direction toward the object, C06). The high IS reddening toward V645 Cyg is consistent with such a large distance and places the
object in the Perseus arm or even at a greater distance. To constrain the distance more accurately, we use a method of Foster & MacWilliams (2006). They employ the non-linear modeling of the IS H I density along the line of sight to reconstruct the radial velocity curve. As an example, their paper contains a radial velocity profile in the direction (
 ,
,
 )
that is close to that of V645 Cyg (
)
that is close to that of V645 Cyg (
 ,
,
 ). The main feature of the
velocity fields in the Perseus arm is a sharp discontinuity due to effects of a density wave in a warped Galactic disk (described as shocks by Foster & MacWilliams 2006; see their Figs. 3-7).
). The main feature of the
velocity fields in the Perseus arm is a sharp discontinuity due to effects of a density wave in a warped Galactic disk (described as shocks by Foster & MacWilliams 2006; see their Figs. 3-7).
The average heliocentric radial velocity determined from the peak positions of 37 unblended Fe II emission lines in the CFHT spectrum of V645 Cyg (these lines are believed to represent
the systemic velocity, Humphreys et al. 1989) is -44.6
3.5 km s-1. The H I velocity in the line of sight toward V645 Cyg gradually increases with distance towards negative values to 3.9 kpc, where it sharply decreases from -34 to -51 km s-1. At 4.5 kpc the velocity increases to -40 km s-1 and continues to change towards more negative velocities further away. The object's radial velocity is reached at three different distances of 3.9, 4.3, and 5.0 kpc.
In order to resolve the distance ambiguity, complementary data are required. A general suggestion for young objects, which have probably not reached a state of dynamical equilibrium in Galactic motion, and therefore the shock distance is preferred for them, is given by Foster & MacWilliams (2006). This argument ensures that the farthest distance is unlikely. More hints can be found in our optical spectrum. The triple IS component structure of the Na I D-lines (see Fig. 6) and the K I 7664 Å (contaminated by the telluric spectrum and not shown in Table 5) and 7699 Å lines can be interpreted as being due to the absorption in the local arm (the lowest velocity component), in the Perseus arm before the shock location (middle component), and in the shock (the highest velocity component). Since the highest
velocity component is observed at nearly -50 km s-1 and it is not weak, the closest distance seems to be least favorable. Therefore, taking into account the uncertainty in our radial
velocity measurement, one can constrain the object's distance to be 4.2
0.2 kpc. Independent estimates are still needed to verify this result.
4.2 Effective temperature and luminosity
Our high-resolution optical spectrum allows a new assessment of the star's
.
The absence of high excitation lines, such as [O III] at 4959 and 5007 Å or [S III] at 6310 Å, together with very weak emission components of the P Cyg type profiles of the He I lines suggest that
is unlikely to be higher than 25 000 K (spectral type B1-2). Comparing the near-IR spectrum of V645 Cyg to those of hot stars at
 m, C06 suggested that the object is probably a late O-type supergiant (He I lines in absorption, no He II emission lines). This comparison is inconclusive, because
line emission at
1.5 m in the spectrum of V645 Cyg is strongly veiled by a dusty continuum. An O-type star would give rise to He II emission lines at 4686 and 5411 Å, which are not detected in our spectra. Furthermore, a spectrum of (Obj)P Cyg(Obj), a B2-type supergiant with
20 000 K, shown in the same atlas
(Hanson et al. 2003) exhibits no He II lines and He I and Br
in emission.
m, C06 suggested that the object is probably a late O-type supergiant (He I lines in absorption, no He II emission lines). This comparison is inconclusive, because
line emission at
1.5 m in the spectrum of V645 Cyg is strongly veiled by a dusty continuum. An O-type star would give rise to He II emission lines at 4686 and 5411 Å, which are not detected in our spectra. Furthermore, a spectrum of (Obj)P Cyg(Obj), a B2-type supergiant with
20 000 K, shown in the same atlas
(Hanson et al. 2003) exhibits no He II lines and He I and Br
in emission.
Pre-main-sequence stars in this temperature range are of far lower luminosity than that estimated for V645 Cyg (L
(2-7)
10
 ,
C06). A supergiant with this temperature and luminosity would be located well above the birthline for Herbig Ae/Be stars (Palla & Stahler 1993). On the other hand, V645 Cyg is definitely not of an A-type. Evolved A-type supergiants do not show such a strong emission-line spectrum, unless they belong to the LBV group. However, even at this evolutionary stage their spectra contain lines of a much lower excitation.
,
C06). A supergiant with this temperature and luminosity would be located well above the birthline for Herbig Ae/Be stars (Palla & Stahler 1993). On the other hand, V645 Cyg is definitely not of an A-type. Evolved A-type supergiants do not show such a strong emission-line spectrum, unless they belong to the LBV group. However, even at this evolutionary stage their spectra contain lines of a much lower excitation.
Before we proceed in constraining the stellar parameters, we consider the suggestion by C06 that the object's apparent spectral type represents a pseudo-photosphere within which a hotter star is
hiding. Using their upper limit to the total IR luminosity (7
10
)
and
= 35 000 K appropriate to an O8 type star, we can calculate the star's radius of  7
7  .
This is lower than a typical main-sequence radius for such a temperature. Even the highest luminosity quoted for V645 Cyg in the literature (1.3
10
.
This is lower than a typical main-sequence radius for such a temperature. Even the highest luminosity quoted for V645 Cyg in the literature (1.3
10
 ,
Testi et al. 1998) would only increase
by 40 per cent and is still comparable to those of main-sequence stars. On the other hand, the IR luminosity,
which is supposedly produced by the stellar UV radiation, does not account for the total luminosity of the star.
,
Testi et al. 1998) would only increase
by 40 per cent and is still comparable to those of main-sequence stars. On the other hand, the IR luminosity,
which is supposedly produced by the stellar UV radiation, does not account for the total luminosity of the star.
Although the amount of extinction toward the star is not well constrained (there can be some contribution from the CS medium, see Sect. 4.5), the total flux integrated over the entire
observed spectral range (from 0.36 m to 3.6 cm; see Fig. 7) is almost extinction independent. This is because over 90 per cent is in the IR excess, where extinction
is low. The average total dereddened observed flux is (1.06
0.03)
10-7 erg s cm-2 for a range of extinction AV from 3.1 to 4.4 mag (E(B-V) from 1.0 to 1.4 mag). At the new distance of 4.2 kpc, it corresponds to a luminosity L =

 ,
while it would relate to L =
,
while it would relate to L =

 at D = 6 kpc (see Table 1 and C06). In our estimate, we used the average optical brightness from the Maidanak data, the most recent near-IR data (see Sect. 4.3), ISO spectra, and sub-mm and radio data (Cohen 1977; Skinner et al. 1993; Di Francesco et al. 1997; Corcoran & Ray 1998).
![\begin{figure}
\par\includegraphics[width=8cm,clip]{0936f7.eps}
\end{figure}](/articles/aa/full_html/2009/16/aa10936-08/img49.gif) |
Figure 7:
The SED of V645 Cyg. Optical and near-IR ground-based photometric data are shown by filled circles, our calibrated low-resolution spectrum by the solid line, the ISO fluxes at
selected wavelengths by open triangles, MSX data by filled squares, IRAS fluxes by filled triangles, and millimetric and radio fluxes by open squares. The SED is dereddened with E(B-V) = 1.3 mag and a standard IS reddening law from Savage & Mathis (1979). The dashed line represents a Kurucz (1994) model atmosphere for
|
| Open with DEXTER | |
 .
The dotted line through the long-wavelength part of the SED shows a blackbody fit to the data. The fluxes are normalized to that in the V-band, wavelengths are given in microns.
.
The dotted line through the long-wavelength part of the SED shows a blackbody fit to the data. The fluxes are normalized to that in the V-band, wavelengths are given in microns.
The SED at
1 mm follows a blackbody law, which is indicative of significant contribution from free-free emission of the outflow. Using formulae from Panagia & Felli (1975), one can estimate that a mass-loss rate of 
 yr-1 is required to reach the observed flux level at = 3 cm
(
yr-1 is required to reach the observed flux level at = 3 cm
( 0.5 mJy). This is definitely too high for an early B-type (and even for an O-type) star. Additionally, the strong emission from a nearly pole-on dusty disk veils the emission from the outflow.
With the new distance, we can also estimate the luminosity of V645 Cyg using the average optical brightness (
 0.3 mag; see Fig. 7), the aforementioned
= 25 000 K and IS reddening. For a standard IS extinction law (Savage & Mathis 1979), we find AV = 4.1 mag from the color-excess E(B-V) = 1.3 mag. Neglecting any CS effects, we derive a visual absolute magnitude of
MV = -3.7
0.4. This results in a
luminosity of
0.3 mag; see Fig. 7), the aforementioned
= 25 000 K and IS reddening. For a standard IS extinction law (Savage & Mathis 1979), we find AV = 4.1 mag from the color-excess E(B-V) = 1.3 mag. Neglecting any CS effects, we derive a visual absolute magnitude of
MV = -3.7
0.4. This results in a
luminosity of 
 = 4.4
0.1 (L =
= 4.4
0.1 (L =
 ), using an appropriate bolometric correction of BC = -2.5 mag (Miroshnichenko 1998), and a
 .
.
There is a difference corresponding to a factor of two between the above luminosity estimates, which can be reconciled in a number of ways. One can increase
to over 30 000 K to increase the bolometric correction, although the absence of high excitation line emission would be
inconsistent with this adjustment. A higher total-to-selective IS extinction ratio, understood to be more appropriate for molecular clouds, could be used. For example, if we assumed that
AV/E(B-V) = 4 (as Natta et al. 1993 employed) and fixed the distance and
values, the luminosity would match the one derived from the integrated flux. However, since most of the IS extinction originates in the foreground of the object's molecular cloud, it is more appropriate to use an average Galactic ratio for hot stars of 3.1. Additionally, the integrated flux may contain a significant contribution from light scattered off the CS dust that would not otherwise be directed along the line of sight. Whitney et al. (2003) demonstrated that the integrated flux of a star with a pole-on disk may exceed that of the star alone by a factor of up to two. Taking this effect into account would decrease the difference between the two luminosity estimates.
The possible contribution of free-bound and free-free emission from the CS gas to the continuum may also affect the luminosity estimate derived from the optical brightness. Thus, it is likely that the true luminosity of the underlying star is in between our two estimates. With all possible sources of uncertainty, the above estimates of the star's parameters appear reasonable and place its position as being close to the main-sequence, where a massive young star that has already appeared from its protostellar cocoon is located.
Nevertheless, there remains the problem of not detecting photospheric lines in the object's optical spectrum. Since the CS disk is oriented nearly pole-on (see Sect. 4.5), one can expect
the star's rotation axis to be oriented nearly along the line of sight. Therefore, rotational line broadening would not have an important impact on the photospheric line profiles. Some lines might have been missed in our spectrum because of its low S/N ratio, especially in the blue region. Some other lines (e.g., H I, He I, Si II) are entirely due to the CS gas, so that no photospheric component can be detected. Thus, the most likely reason for this situation is the aforementioned CS continuum radiation. This must be extremely strong, since a number of other objects with even more distinctive emission-line spectrum still exhibit photospheric lines at similar spectral resolution and S/N ratio (e.g., Miroshnichenko et al. 2004). However, we were unable to detect reliably any photospheric lines even in regions relatively free of line emission (e.g.,
5600-5800 Å), of high S/N ratios ( 70) in our spectra, and
where some photospheric lines for the derived spectral type are expected (e.g., S II 5640 Å or N II 5680 Å). Future observations of even higher
S/N ratios are definitely required to address this problem further.
70) in our spectra, and
where some photospheric lines for the derived spectral type are expected (e.g., S II 5640 Å or N II 5680 Å). Future observations of even higher
S/N ratios are definitely required to address this problem further.
4.3 Brightness variations
Long-term monitoring of V645 Cyg was performed at the Maidanak Observatory in Uzbekistan between 1985 and 2000 (740  observations, progress report published by Shevchenko et al.
1993). The V-band light curve is shown in the lower panel of Fig. 8. Both knots, N0 and N1, were included in the aperture of these observations. It confirms the old result of
Hoffmeister et al. (1951) about the long-term slow brightness variations. A brightness modulation with a possible period of 8 years and an amplitude of 0.6 mag is seen in
the Maidanak data. The color-indices are stable to within 0.1 mag and resemble those of a reddened early B-type star (U-B = 0.2 mag, B-V = 1.1 mag, V-R = 1.2 mag).
observations, progress report published by Shevchenko et al.
1993). The V-band light curve is shown in the lower panel of Fig. 8. Both knots, N0 and N1, were included in the aperture of these observations. It confirms the old result of
Hoffmeister et al. (1951) about the long-term slow brightness variations. A brightness modulation with a possible period of 8 years and an amplitude of 0.6 mag is seen in
the Maidanak data. The color-indices are stable to within 0.1 mag and resemble those of a reddened early B-type star (U-B = 0.2 mag, B-V = 1.1 mag, V-R = 1.2 mag).
![\begin{figure}
\par\includegraphics[width=8.5cm,clip]{0936f8.eps} \end{figure}](/articles/aa/full_html/2009/16/aa10936-08/img60.gif) |
Figure 8: Optical and near-IR light curves of V645 Cyg. The observations obtained at the Maidanak observatory and published by Shevchenko et al. (1993) are shown by open circles. The observations from the NSVS survey (Wozniak et al. 2004) and color-corrected using the mean B-V color from the Maidanak data are shown by pluses. The K-band data are collected from the literature and described in the text. The last data point (2006) on the K-band light curve represents our near-IR spectrum. The time is shown in modified Julian dates MJD = JD-2 400 000. |
| Open with DEXTER | |
A number of near-IR photometric observations of V645 Cyg have been obtained since its discovery as an IR source in the 1970's. However, the entire collection has not yet been studied. A careful look at the data shows a large scatter in the object's brightness in the 1-3 m region (see the upper panel of Fig. 8). The first published IR photometry by Lebofsky et al. (1976) was obtained on 1975 October 24 and resulted in a K-band flux of 2.3 Jy, which corresponds to 6.1 mag (using a standard calibration of 653 Jy for a zero-point of the magnitude scale, Cohen et al. 1992). The accuracy of the observational data was not indicated in the original paper.
Several other papers (Gosnell et al. 1979; Humphreys et al. 1980; Grasdalen et al. 1983) reporting IR photometry of V645 Cyg obtained in 1976-1980 detected a variable K-band brightness in a range of 4.4-5.0 mag. with a slight tendency of fading with time. This brightness level has usually been adopted in studies of the object's SED. All of these observations were obtained with single-element detectors with relatively large apertures (typically over 10
 ). Humphreys et al. (1980) noted that there was no difference in the detected
signal from aperture size between 9
and 26
.
This indicates that the N1 knot was probably always present within the apertures.
). Humphreys et al. (1980) noted that there was no difference in the detected
signal from aperture size between 9
and 26
.
This indicates that the N1 knot was probably always present within the apertures.
The next published near-IR observation obtained in 1984 or 1985 (Geballe & Persson 1987) was a spectrum, taken through a 5
diameter aperture with a continuum flux of 2.2
10-16 W cm-2 m at 2.3 m, which roughly translates into a K-band brightness of 5.7 mag. It excluded the N1 knot and only provided information about the
continuum brightness of the N0 condensation. Although this measurement could not be properly compared with earlier data, it appears to be the first indication of a significant decline in the
object's near-IR brightness. All photometric observations published subsequently that used both single- and multiple-element detectors (Minchin et al. 1991; Sun et al. 1991;
Noguchi et al. 1993; Skrutskie et al. 2006) measured even lower K-band brightness of 6.3-6.8 mag. The flux level in our near-IR spectrum integrated over the K-band response curve
implied a brightness of 5.8
0.2 mag in agreement with the data obtained after 1984.
Studying the published near-IR data for V645 Cyg, we noticed that the relative brightness of the main source (N0) and the N1 knot seemed to change with time. They had almost the same brightness in a K-band image taken by Hodapp (1994) in 1990, and a 2MASS image taken in 2000 indicated that N0 was nearly twice as bright as N1, while C06 claimed that N0 was 200 times brighter than N1 in their 2002 image (although the center of N0 is saturated in this image). Although this temporal trend still has to be confirmed, two important implications can be still deduced. First,
the decrease in near-IR brightness of V645 Cyg cannot be entirely due to the fading of N1 alone. Second, simultaneous fading of both N0 and N1 may be due to a decrease in the amount of reflective matter close to the star. This can in turn be a consequence of the strong outflow that
gradually removes the protostellar cloud material from the immediate vicinity of the star.
The sparseness of the near-IR data and a short-time overlap with the optical data do not permit a clear comparison with the object's behaviour at different wavelengths, although there is some indication of a positive correlation based on the five near-IR data points after 1990. If this is the case, then the brightness variations can be explained by luminosity fluctuations of the illumination source or changes in the CS gas properties. The latter is consistent with no or little CS dust being present along the line of sight (see Sect. 4.5).
There has been only minor variation in the H-K color-index, which averages to be 2.3
0.1 mag over all 30 years of observations. The mid-IR part of the SED has also been stable (see Fig. 9). Therefore, it appears that no significant changes in the CS dust structure has
occurred.
![\begin{figure}
\par\includegraphics[width=8.5cm,clip]{0936f9.eps}
\end{figure}](/articles/aa/full_html/2009/16/aa10936-08/img61.gif) |
Figure 9: Mid-IR part of the SED of V645 Cyg. Symbols: solid line - ISO SWS data, open circles - IRAS LRS data, triangles - MSX data, filled squares - ground-based photometry from Salas et al. 2006), asterisks - ground-based photometry from Lebofsky et al. (1976). The observed scatter is most likely due to uncertainties in absolute calibration. |
| Open with DEXTER | |
4.4 Outflow properties
The presence of many P Cyg type profiles in the spectrum of V645 Cyg indicates that the underlying star drives a strong outflow. Another feature of the spectrum is forbidden lines (see
Fig. 5), which are seen only blueward of the systemic radial velocity. This rare situation was interpreted as the blocking of the receding part of the outflow by an optically-thick disk, where low-excitation lines form (e.g., K I, Fe I, and Ca II; Hamann & Persson 1989). It also prompted a search for the possible signs of the receding part. C06 suggested that the He I 1.701 m line and two emission features (with a radial velocity of +2000 km s-1 with respect to the center of the H line (6604 Å and with a radial velocity of +1800 km s-1 with respect to the CO 2.29 m band head) might represent the receding region.
We identified the 6604 Å feature as a Sc II line, but the quality of our near-IR spectrum was not high enough to assess the origin of the remaining two. Nevertheless, we may ask whether the receding outflow has truly been missed in the hydrogen, helium, and ionized iron lines? Emission components of these line profiles are smooth, showing no evidence of any cutoff, as one would expect from an obscuration. The CS material density decreases outward in the accelerated outflow (see Hamann & Persson 1989, for discussion), such that forbidden lines, which
are of highest intensity in regions of relatively low density, form much further away from the star, beyond the region where the outflow reaches its terminal velocity of 800 km s-1 (see Fig. 3). The rapidly moving material may decelerate there, colliding with material
from the ambient molecular cloud, which would explain the lower velocities of the forbidden lines. A possible deceleration of the molecular outflow from V645 Cyg was suggested by Verdes-Montenegro et al. (1991). On the other hand, the initial acceleration cannot have been incredibly high, because the density would have had to decline rapidly, leading to weak line emission. Therefore, it is reasonable to conclude that the inner edge of the optically-thick disk is located at a distance of at least at a few tens of the stellar radii.
4.5 Structure of the CS dust
Clearly, V645 Cyg is surrounded by a large amount of CS dust that manifests itself in a strong IR excess (see Fig. 7). The absence of significant obscuration toward the star (the reddening
deduced from optical photometry is similar to that inferred from the DIB strengths; see Sect. 3.1), along with the presence of a disk-like structure, which blocks the red parts of the forbidden lines, indicate that the CS dust geometry may also be disk-like. However, it has already been suggested that V645 Cyg may have an optically-thin dusty envelope in addition to a
geometrically-thin and optically-thick (at least at short wavelengths) disk (Natta et al. 1993). This suggestion is supported by measurements of the object's IR size, which increases with wavelength in the near- and mid-IR (
 at
at
 m and 22
 at
at
 m, Natta et al. 1993) and decreases at yet longer wavelengths (
at
m, Natta et al. 1993) and decreases at yet longer wavelengths (
at
 m, Sandell & Weintraub 1994,
at 3.6 cm, Di Francesco et al. 1997). Miroshnichenko et al. (1999) demonstrated that no one-component source can reproduce this size variation with
wavelength. For the flux integrated over the entire object, a colder and smaller disk dominates the longer-wavelength domain (
m, Sandell & Weintraub 1994,
at 3.6 cm, Di Francesco et al. 1997). Miroshnichenko et al. (1999) demonstrated that no one-component source can reproduce this size variation with
wavelength. For the flux integrated over the entire object, a colder and smaller disk dominates the longer-wavelength domain (
 m), while a warmer and more extended envelope is more dominant at shorter wavelengths.
Another important question that has not been clearly addressed is whether accretion is still ongoing or not in the disk. Natta et al. (1993) argued that the disk dominates the energy output of
V645 Cyg and its contribution is much larger than expected for a passive reprocessing disk. They estimated the accretion rate to be 7
 yr-1, which is much higher than a typical protostellar accretion rate for intermediate-mass stars of
 yr-1 (Palla & Stahler 1993). Since the star is probably more massive than 10 ,
intense accretion should have halted while it was still inside its parental cloud. Since the star has already been released from the cocoon, it must be already on the main-sequence. The outflow properties (the fact that we see no long-wavelength cutoff of the lines that form close to the star, see Sect. 4.4) also imply that the disk does not approach close to the star. These arguments strongly suggest that accretion is currently absent, and the star is the main source of energy in the system.
yr-1 (Palla & Stahler 1993). Since the star is probably more massive than 10 ,
intense accretion should have halted while it was still inside its parental cloud. Since the star has already been released from the cocoon, it must be already on the main-sequence. The outflow properties (the fact that we see no long-wavelength cutoff of the lines that form close to the star, see Sect. 4.4) also imply that the disk does not approach close to the star. These arguments strongly suggest that accretion is currently absent, and the star is the main source of energy in the system.
4.6 Speckle interferometry of the dusty environments
The location of the H-band close to the minimum of the dereddened SED (see Fig. 7) may imply that the systematically larger size (although within the uncertainties) of the best-fit model in comparison with that of the K-band can be due to a higher scattered light contribution. Thus, we use the fitting results for the K-band to characterize the distance of the hottest dust from the star.
Using the theory of radiative transfer in dusty media, Ivezic & Elitzur (1997) showed that, irrespective of the envelope geometry, the distance of the closest dust to the radiation source, r1, is determined by the source luminosity and a scaling factor  ,
which depends on the dimensionless profiles of the source radiation and the dust absorption efficiency, such that
,
which depends on the dimensionless profiles of the source radiation and the dust absorption efficiency, such that
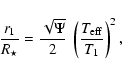
where T1 is the dust temperature at r1.
They denote by
a ratio of the wavelength dependence of the dust absorption efficiency weighted with the radiation source SED, to the identical quantity weighted by the dust radiation (blackbody) SED for T1. This factor was calculated for a typical T1 of 1500 K by Monnier
& Millan-Gabet (2002) for a range of
and dust optical properties. They showed that the factor is almost unity for large particles (1 m size) and sharply increases to a factor of 50-80 for grain sizes of the order of 0.01 m.
Our most suitable single-component uniform disk fit with a diameter of 37.0
8.5 mas corresponds to a distance of 78
19 AU at 4.2 kpc or 1660
400 ,
assuming that = 10 .
This requires
140 to have the closest dust at such a large distance from the star. The result is inconsistent with even the smallest dusty grains. These grains, if they exist in the envelope or the disk surface layer of V645 Cyg, would produce
emission features (e.g., at
 m) that are not observed in its spectrum (see Fig. 9).
Therefore, it seems more appropriate to use a two-component fit. Since fits to interferometric data for objects with CS envelopes commonly assume a ring-like matter distribution (a typical
width of such a ring is 20 per cent of its diameter; see Monnier et al. 2005). This simple method allows us to approximate a rough characteristic size that can be used for comparison with other observations. The best-fit model in the K-band has a radius of the compact component of 12
2 mas that translates into a distance of 26
4 AU or 510
85 .
This requires a value of 10, and corresponds to an average grain size of 0.3 m. Another estimate can be obtained by using the calculations of dust temperatures that would produce the observed size-luminosity relationship presented by Millan-Gabet et al. (2007). They are shown in Fig. 10 and suggest that the size of V645 Cyg at
 m can be explained by radiation from 1000 K dust. Taking into account the uncertainties in the star's temperature and the dust distribution, we can conclude that the small component of
the K-band visibility fit represents the CS dust close to its sublimation radius. It cannot be excluded that the inner dust boundary has already been moved by the strong outflow from the star. The lack of attenuation by the CS dust is in agreement with the image azimuthal symmetry.
m can be explained by radiation from 1000 K dust. Taking into account the uncertainties in the star's temperature and the dust distribution, we can conclude that the small component of
the K-band visibility fit represents the CS dust close to its sublimation radius. It cannot be excluded that the inner dust boundary has already been moved by the strong outflow from the star. The lack of attenuation by the CS dust is in agreement with the image azimuthal symmetry.
![\begin{figure}
\par\includegraphics[width=8.5cm,clip]{0936f10.eps}
\end{figure}](/articles/aa/full_html/2009/16/aa10936-08/img74.gif) |
Figure 10: Measured sizes of Herbig Ae (filled circles) and Herbig Be (open circles) stars plotted versus their luminosity (adopted from Millan-Gabet et al. 2007). Data for AFGL 2591 are taken from Preibisch et al. (2003), data for V645 Cyg are from this work. The lines show the expected dust sublimation radii for temperatures of 1000 K (dashed line) and 1500 K (solid line), warmed by direct heating with no backwarming. |
| Open with DEXTER | |
The larger component of the fit represents a much larger structure and is also much fainter. Its radius in the K-band corresponds to 251
22 AU or 5
 .
It is reasonable to suggest that the smaller component represents the dust sublimation distance, while the larger one represents the dust at 9 r1. On small scales, the disk's inner rim is brighter than the optically-thin envelope, which dominates the spatially integrated
flux from the object in the K-band (see Sect. 4.5). Therefore, we can use the calculations of Ivezic & Elitzur (1997) for such a regime that exhibit a temperature decrease of
a factor of three from T1 at this distance. Thus, the larger component can be due to the inner part of the optically thin and tenuous CS dust envelope, which can be driven away by the outflow. A
contribution from the light reflected off the dusty disk or outflow cavity cannot be excluded.
.
It is reasonable to suggest that the smaller component represents the dust sublimation distance, while the larger one represents the dust at 9 r1. On small scales, the disk's inner rim is brighter than the optically-thin envelope, which dominates the spatially integrated
flux from the object in the K-band (see Sect. 4.5). Therefore, we can use the calculations of Ivezic & Elitzur (1997) for such a regime that exhibit a temperature decrease of
a factor of three from T1 at this distance. Thus, the larger component can be due to the inner part of the optically thin and tenuous CS dust envelope, which can be driven away by the outflow. A
contribution from the light reflected off the dusty disk or outflow cavity cannot be excluded.
The angular size of V645 Cyg in the K-band is comparable to that inferred from similar speckle interferometric observations of another young massive stellar object (Obj)AFGL 2591(Obj) (Preibisch et al. 2003). The central star in AFGL 2591 is invisible due to obscuration by the CS matter, so that the inner rim of the dusty disk illuminated by stellar radiation is observed. However, these two objects have some features in common. First, their single-telescope speckle interferometric near-IR data can be more accurately fitted with a two-component model. Second, even the smaller component of these fits corresponds to linear sizes, which are the largest among those observed for young stars (see Fig. 10). They also have almost the highest luminosities of all observed objects, which agrees with expectations for the sizes. Both objects are currently understood to be massive young stars and certainly require careful monitoring to be able to follow any possible rapid evolution in their CS environments (e.g., as described in Sect. 4.3).
5 Conclusions
The new spectroscopic and speckle interferometric observations of V645 Cyg have resulted in new constraints on the object's stellar and CS parameters. The object has been resolved at near-IR wavelengths for the first time. We found that photospheric features may not be evident and detectable even at high spectral resolution and relatively high S/N ratio. Combination of the existing photometric and spectral data appear to exclude the A-type classification of V645 Cyg. The star is also unlikely to be of O-type. The line excitation level in the optical spectrum indicates that the star is within the early B-type domain (
25 000 K).
We have used a new method of distance determination based on the H I density profile along the line of sight (Foster & Macwilliams 2006) to constrain the object's location in the Galaxy. The average radial velocity of unblended Fe II lines along with the structure of the IS lines suggest a new distance of 4.2
0.2 kpc toward V645 Cyg. At this distance, the star's luminosity is most likely to be between 2
104 and 6
10
,
still in agreement with many previous estimates.
Spectral line profiles in the optical region are consistent with the presence of an opaque disk that blocks the region of the outflow where forbidden lines form, but does not affect the very inner parts where hydrogen and singly ionized metal lines originate. The CS dust is located in an optically-thick disk, which is oriented almost pole-on and dominates the radiation at
 m, and in an optically-thin tenuous envelope, which is responsible for most of
the near-IR and mid-IR radiation. This kind of distribution is consistent with the measurements of the object's size in the IR region that increases with wavelength up to
m, and in an optically-thin tenuous envelope, which is responsible for most of
the near-IR and mid-IR radiation. This kind of distribution is consistent with the measurements of the object's size in the IR region that increases with wavelength up to
 m
and decreases at longer wavelengths.
m
and decreases at longer wavelengths.
Summarizing the above analysis, we suggest that V645 Cyg is an early B-type star that recently appeared from its molecular cloud and started its main-sequence evolution. These objects are rare, because they are rather massive and evolve fast. The orientation of the CS disk ensures that V645 Cyg is unique, since many objects still surrounded by the protostellar-cloud remains are attenuated by their CS disks.
Reviewing the available data, we have revealed several interesting results that have not been reported earlier. In particular, the near-IR brightness of V645 Cyg has decreased by nearly 2 mag since the 1980's. However, our absolutely calibrated near-IR spectrum obtained in 2006 indicates that this process may be temporary. Also, the relative brightness of the N1 knot with respect to that of the star plus disk/envelope appears to have decreased significantly in the same spectral region. A correlation between the variations in the optical and near-IR brightness was suspected. We strongly recommend follow-up photometric and spectral monitoring of V645 Cyg. Photometry can easily be obtained at small telescopes, while spectroscopy, necessarily of high-resolution to search for photospheric lines and emission-line-profile variations, requires larger facilities.
Acknowledgements
A.M. thanks the Max-Planck-Society for support during his stay in Bonn. We thank the anonymous referee for the suggestions that allowed us to improve the data presentation and analysis. This publication makes use of the SIMBAD database operated at CDS, Strasbourg, France, the NSVS data base, and data products from the Two Micron All Sky Survey, which is a joint project of the University of Massachusetts and the Infrared Processing and Analysis Center/California Institute of Technology, funded by the National Aeronautics and Space Administration and the National Science Foundation.
References
- Acke, B., van den Ancker, M. E., & Dullemond, C. 2005, A&A, 436, 209 [NASA ADS] [CrossRef] [EDP Sciences] (In the text)
- Blaszkiewicz, L., & Kus, A. J. 2004, A&AS, 413, 233 [NASA ADS] (In the text)
- Bowey, J. E., Adamson, A. J., & Yates, J. A. 2003, MNRAS, 340, 1173 [NASA ADS] [CrossRef] (In the text)
- Clarke, A. J., Lumsden, S. L., Oudmaijer, R. D., et al. 2006, A&A, 457, 183 [NASA ADS] [CrossRef] [EDP Sciences] (C06) (In the text)
- Cohen, M. 1977, ApJ, 215, 533 [NASA ADS] [CrossRef] (In the text)
- Cohen, M., Walker, R. G., Barlow, M. J., & Deacon, J. R. 1992, AJ, 104, 1650 [NASA ADS] [CrossRef] (In the text)
- Coluzzi, R. 1993, Bull. CDS, 43, 7 [NASA ADS]
- Comoretto, G., Palagi, F., Cesaroni, R., et al. 1990, A&AS, 84, 179 [NASA ADS] (In the text)
- Corcoran, M., & Ray, T. P. 1998, A&A, 331, 147 [NASA ADS] (In the text)
- Di Francesco, J. D., Evans II, N. J., Harvey, P. M., et al. 1997, ApJ, 482, 433 [NASA ADS] [CrossRef] (In the text)
- Foster, T., & Macwilliams, J. 2006, ApJ, 644, 214 [NASA ADS] [CrossRef] (In the text)
- Geballe, T., & Persson, S. E. 1987, ApJ, 312, 297 [NASA ADS] [CrossRef] (In the text)
- Goodrich, R. W. 1986, ApJ, 311, 882 [NASA ADS] [CrossRef] (In the text)
- Gosnell, T. R., Hudson, H., & Puetter, R. C. 1979, AJ, 84, 538 [NASA ADS] [CrossRef] (In the text)
- Grasdalen, G. L., Gehrz, R. D., Hackwell, J. A., Castelaz, M., & Gullixson, C. 1983, ApJS, 53, 413 [NASA ADS] [CrossRef] (In the text)
- Hamann, F., & Persson, S. E. 1989, ApJ, 339, 1078 [NASA ADS] [CrossRef] (In the text)
- Hamann, F., & Persson, S. E. 1992, ApJS, 82, 285 [NASA ADS] [CrossRef] (In the text)
- Hanson, M. M., Conti, P. S., & Rieke, M. J. 2003, ApJS, 107, 281 [NASA ADS] [CrossRef] (In the text)
- Herbig, G. H. 1993, ApJ, 407, 142 [NASA ADS] [CrossRef] (In the text)
- Hodapp, K.-W. 1994, ApJS, 94, 615 [NASA ADS] [CrossRef] (In the text)
- Hoffmeister, C., Rohlfs, E., & Ahnert, P. 1951, Veröff. Sternwart. Sonneberg, 1, 5 (In the text)
- Humphreys, R. M., Merrill, K. M., & Black, J. H. 1980, ApJ, 237, L17 [NASA ADS] [CrossRef] (In the text)
- Humphreys, R. M., Lamers, H. J. G. L. M., Hoekzema, N., & Cassatella, A. 1989, A&A, 218, L17 [NASA ADS] (In the text)
- Ivezic, Z., & Elitzur, M. 1997, MNRAS, 287, 799 [NASA ADS] (In the text)
- Kholopov, P. N., Samus, N. N., et al. 1985-1990, The General Catalog of Variable Stars (Moscow, Fourth Edition) (In the text)
- Kurucz, R. L. 1994, Kurucz CD ROM 19, Solar Model Abundance Model Atmospheres, Cambridge, Smithsonian Astrophysical Observatory (In the text)
- Labeyrie, A. 1970, A&A, 6, 85 [NASA ADS] (In the text)
- Lebofsky, M. J., Kleinmann, S. G., Rieke, G. H., & Low, F. J. 1976, ApJ, 206, L157 [NASA ADS] [CrossRef] (In the text)
- Lorenzetti, D., Tommasi, E., Giannini, T., et al. 1999, A&A, 346, 604 [NASA ADS] (In the text)
- Manset, N., & Donati, J.-F. 2003, Proc. SPIE, 4843, 425 [NASA ADS] (In the text)
- Millan-Gabet, R., Malbet, F., Akeson, R., et al. 2007, in Protostars and Planets V, ed. B. Reiprth, D. Jewitt, & K. Keil (University of Arizona Press), 539 (In the text)
- Minchin, N. R., Hough, J. H., Burton, M. G., & Yamashita, T. 1991, MNRAS, 251, 522 [NASA ADS] (In the text)
- Miroshnichenko, A. S. 1998, in Fundamental Stellar Properties: The Interaction Between Observation and Theory, Proc., ed. T. R. Bedding, Publ. School of Physics, University of Sydney, Australia, IAU Symp., 189, 50 (In the text)
- Miroshnichenko, A. S., Ivezic, Z., Vinkovic, D., & Elitzur, M. 1999, ApJ, 520, L115 [NASA ADS] [CrossRef] (In the text)
- Miroshnichenko, A. S., Levato, H., Bjorkman, K. S., et al. 2004, A&A, 417, 731 [NASA ADS] [CrossRef] [EDP Sciences] (In the text)
- Monnier, J. D., & Millan-Gabet, R. 2002, 579, 694 (In the text)
- Monnier, J. D., Millan-Gabet, R., Billmeier, R., et al. 2005, ApJ, 624, 832 [NASA ADS] [CrossRef] (In the text)
- Natta, A., Palla, F., Butner, H. M., Evans II, N. J., & Harvey, P. M. 1993, ApJ, 406, 674 [NASA ADS] [CrossRef] (In the text)
- Nogichi, K., Qian, Z., Wang, G., & Wang, J. 1993, PASJ, 45, 65 [NASA ADS] (In the text)
- Palla, F., & Stahler, S. W. 1993, ApJ, 418, 414 [NASA ADS] [CrossRef] (In the text)
- Panagia, N., & Felli, M. 1975, A&A, 39, 1 [NASA ADS] (In the text)
- Panchuk, V. E., Klochkova, V. G., Yushkin, M., & Najdenov, I. D. 2007, in The UV Universe: stars from birth to death. Proceedings of the Joint Discussion No. 4 during the IAU General Assembly of 2006, ed. A. I. Gomez de Castro, & M. A. Barstow, 179 (In the text)
- Preibisch, T., Balega, Y. Y., Schertl, D., & Weigelt, G. 2003, A&A, 412, 735 [NASA ADS] [CrossRef] [EDP Sciences] (In the text)
- Rudy, R. J., Puetter, R. C., & Mazuk, S. 1999, AJ, 118, 666 [NASA ADS] [CrossRef] (In the text)
- Salas, L., Gruz-Gonzáles, I., & Tapia, M. 2006, Rev. Mex. Astron. Astrofis., 42, 273 [NASA ADS] (In the text)
- Sandell, G., & Weintraub, D. 1994, in The nature and evolutionary status of Herbig Ae/Be stars, ed. P.-S. Thé, M. R. Peréz, & E. P. J. Van den Heuvel, ASP Conf. Ser., 62, 261 (In the text)
- Savage, B. D., & Mathis, J. S. 1979, ARA&A, 17, 73 [NASA ADS] [CrossRef] (In the text)
- Skinner, S. L., Brown, A., & Stewart, R. T. 1993, ApJS, 87, 217 [NASA ADS] [CrossRef] (In the text)
- Skrutskie, M. F., Cutri, R. M., Stiening, R., et al. 2006, AJ, 131, 1163 [NASA ADS] [CrossRef] (In the text)
- Shevchenko, V. S., Grankin, K. N., Ibragimov, M. A., Melnikov, S. Y., & Yakubov, S. D. 1993, Ap&SS, 202, 121 [NASA ADS] [CrossRef] (In the text)
- Slysh, V. I.,
Val
 ts, I. E., Kalenski, S. V., et al. 1999, A&AS, 134,
115 [NASA ADS] [CrossRef] [EDP Sciences]
(In the text)
ts, I. E., Kalenski, S. V., et al. 1999, A&AS, 134,
115 [NASA ADS] [CrossRef] [EDP Sciences]
(In the text) - Sun, J., Wu, Y.-F., Mao, X.-J., & Li, S.-Z. 1991, Chin. Astron. Astrophys., 15, 375 [NASA ADS] [CrossRef] (In the text)
- Szymchak, M., Hrynek, G., & Kus, A. J. 2000, A&AS, 143, 269 [NASA ADS] [CrossRef] [EDP Sciences] (In the text)
- Testi, L., Palla, F., & Natta, A. 1998, A&AS, 133, 81 [NASA ADS] [CrossRef] [EDP Sciences] (In the text)
- Verdes-Montenegro, L., Gomez, J. F., Torrelles, J. M., et al. 1991, A&A, 244, 84 [NASA ADS] (In the text)
- Walker, R. G., & Price, S. D. 1975, AFCRL Infrared Sky survey, Vol. 1, AFCRL Environmental Research Paper, 522 (In the text)
- Whitney, B. A., Wood, K., Bjorkman, J. E., & Wolff, M. J. 2003, ApJ, 591, 1049 [NASA ADS] [CrossRef] (In the text)
- Wozniak, P. R., Vestrand, W. T., Akerlof, C. W., et al. 2004, AJ, 127, 2436 [NASA ADS] [CrossRef] (In the text)
Footnotes
- ... V645 Cygni
- Partially based on data obtained at the 6-m BTA telescope of the Russian Academy of Sciences, 3.6-m Canada-France-Hawaii telescope, and 3-m Shane telescope of the Lick Observatory.
All Tables
Table 1: Published results for the nature and evolutionary state of V645 Cyg.
Table 2: Details of the speckle interferometry observations.
Table 3: Two-component fit diameters (Gaussian functions).
Table 4: Two-component fit diameters (ring functions).
Table 5: Line identification in the optical spectrum of V645 Cyg.
All Figures
| |
Figure 1: Measured diffraction-limited two-dimensional visibilities of V645 Cyg in the H-band ( top left) and K-band ( top right) as a function of spatial frequency in cycles/arcsec on both axes. Radial dependence of the azimuthally averaged two-dimensional visibilities is shown together with one-component Gaussian and uniform disc (UD) fits ( middle panels) as well as two-component Gaussian fits ( lower panels). The H-band data are presented in the left column, and the K-band data in the right column. The fit range is up to the telescope cut-off frequency. The numbers are the FWHM diameters of the large/small component of the two-component model (see Table 3). |
| Open with DEXTER | |
| In the text | |
| |
Figure 2: Visibilities of the best-fitting two-component models consisting of two centered rings fitted to the azimuthally averaged measured visibilities. The thickness of each ring was assumed to be 20% of the ring diameter. The fit range is up to the telescope cut-off frequency. The listed numbers are the diameters of the large/small component of the two-component model (see Table 4). |
| Open with DEXTER | |
| In the text | |
| |
Figure 3:
Portions of our CFHT and SAO spectra of V645 Cyg. All the portions are from the CFHT spectrum, except for the weaker H |
| Open with DEXTER | |
| In the text | |
| |
Figure 4: Red part of the CFHT spectrum of V645 Cyg. The three strong unmarked lines are blends of the IR Ca I triplet and hydrogen lines of the Paschen series. The intensity is normalized to nearby continuum, and the wavelengths are heliocentric. |
| Open with DEXTER | |
| In the text | |
| |
Figure 5: Blueshifted forbidden lines in the CFHT spectrum of V645 Cyg. The sharp emission components on the red wings of the [O I] lines are telluric. The intensity is normalized to nearby continuum. The velocity scales is heliocentric. Similar profiles were presented by Hamann & Persson (1989) for the [S II] lines and by Acke et al. (2005) for the [O I] lines. |
| Open with DEXTER | |
| In the text | |
| |
Figure 6:
DIBs and sodium lines in the CFHT spectrum of V645 Cyg. Position of the He I |
| Open with DEXTER | |
| In the text | |
| |
Figure 7:
The SED of V645 Cyg. Optical and near-IR ground-based photometric data are shown by filled circles, our calibrated low-resolution spectrum by the solid line, the ISO fluxes at
selected wavelengths by open triangles, MSX data by filled squares, IRAS fluxes by filled triangles, and millimetric and radio fluxes by open squares. The SED is dereddened with E(B-V) = 1.3 mag and a standard IS reddening law from Savage & Mathis (1979). The dashed line represents a Kurucz (1994) model atmosphere for
|
| Open with DEXTER | |
| In the text | |
| |
Figure 8: Optical and near-IR light curves of V645 Cyg. The observations obtained at the Maidanak observatory and published by Shevchenko et al. (1993) are shown by open circles. The observations from the NSVS survey (Wozniak et al. 2004) and color-corrected using the mean B-V color from the Maidanak data are shown by pluses. The K-band data are collected from the literature and described in the text. The last data point (2006) on the K-band light curve represents our near-IR spectrum. The time is shown in modified Julian dates MJD = JD-2 400 000. |
| Open with DEXTER | |
| In the text | |
| |
Figure 9: Mid-IR part of the SED of V645 Cyg. Symbols: solid line - ISO SWS data, open circles - IRAS LRS data, triangles - MSX data, filled squares - ground-based photometry from Salas et al. 2006), asterisks - ground-based photometry from Lebofsky et al. (1976). The observed scatter is most likely due to uncertainties in absolute calibration. |
| Open with DEXTER | |
| In the text | |
| |
Figure 10: Measured sizes of Herbig Ae (filled circles) and Herbig Be (open circles) stars plotted versus their luminosity (adopted from Millan-Gabet et al. 2007). Data for AFGL 2591 are taken from Preibisch et al. (2003), data for V645 Cyg are from this work. The lines show the expected dust sublimation radii for temperatures of 1000 K (dashed line) and 1500 K (solid line), warmed by direct heating with no backwarming. |
| Open with DEXTER | |
| In the text | |
Copyright ESO 2009
Current usage metrics show cumulative count of Article Views (full-text article views including HTML views, PDF and ePub downloads, according to the available data) and Abstracts Views on Vision4Press platform.
Data correspond to usage on the plateform after 2015. The current usage metrics is available 48-96 hours after online publication and is updated daily on week days.
Initial download of the metrics may take a while.