| Issue |
A&A
Volume 497, Number 2, April II 2009
|
|
|---|---|---|
| Page(s) | 469 - 480 | |
| Section | Stellar structure and evolution | |
| DOI | https://doi.org/10.1051/0004-6361/200811432 | |
| Published online | 24 February 2009 | |
Long tails on thermonuclear X-ray bursts from neutron stars: a signature of inward heating?
J. J. M. in 't Zand1 - L. Keek1,2 - A. Cumming3 - A. Heger4 - J. Homan5 - M. Méndez6
1 - SRON Netherlands Institute for Space Research, Sorbonnelaan 2,
3584 CA Utrecht, The Netherlands
2 -
Astronomical Institute, Utrecht University, PO Box 80000,
3508 TA Utrecht, The Netherlands
3 -
Physics Department, McGill University, 3600 Rue University,
Montreal, QC, H3A 2T8, Canada
4 -
School of Physics & Astronomy, University of Minnesota,
Twin Cities, Minneapolis, MN 55455, USA
5 -
MIT Kavli Institute for Astrophysics and Space Research,
70 Vassar Street, Cambridge, MA 02139, USA
6 -
Kapteyn Astronomical Institute, Groningen University,
9700 AV Groningen, The Netherlands
Received 27 November 2008 / Accepted 26 January 2009
Abstract
We report the discovery of one-hour long tails on the few-minutes long X-ray bursts from the ``clocked burster'' GS 1826-24. We propose that the tails are due to enduring thermal radiation from
the neutron star envelope. The enduring emission can be explained by cooling of deeper neutron star layers that were heated up through inward conduction of heat produced in the thermonuclear shell flash responsible for the burst. Similar, though somewhat shorter, tails are seen in bursts from EXO 0748-676 and 4U 1728-34. Only a small amount of cooling is detected in all these tails. This is either due to compton upscattering of the tail photons or, more likely, to a neutron star that is already fairly hot due to other stable nuclear processes.
Key words: X-rays: binaries - X-rays: bursts - accretion, accretion disks - stars: neutron - X-rays: individual: GS 1826-24 - X-rays: individual: EXO 0748-676 - X-rays: individual: 4U 1728-34 = GX354-0
1 Introduction
Type-I X-ray bursts, or X-ray bursts in short, result from thermonuclear shell flashes of hydrogen and helium on neutron stars (NSs). The fuel is accreted from a Roche-lobe-filling companion
star. As the accretion of this material progresses, the pressure at the bottom of the accreted layer rises to ignition conditions for thermonuclear fusion processes like the (hot,  -decay limited) CNO cycle, triple-
 process, -proton capture and the (-decay limited) rapid-proton capture (rp) process. In general, the fuel is burnt within 1 s in the top few meters of the NS and temperatures momentarily reach values as high as a few GK. The layer is covered by a non-burning layer, on top of which is the photosphere. What one measures is the cooling flux passing through the photosphere, with temperatures peaking at about 30 MK. The burst duration is primarily determined by the time it takes to cool the shell. For H-rich flashes, the duration is further lengthened due to prolonged nuclear burning through the rp process. The burst duration may range from a few seconds to a few hundred seconds for the large majority of X-ray bursts. Exceptional durations come from very thick helium layers on relatively cold NSs in hydrogen-poor ultracompact
X-ray binaries (i.e., up to thousands of seconds; e.g.,
Cumming et al. 2006; in 't Zand et al. 2007,2005) and flashes of very thick carbon shells (``superbursts''; e.g., Cumming & Bildsten 2001; Strohmayer & Brown 2002; Cornelisse et al. 2000). For reviews on X-ray bursts and further references, we refer to Lewin et al. (1993), Bildsten (1998) and Strohmayer & Bildsten (2006).
process, -proton capture and the (-decay limited) rapid-proton capture (rp) process. In general, the fuel is burnt within 1 s in the top few meters of the NS and temperatures momentarily reach values as high as a few GK. The layer is covered by a non-burning layer, on top of which is the photosphere. What one measures is the cooling flux passing through the photosphere, with temperatures peaking at about 30 MK. The burst duration is primarily determined by the time it takes to cool the shell. For H-rich flashes, the duration is further lengthened due to prolonged nuclear burning through the rp process. The burst duration may range from a few seconds to a few hundred seconds for the large majority of X-ray bursts. Exceptional durations come from very thick helium layers on relatively cold NSs in hydrogen-poor ultracompact
X-ray binaries (i.e., up to thousands of seconds; e.g.,
Cumming et al. 2006; in 't Zand et al. 2007,2005) and flashes of very thick carbon shells (``superbursts''; e.g., Cumming & Bildsten 2001; Strohmayer & Brown 2002; Cornelisse et al. 2000). For reviews on X-ray bursts and further references, we refer to Lewin et al. (1993), Bildsten (1998) and Strohmayer & Bildsten (2006).
Sometimes very long tails are seen in X-ray bursts that are not related to the aforementioned long bursts. For instance, Chenevez et al. (2006) discuss a peculiar burst from GX 3+1. Since the advent of X-ray
astronomy, about 100 bursts have been detected from this source (e.g., den Hartog et al. 2003) and all are shorter than a few tens of seconds except for this peculiar burst. It has a prolonged tail that
starts at about 25% of the ordinary burst peak flux and decays with an e-folding decay time of 1110 s (for photons between 3 and 6 keV). Chenevez et al. (2006) hypothesize that the tail is due to rp capture of a rich hydrogen mixture that became available after the accretion rate dropped below the threshold where hydrogen is burnt in a stable manner (GX 3+1 was in a 10-yr minimum at about the time of the burst). However, the time scales of the slowest
decays expected in X-ray bursts are at least one order of magnitude shorter than 1110 s (e.g., Fisker et al. 2008). A few similar cases (i.e., from systems that are clearly not ultracompact X-ray binaries) are described in the literature, most notably in Czerny et al. (1987) and Gotthelf & Kulkarni (1997). There is a clear duality in the time profile of these bursts: they start with an ordinary short-lived burst, followed by a 102-3 s long tail without an unambiguous cooling signature. The long tail starts off quite brightly in these bursts, at a few tens of percents of the burst peak flux. Since the nature of these long tails
is not well established, it is worthwhile exploring whether there are long tails that start off at a lower fraction of the burst peak (i.e., percents instead of tens of percents).
Burst studies usually concentrate on the brightest parts, roughly above 1% of the peak flux (which is often close to the Eddington limit, see Galloway et al. 2008), and for a good reason. Most bursts come from prolific bursters with mass accretion rates above the same 1% level. Since accretion is notoriously variable, this makes disentangling burst radiation from accretion radiation difficult at fluxes below 1% of the Eddington limit.
Exceptions are bursts from NSs that accrete at rates below 1% of the Eddington limit. This pertains to most persistently accreting ultracompact X-ray binaries (UCXBs; a nice example of a burst that could be studied with Swift to very deep levels originates in A 1246-588; in 't Zand et al. 2008) and bursts from transients whose accretion rate has dwindled down to low but non-zero values (e.g., in 't Zand et al. 2003). These exceptions show tails that are natural extensions of the decays of the bright parts of the same X-ray bursts. In other words: there is no prompt/tail duality.
Despite the fact that it is difficult to study bursts at sub-1% levels in fast-accreting bursters, the situation is sometimes not desperate. This paper presents a study of the unique burster
GS 1826-24. The accretion is very stable in this source. The variability on a time scale of the burst recurrence time (few hours) is about 2% rms, so that the recurrence time from burst to burst is relatively stable as are the burst peak flux and profile (Heger et al. 2007; Cocchi et al. 2001; Ubertini et al. 1999; Galloway et al. 2004). This behavior earned it nicknames such as ``the clocked burster'' (Ubertini et al. 1999) and ``the textbook burster'' (Bildsten 2000). GS 1826-24 is also notable for a high-energy component of the burst emission (i.e., above 30 keV where negigible amounts of black body emission are expected; in 't Zand et al. 1999). Because of its stable bursting behavior and accretion rate, GS 1826-24 is excellently suited for low-level burst flux studies. The most recent distance determination is 6.07  0.18 kpc (for isotropic burst radiation; Heger et al. 2007).
The existence of long tails in GS 1826-24 was already implied in in 't Zand et al. (1999) and Thompson et al. (2005). The latter work concentrated on the persistent spectrum as measured with Chandra and RXTE. This emission could be successfully modeled by a combination of two comptonization components (see also Thompson et al. 2008) due to the presence of hot plasmas in the immediate neighborhood of the NS. Bursts were studied as well, and their spectra could be modeled by a black body component plus the variation of one of the persistent comptonization components. This is in line with the high-energy burst emission seen by in 't Zand et al. (1999) and in contrast with the so-called ``standard'' modeling of burst spectra where the burst emission is modeled solely by one black body component and the persistent spectrum is unaffected by the burst emission. A simple physical interpretation of the change of one comptonization component would be that a hot plasma up-scatters some of the burst thermal photons to higher energies and itself is cooled down by the soft photons. This model was applied to 1000 s of burst data in Thompson et al. (2005). The final 850 s of the data were modeled by comptonization only.
In this paper we make a study of the long tail in GS 1826-24 employing all RXTE data available and cross checking with XMM-Newton data. Thus, we obtain a superior statistical quality and are able to probe the tail longer than Thompson et al. (2005). We supplement this analysis with briefer investigations of two other prolific bursters, EXO 0748-676 and 4U 1728-34. We propose an explanation for the tail.
2 Observations
We use data from the Proportional Counter Array (PCA) on the Rossi X-ray Timing Explorer (RXTE) and the European Photon Imaging p-n junction camera (EPIC-pn) on the XMM-Newton observatory. These data sets were chosen because they are complementary in photon energy bandpass (2-60 and 0.1-12 keV, respectively) with similar sensitivities and because they detected more than 10 X-ray bursts each.
Table 1: Selection of X-ray bursts from GS 1826-24 studied here. For more details, see Galloway et al. (2008).
The PCA comprises 5 identical proportional counter units (PCUs) with a total net collecting detector area of about 8000 cm2 in the 2-60 keV band (3-20 keV is well calibrated; Jahoda et al. 2006). During any observation any number of PCUs between 1 and 5 are on. The PCA is a non-imaging device with a spectral resolution of 20% (full width at half maximum; FWHM) and a 2 degree wide field of view (full width to zero response). There are no other bright X-ray sources in the field around GS 1826-24.
RXTE is particularly suited for the study of low-mass X-ray binaries, and since its 1995 launch has accumulated unprecedented exposure times on many X-ray bursters, one of them being GS 1826-24. Galloway et al. (2008) compiled a catalog of all bursts detected between Feb. 8, 1996, and June 3, 2007. The total PCA exposure time on GS 1826-24 over 127 observations in this time frame is 929 ks. 65 bursts were detected between Nov. 5, 1997, and March 10, 2007, and the mean burst rate was 0.25 h-1. None of the bursts exhibit evidence for photospheric radius expansion, so that the peak luminosity must have been below the Eddington limit. The bolometric absorption-corrected peak flux ranged
between 23.5
0.8 and

 10-9 erg cm-2 s-1 and the fluence between 0.923
0.016 and
10-9 erg cm-2 s-1 and the fluence between 0.923
0.016 and
 10-6 erg cm-2 (Galloway et al. 2008). The decay can be modeled by two subsequent exponential decays. The e-folding decay times ranged between 12.9 and 23.3 s for the first decay and between 40.5 and 57.2 s for the second decay. The average time scale for the decay (defined as the fluence divided by the peak flux) is between 30 and 45 s, which implies that the 0.1% level is reached within 400 s.
XMM-Newton observed GS 1826-24 on two occasions: starting on April 6, 2003, for 108 ks and April 8, 2003, for 92 ks. A complete account of these observations is provided in Kong et al. (2007). Nine X-ray bursts were detected in the first and seven in the second observation. The final bursts in each observation suffered from high background levels and were excluded from the analysis. All X-ray detectors were on, but we concentrate on the 0.1-12 keV EPIC-pn measurements because that
instrument (Strüder et al. 2001) is by far the most sensitive for our analysis. It has an effective area that ranges between 1000-3000 cm2 for 0.5-2 keV and 900 cm2 at 2-6 keV. The spectral
resolution is 2.5% (FWHM) at 6 keV. The instrument was switched to Fast Timing mode, implying that the central CCD (of the 12 available), encompassing 13
 6
4
4 of the field of view, is read out 1-dimensionally (along the 4
4 side) at a 1.5 ms resolution. Source photons were extracted between RAWX values of 30 and 45, with pixel patterns below 5 and grade 0; background photons were extracted between RAWX = 10 and 25. We refer to Kong et al. (2007)
for further details, noting that SAS version 7.1.0 was employed for our data analysis.
6
4
4 of the field of view, is read out 1-dimensionally (along the 4
4 side) at a 1.5 ms resolution. Source photons were extracted between RAWX values of 30 and 45, with pixel patterns below 5 and grade 0; background photons were extracted between RAWX = 10 and 25. We refer to Kong et al. (2007)
for further details, noting that SAS version 7.1.0 was employed for our data analysis.
![\begin{figure}
\par\includegraphics[angle=270,width=9cm,clip]{1432f1.ps}
\end{figure}](/articles/aa/full_html/2009/14/aa11432-08/img19.png) |
Figure 1: Average time profile of 29 X-ray bursts from GS 1826-24 as measured with PCU2 on RXTE/PCA, in two photon-energy bandpasses and at logarithmically scaled resolution. |
| Open with DEXTER | |
3 Data analysis
![\begin{figure}
\par\includegraphics[angle=270,width=9cm,clip]{1432f2.ps}
\end{figure}](/articles/aa/full_html/2009/14/aa11432-08/img20.png) |
Figure 2:
Average time profile of 29 X-ray bursts from GS 1826-24 as measured with PCU2 on RXTE/PCA in 2-9 keV and at logarithmically scaled resolution, together with an exponential decay function (smooth curve) as fitted between 600 and 5500 s ( |
| Open with DEXTER | |
 s; see Table
![\begin{figure}
\par\includegraphics[angle=270,width=9cm,clip]{1432f3.ps}
\par\end{figure}](/articles/aa/full_html/2009/14/aa11432-08/img21.png) |
Figure 3:
Average time profile of 14 X-ray bursts from GS 1826-24 as
measured with XMM/EPIC, in one bandpass and at a logarithmically scaled resolution. The count rate scaling is different from Fig. 1 due to the different time resolution at
the peak and the occurrence of saturation effects in the XMM-Newton data. The smooth curve shows an exponential function, fitted between 600 and 3000 s. The decay time was found to be |
| Open with DEXTER | |
 ), so this result is only indicative.
We selected 29 out of the 65 PCA-detected bursts that have data available between 4000 and 1000 s before the burst start and between 400 and 3000 s afterwards, see Table 1. The pre-burst interval was based on the general trend that the flux was lowest there and should provide the best estimate of the accretion flux. We processed the data of the 29 bursts to an average light curve as follows. Taking the ``standard-products'' light curves as starting point (these are data from PCU2 in 5 energy bands, corrected for particle-induced background and with a resolution of 16 s) we determined the pre-burst flux level from data between 4000 and 1000 s prior to the burst (note that data gaps are common in this 3000 s time frame), subtracted that from all flux measurements, co-aligned the data at the start time of the burst (defined as the time when the photon flux exceeds 25% of the peak flux; Galloway et al. 2008) and averaged all bursts. Figure 1 shows the resulting profiles in 2 to 4 and 4 to 9 keV, normalized to the peak flux. Apart from the well-known burst profile with a duration of about 400 s, it shows the striking appearance of an additional burst component that lasts approximately ten times longer at flux levels between 10-3 and 10-2 times the burst peak value. A comparison with higher time-resolution data shows that the averaging of the peak in 16 s time bins lowers the peak flux by approximately a factor of 2. While the initial decay of the profile shows the classical cooling of the bursts (the high-energy flux decaying faster than the low-energy flux), the slow decay does not show obvious cooling.
![\begin{figure}
\par\includegraphics[width=8.5cm,clip]{1432f4.ps}
\end{figure}](/articles/aa/full_html/2009/14/aa11432-08/img22.png) |
Figure 4:
Modeling results for time-resolved PCA burst spectra of average of 17 bursts. The model consists of a black body and power-law component absorbed by a fixed column of
|
| Open with DEXTER | |
![\begin{figure}
\par\includegraphics[width=8.55cm,clip]{1432f5.ps} %\end{figure}](/articles/aa/full_html/2009/14/aa11432-08/img23.png) |
Figure 5:
Modeling results for time-resolved 0.7-10 keV burst spectra
of 14 bursts detected XMM-Newton observation. Spectral channels were binned so that each bin contains at least 15 photons. The number of degrees of freedom ranges between roughly 500 and 2000 (for 2 spectra, one for each observation) which explains the small scatter in
|
| Open with DEXTER | |
The data can be described satisfactorily by an exponential decay function between 600 and 5500 s. For the 2-9 keV time profile the fit is shown in Fig. 2. the decay time is 1252
25 s (
 ). Resolved in the two bands the e-folding decay times are 1261
29 s in 2-4 keV (
). Resolved in the two bands the e-folding decay times are 1261
29 s in 2-4 keV (
 )
and 1381
29 in 4-9 keV (as measured between 600 and 3500 s after burst onset for lack of statistics beyond 3500 s;
)
and 1381
29 in 4-9 keV (as measured between 600 and 3500 s after burst onset for lack of statistics beyond 3500 s;
 ). Since it is expected that cooling by thermal/photon diffusion follows
a power law (Eichler & Cheng 1989a) we fitted such a law and find, between 300 and 2300 s, a power law index of -0.93 0.02.
). Since it is expected that cooling by thermal/photon diffusion follows
a power law (Eichler & Cheng 1989a) we fitted such a law and find, between 300 and 2300 s, a power law index of -0.93 0.02.
We sought verification of the long tail in data from the XMM-Newton observations. Figure 3 shows the 2-9 keV light curve, averaged over 14 out of the 16 X-ray bursts (leaving out the last burst of each observation, being compromised by increased background levels). The same long tail is seen as with RXTE. The e-folding decay time is  26 s between 600 and 2400 s which is similar as for the RXTE curve. A tail is also seen in data
below 2 keV, but the statistics are not so good to reveal it beyond 103 s. The e-folding decay time in this low-energy bandpass is 524
172 s between 400 and 1000 s, which at least shows that it is not longer than for the 2-9 keV band.
26 s between 600 and 2400 s which is similar as for the RXTE curve. A tail is also seen in data
below 2 keV, but the statistics are not so good to reveal it beyond 103 s. The e-folding decay time in this low-energy bandpass is 524
172 s between 400 and 1000 s, which at least shows that it is not longer than for the 2-9 keV band.
We performed time-resolved spectroscopy. Spectra were accumulated for 17 bursts that have small off-axis angles in the PCA and have identical detector-voltage settings (i.e., they are said to be in the same ``gain epoch''; see specification in Table 1). Only PCU2 data were employed to obtain a homogeneous data set. The time resolution of the spectral extraction was chosen to vary between 1 s early on in the burst and 200 s at the end. Each burst was divided in 72 time bins that are identical with respect to the burst start times. Spectra were extracted from event mode data with s/w tool seextrct for these time intervals and corrected for the particle-induced background as determined with pcabackest in the same time interval. For each burst, a pre-burst spectrum was generated from data available between 4000 and 1000 s prior to the burst, which also was corrected for particle-induced background. Subsequently the spectra for all 17 bursts were averaged in their respective time frames, and the average pre-burst spectrum was subtracted from the 72 burst spectra. These spectra were, between 4 and 20 keV, modeled with a simple absorbed black body function, employing a fixed absorption column of
 1021 cm-2 (see XMM-Newton analysis below). The photo-absorption cross sections were taken from Baucinska-Church & McCammon (1992) and the composition of the absorbing material from Wilms et al. (2000). About half of the spectra (in the brightest phase) turn out not to be consistent with this model and an additional power-law component with a fixed index (equal to that of the pre-burst data) was included in the model. The fitted values for the various black body parameters are shown in Fig. 4. All time intervals are well fitted. During the first 100 s the black body parameters are as expected for an X-ray burst: a temperature peaking at an equivalent of 2.3 keV and gradually decreasing after that, and an emission area that remains approximately constant after the rise phase. However, after 100 s the picture changes: the inferred emission area decreases
sharply by at least an order of magnitude. The bolometric unabsorbed fluence in the 300-1500 s time frame is 3.4
10-8 erg cm-2. This is about 3% of the fluence in
the prompt burst (Galloway et al. 2008).
1021 cm-2 (see XMM-Newton analysis below). The photo-absorption cross sections were taken from Baucinska-Church & McCammon (1992) and the composition of the absorbing material from Wilms et al. (2000). About half of the spectra (in the brightest phase) turn out not to be consistent with this model and an additional power-law component with a fixed index (equal to that of the pre-burst data) was included in the model. The fitted values for the various black body parameters are shown in Fig. 4. All time intervals are well fitted. During the first 100 s the black body parameters are as expected for an X-ray burst: a temperature peaking at an equivalent of 2.3 keV and gradually decreasing after that, and an emission area that remains approximately constant after the rise phase. However, after 100 s the picture changes: the inferred emission area decreases
sharply by at least an order of magnitude. The bolometric unabsorbed fluence in the 300-1500 s time frame is 3.4
10-8 erg cm-2. This is about 3% of the fluence in
the prompt burst (Galloway et al. 2008).
![\begin{figure}
\par\includegraphics[angle=270,width=9cm,clip]{1432f6.ps}
\end{figure}](/articles/aa/full_html/2009/14/aa11432-08/img27.png) |
Figure 6: Geometrically binned Fourier power density difference spectrum between pre-burst and tail data (in formula: tail pds minus pre-burst pds divided by pre-burst pds). |
| Open with DEXTER | |
A similar time-resolved spectral analysis was performed XMM-Newton data from the 14 low-background bursts, except that this involves an analysis of 0.7-10 keV photons and channels were binned to make sure that the number of photons per bin was in excess of 15 to ensure applicability of the  statistic (such a procedure was not necessary for the RXTE data). Prior to the burst spectral modeling we modeled the pre-burst data to find
  and the photon index to
apply to the burst data. These are
1021 cm-2 and
and the photon index to
apply to the burst data. These are
1021 cm-2 and
 (
(
 for
for  over two spectra, for a systematic uncertainty per bin
of 2%). The results of the burst spectra modeling (Fig. 5) are generally consistent with the RXTE results, except at the start and at the end of tail (beyond about 1000 s after burst onset) where a comparison becomes difficult because of statistical issues. This shows that the drop in radius at 100 s as seen with RXTE is not related to the lack of low-energy coverage of that instrument since it is also seen with XMM-Newton for which the bandpass is extended with the 0.7-4.0 keV photon energy range.
over two spectra, for a systematic uncertainty per bin
of 2%). The results of the burst spectra modeling (Fig. 5) are generally consistent with the RXTE results, except at the start and at the end of tail (beyond about 1000 s after burst onset) where a comparison becomes difficult because of statistical issues. This shows that the drop in radius at 100 s as seen with RXTE is not related to the lack of low-energy coverage of that instrument since it is also seen with XMM-Newton for which the bandpass is extended with the 0.7-4.0 keV photon energy range.
![\begin{figure}
\par\includegraphics[width=8.5cm,clip]{1432f7.ps}
\end{figure}](/articles/aa/full_html/2009/14/aa11432-08/img32.png) |
Figure 7:
Modeling results for time-resolved PCA burst spectra of average of 36 bursts from 4U 1728-34. The model consists of a black body and power-law component absorbed by a fixed column of
|
| Open with DEXTER | |

We studied the timing properties of the tail in comparison to those of the pre-burst data. Fourier power density spectra were generated of data in the pre-burst -4000/-1000 s time frame and in the tail +1000/+3000 s time frame. Event mode data were employed at a time resolution of 2-11 s (roughly 0.5 ms), as long as they were available (see Table 1). Power spectra were made in 1968 8-s data stretches for the pre-burst data and averaged, and for 2574 8-s data stretches in the tail data and averaged. Out of the FTOOL package vs. 6.5, powspec was employed for this purpose. The relative difference between these two average power spectra is presented in Fig. 6. There is no difference between both spectra, indicating that nothing significantly changed in the accretion stream between these periods.
4 Other bursters
We checked the average burst profiles of other known prolific bursters in the PCA data archive, employing the RXTE bursts catalog (Galloway et al. 2008). Most of these have variable accretion fluxes and are, therefore, difficult to analyze for the reasons discussed in the introduction. Nevertheless, they sometimes indicate long tails, although never as long as in GS 1826-24. In this section we report briefly two cases.
4.1 4U 1728-34 = GX 354-0
4U 1728-34 was observed 346 times for a total PCA exposure time of 1.94 Ms and a total of 106 bursts were detected; a large portion of these, 69, show photospheric radius expansion. All bursts are short and have time scales between 4.4 and 8.7 s (Galloway et al. 2008). 40 bursts have good coverage and are not within too wild accretion flux variations to search for a tail. It turns out that the average
profile of these bursts extends to about 800 s which is 102 times longer than the initial burst phase. The exponential decay times are 477
80 s for 2-4 keV, 314
26 s for 4-9 keV (between 300 and 800 s) and 306
12 s for 2-9 keV. A power-law fit to the tail in
the latter bandpass between 100 and 800 s yields a decay index of 1.17 0.02.
We performed time-resolved spectroscopy in a similar manner as for GS 1826-24 (i.e., the persistent flux as determined from pre-burst data was subtracted prior to the spectral modelling). There was no need to include a power law. 36 bursts were selected for this procedure and only PCU2 data were employed. Since there is no majority within one RXTE PCA gain epoch, we employed bursts from epochs 3a, 3b, 4 and 5, averaged them per gain epoch, modeled per gain epoch and averaged the
fitted parameters over the epochs per time bin. A warning is appropriate here: the bursts in 4U 1728-34 vary more than in GS 1826-24; averaging them will smooth out short features. The results yield the profiles in Fig. 7 (
 was averaged as well; although that number does not adhere to statistical properties, it does give a sense of the overall quality of the fit per bin). The bolometric flux can be followed downward over 3 decades. It has a smoother evolution than for GS 1826-24, possibly because the Eddington limit is reached for most bursts so that the flux flattens against a ceiling representing that limit. Furthermore noticeable is the drop in radius beyond 10 s, a similar effect as seen in GS 1826-24 beyond 100 s. The fluence of the tail is 9% of that of the prompt emission, taking 100 s as the boundary between prompt burst and burst tail. We scale the boundary with the decay time
  of the latter part of the prompt burst (see Table 2, as read from Galloway et al. 2008).
4.2 EXO 0748-676
EXO 0748-676 is well known for the accretion-disk edge-on line of sight, causing eclipses and dips every orbital period of 3.8 h (Parmar et al. 1986), and also for exhibiting very short burst recurrence times in certain accretion rate regimes. Boirin et al. (2007) discovered with XMM-Newton that there are times when this source exhibits 3 bursts in a row within only half an hour. The first burst in such a ``triplet'' always shows a longer tail than the subsequent bursts. In the average burst profiles the e-folding decay time is about 2.5 times longer for the first bursts than for the subsequent bursts (50-55 s versus 14-19 s).
RXTE observed EXO 0748-676 ninety-four times for a total exposure of 1.39 Ms. Eighty-four bursts were detected. However, many of these observations were concentrated on catching eclipses and, thus, involve only shorter time stretches rendering burst tail studies impossible. Also, the bursts are rather weak so that multiple PCUs are needed to perform meaningful analyses. Rather, we employ XMM-Newton data to determine average burst profiles. EXO 0748-676 is the burster which, with XMM-Newton, was most intensely observed. In 158 h of exposure investigated by Boirin et al. (2007) there are 33 singlet bursts detected, next to 14 doublets and 5 triplets. We determined average time profiles of 31 singlets that are not affected by eclipses or dips within 2000 s, in the same bandpasses as for the RXTE data for GS 1826-24 and 4U 1728-34. These also show a long tail. The
exponential decay times are 266
122 s and 260
120 s for 2-4 and 4-9 keV respectively. Again no clear cooling is observed in this tail. The equivalent power-law decay index is 2.1
0.8 for 2-4 keV and 1.6
0.8 for 4-9 keV.
![\begin{figure}
\par\includegraphics[angle=270,width=9cm,clip]{1432f8.ps}
\end{figure}](/articles/aa/full_html/2009/14/aa11432-08/img34.png) |
Figure 8: Light curve of triple burst from EXO 0748-676 seen on September 12, 2006, at 16:30:36 UT (ObsID 92013-01-03-000). The peaks of the bursts are truncated to zoom in on the long tail of the first burst. The peak fluxes of the 3 bursts are 785.5, 462.1 and 86.8 c/s. The horizontal line is plotted as a reference for the out-of-burst flux. |
| Open with DEXTER | |
![\begin{figure}
\par\includegraphics[width=8.5cm,clip]{1432f9.ps}
\end{figure}](/articles/aa/full_html/2009/14/aa11432-08/img35.png) |
Figure 9:
Time-resolved spectroscopy of the triple burst from EXO 0748-676. A pre-burst spectrum was subtracted before fitting the spectra with an absorbed black body model with
|
| Open with DEXTER | |

RXTE data do show at least one interesting burst. It is a burst triplet that occurred on September 12, 2006 (onset of first burst at 16:30:36 UT). The light curve, as extracted from standard 2 data in ObsID 92013-01-03-000, is presented in Fig. 8. Standard-2 data from PCUs 0, 2 and 3 were added within 2.0-7.3 keV and the time resolution of these data is 16 s. The results of time-resolved spectroscopy are shown in Fig. 9. The unabsorbed bolometric fluence ratio over the 3 bursts is 5:1:1/10 (for the first burst accumulating fluence over only the first 300 s, so excluding the long tail). The light curve clearly shows a long tail to the first burst. The e-folding decay time is 300
42 s (measured between 400 and 1200 s after burst onset and excluding the prompt flux of the 2nd burst). This is similar as found in the average XMM-Newton burst profile. The fluence in the tail, excluding the three bursts, is 4.5
10-9 erg cm-2 which is 1.2
0.1% of the prompt emission from the first burst (taking 300 s as the boundary between both). It is interesting to note that, in the bolometric flux, there is no clear boundary between the long tail in this triple burst and the prompt burst, in the sense that there is no excess of the early emission above the backward extrapolation of the tail. This is contrast to the situation for GS 1826-24 (cf., Fig. 4 top panel). The same applies to 4U 1728-34 (Fig. 7).
What is most remarkable about this long tail is that it is seemingly unaffected by the occurrence of the second burst. The tail progresses undisturbed along the same decay curve. This suggests that the first burst and its tail emission have a different origin in the NS envelope than the second burst, either a different layer or a different locality on the surface. However, this is not testable: the fluence of the second burst is five times smaller than that of the first. If the tail would be proportionally shorter, the statistical significance of it will have dropped below the detection threshold.
5 Discussion
Our measurements are summarized in Table 2. We find that X-ray bursts from GS 1826-24 show a long tail. In other words, they exhibit a dual time profile with a prompt burst phase lasting a few hundred seconds and a tail phase with an e-folding decay time of 103 s, a flux level of less than  1% of the peak flux and a fluence that is 3% of that of prompt burst. Beyond the first 200 s the spectrum can be modeled by a black body with a very slowly decreasing temperature of 0.9 keV and a strongly decreasing emission area. We find similar tails in RXTE data of 4U 1728-34 and RXTE and XMM-Newton data of EXO 0748-676, although the contrast between prompt and tail phase is less pronounced in those cases. Generally the detection of tails is difficult because of confusion with variable accretion radiation. Still, bright pronounced tails have been reported in the literature for a few individual bursts. The two most obvious questions about the long tails are: what is the physical cause and why is hardly any cooling detected? We investigate the first question in Sect. 5.1, keeping in mind only GS 1826-24. In Sect. 5.2 we touch on the second question, considering 4U 1728-34 and EXO 0748-676 as well. In Sect. 5.3 we compare GS 1826-24 with the other cases listed in Table 2.
Table 2: Summary of measurements.
![\begin{figure}
\par\includegraphics[width=8.5cm,clip]{1432f10.ps}
\end{figure}](/articles/aa/full_html/2009/14/aa11432-08/img48.png) |
Figure 10: Average observed (red histogram) and predicted (solid) time profiles of bolometric flux, after normalization at the respective peak values and alignment at the peak. The vertical dashed lines indicate the times for the depth profiles plotted in Fig. 11. The inset shows the model on a broader and linear time scale, exhibiting the slow luminosity increase between bursts from burning of increasing amounts of accreted hydrogen in the hot CNO cycle. The color version of this figure is only available online. |
| Open with DEXTER | |
5.1 Origin of the long tail
What is the origin of the 103 s time scale of the long tail? One idea spawns from the detection of a hot plasma surrounding the NS (Thompson et al. 2005), namely that prompt burst photons are trapped in the hot plasma through scattering and that the 103 s time scale is the time it takes to drain the plasma of those photons. The maximum size of the plasma in a 2.1 h orbit (Homer et al. 1998) is of order 1011 cm. For an optical depth of 6 (Thompson et al. 2005), this implies a drainage time of at most 10-102 s. This is one to two orders of magnitude shorter than observed. Therefore, if 2.1 h is indeed the orbital period (this needs to be verified; e.g., Mescheryakov et al. 2004), the 103 s time scale cannot be explained by this idea.
Another idea is that the tail is due to cooling of layers that are deeper than the flash layer. In a thermonuclear shell flash, heat is transported upward (to be radiated by the photosphere) as well as downward (heating up deeper layers through conduction; Eichler & Cheng 1989b; Strohmayer & Brown 2002). Deeper layers, extending down to the crust, consist of the ashes of the nuclear H and He burning and are rich in elements up to a mass number between 60 and 100 (Fisker et al. 2008; Schatz et al. 2001). Radiative cooling of these deeper layers can explain the long tail. The time scale of the long tail points to a column depth that is 10 to 30 times longer than that of the burning layer. The amount of fluence in the tail is one to two orders of magnitude smaller than in the prompt burst, suggesting less heating downward than upward.
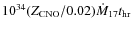
The idea that the long tail results from cooling of deeper layers is corroborated by model calculations. Heger et al. (2007) calculated various sequences of flashes specifically for GS 1826-24 with different mass accretion rates and metallicities. Their model ``A3'' is the one whose recurrence time of 3.85 h matches best the majority of our bursts. This model assumes a mass accretion rate of
1.58
10-9  yr-1 (or 1
1017 g s-1) and a metallicity of Z=0.02. The long-term time profile of the radiated luminosity is very similar to
Fig. 27 of Woosley et al. (2004). Ignoring the period before the first burst and after the accretion turn-on, the interburst time profile is characterized by a gradual decline till about 3000 s after the burst
onset followed by a gradual increase for about 104 s untill the next burst. The decline is due to cooling of the deeper layers; the increase is due to hot CNO burning of newly accreted hydrogen in the burning zone. In Fig. 10 we plot the observed bolometric flux (see also Fig. 4) and the average luminosity profile of 29 bursts from the ``A3'' model by Heger et al. (2007). The fluxes and luminosities were normalized to the peak value, and the light curves were aligned at the peak. Times in the model were corrected for general relativistic effects (through a multiplication with 1+z=1.26; Woosley et al. 2004). The time profiles are an excellent match, all the way to the long tail. Figure 11 shows for this model the evolution of the depth profiles of temperature, net outward luminosity and nuclear energy generation rate per unit mass. Figure 12 presents a more detailed view of the latter panel, showing the dynamic depth profile of the specific nuclear energy generation rate, annotated with the various nuclear processes playing a dominant role at the various locations. Most of the nuclear burning occurs for column depths y < 2
108 g cm-2, but layers are heated that are 10 times deeper (see first panel of Fig. 11). The energetically less important nuclear burning below 2
108 g cm-2 (``heated
yr-1 (or 1
1017 g s-1) and a metallicity of Z=0.02. The long-term time profile of the radiated luminosity is very similar to
Fig. 27 of Woosley et al. (2004). Ignoring the period before the first burst and after the accretion turn-on, the interburst time profile is characterized by a gradual decline till about 3000 s after the burst
onset followed by a gradual increase for about 104 s untill the next burst. The decline is due to cooling of the deeper layers; the increase is due to hot CNO burning of newly accreted hydrogen in the burning zone. In Fig. 10 we plot the observed bolometric flux (see also Fig. 4) and the average luminosity profile of 29 bursts from the ``A3'' model by Heger et al. (2007). The fluxes and luminosities were normalized to the peak value, and the light curves were aligned at the peak. Times in the model were corrected for general relativistic effects (through a multiplication with 1+z=1.26; Woosley et al. 2004). The time profiles are an excellent match, all the way to the long tail. Figure 11 shows for this model the evolution of the depth profiles of temperature, net outward luminosity and nuclear energy generation rate per unit mass. Figure 12 presents a more detailed view of the latter panel, showing the dynamic depth profile of the specific nuclear energy generation rate, annotated with the various nuclear processes playing a dominant role at the various locations. Most of the nuclear burning occurs for column depths y < 2
108 g cm-2, but layers are heated that are 10 times deeper (see first panel of Fig. 11). The energetically less important nuclear burning below 2
108 g cm-2 (``heated
 '' or heat-induced
capture by heavier isotopes) is actually the result of conductive heating from the shallower layers.
'' or heat-induced
capture by heavier isotopes) is actually the result of conductive heating from the shallower layers.
The inward heating is due to conduction. To first order, the heat transport scales with A/Z2 (Cumming & Bildsten 2001; Yakovlev & Urpin 1980; Bildsten & Cutler 1995) where Z is nuclear charge and A nuclear mass number. Therefore, one may expect less inward heating for a layer with heavier isotopes. The composition depends, on its turn, on the composition of the donor atmosphere and the accretion rate. Thus, one may expect more inward
heating in for instance ultra-compact X-ray binaries or for accretion rates and burst regimes with high
in which most hydrogen is burnt through the hot CNO cycle instead of the rp process, because the rp process produces the heaviest elements. Unfortunately, the A/Z2 proportionality of the heat transport is only a crude approximation so that inferences are not straightforward, for instance by comparing different bursters or bursts from the same source at different
accretion rates.
There are other dependencies of the conductivity as well, such as on ignition depth which may vary from source to source and burst to burst. This will not only have an effect on the duration of the tail, but also on the fluence ratio between the tail and the prompt burst. For a relatively shallow ignition, the inward heating will not go as deep and the tail will be short and less fluent. This may explain qualitatively why only the first burst in the triplet from EXO 0748-676 has a long tail that is unaffected by subsequent bursts. The subsequent bursts ignite at shallower depths.
![\begin{figure}
\par\includegraphics[width=16cm,clip]{1432f11.ps}
\par\end{figure}](/articles/aa/full_html/2009/14/aa11432-08/img50.png) |
Figure 11:
Profiles of temperature ( top panel), net outward luminosity
( middle; dashed parts indicate inward luminosity) and specific nuclear energy generation rate ( bottom) calculated as a function of depth for a flash model specifically for GS 1826-24 (model ``A3'' of Heger et al. 2007). Seven profiles are shown. The black curve is for t=0 (burst onset), the other curves are for the times indicated with vertical lines in Fig. 10 with the same color. The top panel shows the inward heating (compare with the location of the
heat source in the bottom panel, down to only 9 |
| Open with DEXTER | |
![\begin{figure}
\par\includegraphics[width=9cm,clip]{1432f12.ps}
\end{figure}](/articles/aa/full_html/2009/14/aa11432-08/img51.png) |
Figure 12:
Dynamic depth profile of the specific nuclear energy generation rate, as calculated in model ``A3'' (Heger et al. 2007). Each level of shading indicates a change in the rate by one order of magnitude. The bottom of this plot is taken to be the bottom of the reservoir of ashes in the model. The hatched regions indicate convective layers (green hatched for convection and red cross-hatched for semiconvection; see Woosley et al. 2004). The convective region between 102 and 103 s is located at the bottom of the hydrogen left over after the burst and is probably due to a
Rayleigh-Taylor instability related to composition inversion resulting from the burning. It does not have a major influence on the structure and evolution of the model. `` |
| Open with DEXTER | |
As mentioned above, the ``A3'' model predicts a trend in the NS luminosity between bursts consisting of a gradual decline for 3000 s after a burst followed by a gradual increase for 104 s up to the
next burst (see Fig. 10). In practice it is difficult to disentangle the NS luminosity from the flux measurements, but it interesting to show the straightforward observed photon rate, see
Fig. 13. This is the same kind of measurement as shown in Fig. 2, except that it is shown linearly and between 12 000 s before and after the burst time. To obtain as much data as possible, particularly far away from the bursts when the data coverage is less than close to the bursts, we included 27 additional bursts for a total of 56. This plot does not show a clear increasing trend except for the final 2
103 s before the next burst. A similar behavior, but of worse statistical quality, is apparent from XMM-Newton data. One would expect a linearly increasing trend for the hot CNO cycle according to L=4
 erg s-1, with
 the CNO abundance,
 the mass accretion rate in 1017 g s-1 and
 time in hours, because the amount of accumulated fuel grows linearly with time and the hot CNO burning rate is a constant that depends only on the CNO mass fraction (Hoyle & Fowler 1965). The maximum slope consistent with the data shown in Fig. 13 is, for
 (Heger et al. 2007) and assuming a black body
temperature of 0.5 keV, equivalent to an upper limit of
(Heger et al. 2007) and assuming a black body
temperature of 0.5 keV, equivalent to an upper limit of
 .
.
A third idea for explaining the long tails is that the X-ray bursts influence the accretion disk in such a way that the accretion rate is temporarily increased. A change in accretion rate by X-ray bursts has been seen before. For instance, X-ray bursts from 4U 1820-303 (Strohmayer & Brown 2002) and 4U 1724-307 (Molkov et al. 2000) are so luminous that radiation pressure blows away the inner parts of the accretion disk, shutting off accretion for a few seconds. Secondly, there are suggestions in X-ray bursts from Cen X-4, XTE J1747-214 and 2S 1711-337 that X-ray bursts act as triggers for switching accretion disks from a cold neutral state to a hot ionized state a few days later (although that cannot be explained yet in a quantitative manner; Kuulkers et al. 2008). Lastly, it appears that immediately before and after superbursts the persistent flux from the accretion disk behaves differently in the sense that the flux has a somewhat decreased level for half a day before and an increased level for approximately a day after superbursts (e.g., Keek et al. 2008; Kuulkers et al. 2002b; Cornelisse et al. 2002,2000). Perhaps there is a 4th type of effect from X-ray bursts on disks resulting in long tails. However, ``our'' long-tailed X-ray bursts are less energetic than the aforementioned bursts that are either super-Eddington (i.e., relatively high flux) or superbursts (high fluence). The X-ray bursts from GS 1826-24 are not particularly luminous (none show photospheric radius expansion) nor extraordinarily fluent (Galloway et al. 2008). The same applies to EXO 0748-676 (only one burst shows photospheric radius expansion; Wolff et al. 2005). The majority of the bursts from 4U 1728-34 do show radius expansion, but have very small fluence due to a very short duration (Galloway et al. 2003). Finally, the power density spectra before the burst and during the tail are not significantly different (cf., Fig. 6), suggesting no change in accretion stream or rate. We believe that an explanation for the long tails in terms of a changed accretion environment is less likely.
5.2 Lack of strong cooling, decreasing black body area
The lack of cooling could be explained by Compton up-scattering of all photons by the hot plasma that surrounds the NS and the temperature inferred from the spectrum may in fact be representative of the plasma rather than the NS. A problem of this explanation is that the inferred emission area drops so suddenly in both GS 1826-24 and EXO 0748-676, after 100 and 60 s respectively. The temperature of the burst at that time is still sufficiently high that one should detect large numbers of unscattered photons. A decline of the normalization, if at all, is expected to be more gradual.
![\begin{figure}
\par\includegraphics[angle=270,width=9cm,clip]{1432f13.ps}
\end{figure}](/articles/aa/full_html/2009/14/aa11432-08/img58.png) |
Figure 13: Average time profile of 56 X-ray bursts from GS 1826-24 as measured with PCU2 on RXTE/PCA in 2-9 keV, now zooming out to times further away from the burst. |
| Open with DEXTER | |
Another, in our opinion more likely, explanation is that the NS may already be fairly hot without the heating by thermonuclear flashes. The effective temperature can then never drop below the
``quiescent'' NS value. There is sufficient persistent energy production to sustain an NS hot enough to explain our measurements, by stable hydrogen burning via the hot CNO cycle (the model depicted in
Fig. 11 predicts about 1
1035 erg s-1), pycnonuclear reactions and electron capture processes in the crust (the same model assumes 1.6
1034 erg s-1 or 0.15 MeV/nucleon). Gravitational energy release by the settling of the accreted processed
matter in the envelope is negligible for these accretion rates (Brown & Bildsten 1998). Gravitational energy release by accretion occurs just outside the NS, is radiated away from the NS (King 1995), and is
decoupled from the burst emission as long as the burst flux is less than the Eddington limit. The total energy production rate depends on the mass accretion rate and the H and CNO abundance of the donor atmosphere. Also, it may partly heat up the core instead of the photosphere. Luminosities are expected to reach up to at least a few times 1035 erg s-1. For a canonical 10 km NS radius and ignoring the gravitational redshift of a few tens of percents, the Stefan-Boltmann law predicts for a luminosity of 2 1035 erg s-1 an effective temperature of the non-bursting NS of order 0.4 keV. If a burst occurs, the photosphere temperature rises to a few keV and the emission is completely dominated by this extra heating, but if the temperature becomes comparable to the quiescent value, in the tail of the burst, the spectrum is strongly affected by the already hot NS. In a standard time-resolved spectroscopic analysis, where a pre-burst spectrum is subtracted and the net spectrum is modeled through a black body, one actually subtracts one Planck function from another. The resulting function is not a Planck function and if, nevertheless, it is modeled as such, the physical meaning of inferred emission areas is lost. This effect has been extensively studied by van Paradijs & Lewin (1986). They find 1) that it is particularly important in the tail of an X-ray burst; 2) that the fit results in constant temperatures and decreasing emission areas, as we find in our analyses; and 3) that the derived temperature has a tight relationship with the NS temperature: the measured temperature is about 30% higher than the NS temperature outside bursts. Taken at face value, our measurements imply a temperature for the NS of 0.7-0.8 keV for both GS 1826-24 and EXO 0748-676, ignoring again gravitational redshift and deviations from black body radiation that become more significant towards lower temperatures (e.g., Zavlin et al. 1996). This is encouragingly close to the simple prediction done above of 0.4 keV. A similar effect in reversed time order may be happening during the rise phase of bursts from GS 1826-24.
Kuulkers et al. (2002a) investigate this effect in detail for bursts from the high- system GX 17+2. van Paradijs & Lewin (1986) suggest to study burst data without subtracting the pre-burst spectrum and employing a model that includes components for the accretion disk emission and a black body for the thermal emission from the NS. Kuulkers et al. (2002a) follow this suggestion and model the accretion disk emission by a cutoff power law. They find unacceptable values for the goodness of fit and dismiss the explanation by an already hot NS and put forward the possibility that the decreasing black body radius is connected to blanketing effects in the NS atmosphere and comptonization of burst photons in the NS atmosphere. Theoretical calculations (Majczyna et al. 2005; Ebisuzaki 1987; Pavlov et al. 1991; Zavlin et al. 1996; London et al. 1986) show that the color temperature is between 1.2 and 1.7 times the effective temperature. The fitted black body radius thus decreases by the square of that, to maintain the same bolometric flux. This cannot explain the drop in radius that we observe which is at least a factor of 5.
As Kuulkers et al. (2002b) point out, the reason for the unsuccesful modeling for GX 17+2 is that the accretion disk spectrum also contains a strong black body component due to the high
in this LMXB. The disk black body has an only slightly higher temperature than that expected of the NS and therefore the latter is difficult to distinguish. Also, in GX 17+2 the low-energy absorption is high with
 1022 cm-2 (Farinelli et al. 2007) so that it is tough to find evidence for an NS of temperature
 keV. Finally, the flux is expected to be low, of order 0.1% of the burst peak, so that accumulating a statistically relevant spectrum is challenging. Our measurements of GS 1826-24 do not suffer from these difficulties. Perhaps a decreasing radius and a flattening temperature in a ``standard'' burst analysis (i.e., with subtraction of the
pre-burst spectrum) constitute the best possible evidence for a hot NS.
keV. Finally, the flux is expected to be low, of order 0.1% of the burst peak, so that accumulating a statistically relevant spectrum is challenging. Our measurements of GS 1826-24 do not suffer from these difficulties. Perhaps a decreasing radius and a flattening temperature in a ``standard'' burst analysis (i.e., with subtraction of the
pre-burst spectrum) constitute the best possible evidence for a hot NS.
We note that many X-ray bursts in the RXTE catalog (Galloway et al. 2008) show similar behavior: temperatures remaining above 1 keV and decreasing fitted radii. Since an explanation by an NS that is already hot without flashes is more likely to be applicable to a major portion
of the burster population than scattering in a hot circumstellar plasma, this provides additional support to that explanation. However, these data are vulnerable to lack of low-energy coverage of
the PCA, as well as from sometimes high absorption columns. As a result, it is quite difficult to accurately measure kT below 1 keV. GS 1826-24 is one of the few cases where this problem does not exist: we have the XMM-Newton data to corroborate the RXTE data and a low .
We furthermore note that the behavior of burst tails in UCXBs is expected to be markedly different in the hot-NS scenario for two reasons. Firstly, UCXBs have much lower H abundances so that hot CNO burning provides much less heating outside flashes. Secondly, in many UCXBs the accretion rate is lower so that again the energy production rate is lower outside bursts and the NS cooler. This expectation is in line with high-sensitivity spectroscopy of some X-ray bursts from UCXBs, for example in A 1246-588 (in 't Zand et al. 2008) where the temperature is seen to decay to 0.5 keV.
5.3 Long tails in other sources
Figure 14 shows the time profiles of the bolometric flux for 4U 1728-34 and EXO 0748-676, together with that for GS 1826-24. These are the same data as shown in the top panels of Figs. 4, 7 and 9, except that one earlier time bin is shown. For convenience the fluxes have been normalized to the respective peak values. This figure shows that there is one property that distinguishes GS 1826-24 from the other two sources: there is a clear difference between the prompt and the tail phase. The tails of 4U 1728-34 and EXO 0748-676 are smooth extensions of the initial burst phase. This may be related to the energetic contribution of the rp-process being larger in GS 1826-24 (cf., Fig. 12). It is probably not related to a smaller amount of inward heating in 4U 1728-34 and EXO 0748-676. The alternative explanation, deeper ignition depths in 4U 1728-34 and EXO 0748-676, is not consistent with the shorter burst recurrence times, similar to GS 1826-24 (Galloway et al. 2008).
The other documented cases (Czerny et al. 1987; Swank et al. 1977; Chenevez et al. 2006; Gotthelf & Kulkarni 1997, see Table 2) do seem to have dual time profiles. Their higher tail-to-peak flux ratio indicates that the heating to the deeper layers can be even more efficient than seen in GS 1826-24. Perhaps there is a smaller abundance of heavy isotopes. However, this is difficult to assess quantitatively because a quantitative comparison with theoretical models has yet to be carried out.
An exceptional case is the long tail in GX 3+1 (Chenevez et al. 2006). It contains much more fluence than the prompt burst, perhaps 40 times as much![]() ! Aql X-1 (Czerny et al. 1987) and the source in M 28 (Gotthelf & Kulkarni 1997) may also have large fluence ratios but there are
data gaps that preclude verification. If interpreted as direct NS emission, this cannot be explained through cooling of deep layers, particularly since the prompt fluence is similar to that for other
bursts from GX 3+1 that do not show a long tail. One difference that distinguishes these other cases from the cases discussed in the paper is that they were most probably in a different burst regime when the long-tailed bursts occurred, namely in a regime without continuous hot-CNO hydrogen burning.
! Aql X-1 (Czerny et al. 1987) and the source in M 28 (Gotthelf & Kulkarni 1997) may also have large fluence ratios but there are
data gaps that preclude verification. If interpreted as direct NS emission, this cannot be explained through cooling of deep layers, particularly since the prompt fluence is similar to that for other
bursts from GX 3+1 that do not show a long tail. One difference that distinguishes these other cases from the cases discussed in the paper is that they were most probably in a different burst regime when the long-tailed bursts occurred, namely in a regime without continuous hot-CNO hydrogen burning.
![\begin{figure}
\par\includegraphics[angle=270,width=9cm,clip]{1432f14.ps}
\end{figure}](/articles/aa/full_html/2009/14/aa11432-08/img62.png) |
Figure 14: The average time profiles of the bolometric flux for GS 1826-24 (solid green curve) and 4U 1728-34 (dotted black) and the profile for the triple burst from EXO 0748-676 (dashes red; the profile is cut at the time the 2nd burst occurs). Fluxes are renormalized with the respective peak values. |
| Open with DEXTER | |
Several classes of long X-ray bursts, with e-folding decay times in excess of roughly 100 s, have been discovered in the past decade. This includes superbursts (Flashes of 100 m thick carbon-rich layers; for a recent list, see Keek & in 't Zand 2008) and intermediately long bursts that may result from flashes of 10 m thick helium layers (Cumming et al. 2006; in 't Zand et al. 2007,2005) or otherwise (Chenevez et al. 2007; Linares et al. 2008). With the present paper, one realizes that even the ``classical'' short X-ray bursts can be similarly long in some sense. The distinguishing factor is that these bursts initiate with a normal-sized X-ray burst and that, probably, the implied thick layer is not heated locally by nuclear reactions but by conduction from a hotter layer on top.
6 Conclusion
We have detected an hour-long tail to bursts in GS 1826-24 with fluxes and fluences that are two orders of magnitude smaller than those of the bursts themselves. We have found similar tails in bursts from 4U 1728-34 and EXO 0748-676, although they are less distinguished from the prompt burst emission. While detection in other bursters is hampered by varying accretion fluxes of similar magnitude, there are reports of individual cases of bursts with long tails, most notably in GX 3+1 (Chenevez et al. 2006). Model calculations show that the tail in GS 1826-24 can be explained by delayed cooling of layers that are up to ten times deeper in column density than where the flash occurs and that were heated up through inward conduction of the flash heat. Possibly tails in other sources can be similarly explained. Further model calculations are needed, where dependencies of donor composition, ignition depth and accretion rate are taken into account. Comparing such calculations to different kinds of bursts and bursters may yield constraints on the details of conduction in the NS envelope.
A characteristic of the tails, that at first hand is unexpected in this scenario, is the small amount of cooling. Rather than being due to up-scattering of the burst photons by a hotter optically-thick plasma, we believe that the most likely explanation is that the NS is already hot without flashes. The temperature that one measures in the burst tail is then representative for the non-bursting NS. This scenario also provides a more natural explanation for the decreasing black body normalization in the tails. As discussed by van Paradijs & Lewin (1986), this presents an interesting opportunity to study NS temperatures as a function of accretion rate. However, this may be a cumbersome. Apart from good low-energy coverage, one would need to work on a single-burst basis, also for the accurate modeling of the persistent spectrum. Better data would be needed than presented here.
Acknowledgements
We are grateful to Duncan Galloway and Peter Jonker for useful discussions and an anonymous referee for a swift review and useful suggestions. L.K. was supported by the Netherlands Organization for Research (NWO) through NOVA, AC by an NSERC Disovery Grant, Le Fonds Québécois de la Recherche sur la Nature et les Technologies and the Canadian Institute for Adcanced Research. AC is an Alfred P. Sloan Research Fellow. A.H. was supported by the DOE Program for Scientific Discovery through Advanced Computing (SciDAC; DOE-FC02-01ER41176 and DOE-FC02-06ER41438) and by the US Department of Energy under grant DE-FG02-87ER40328.
References
-
Ba
 ucinska-Church, M., & McCammon, D. 1992, ApJ, 400, 699
In the text
ucinska-Church, M., & McCammon, D. 1992, ApJ, 400, 699
In the text
- Bildsten, L. 1998, in The many faces of neutron stars, ed. A. Alpar, L. Buccheri, & J. van Paradijs, NATO ASI (Dordrecht: Kluwer), 419 In the text
- Bildsten, L. 2000, in AIP Conf. Ser. 522, ed. S. S. Holt, & W. W. Zhang, 359 In the text
- Bildsten, L., & Cutler, C. 1995, ApJ, 449, 800 In the text
- Boirin, L., Keek, L., Méndez, M., et al. 2007, A&A, 465, 559 In the text
- Brown, E., & Bildsten, L. 1998, ApJ, 496, 915 In the text
- Chenevez, J., Falanga, M., Brandt, S., et al. 2006, A&A, 449, L5 In the text
- Chenevez, J., Falanga, M., Kuulkers, E., et al. 2007, A&A, 469, L27 In the text
- Cocchi, M., Bazzano, A., Natalucci, L., et al. 2001, Adv. Space Res., 28, 375 In the text
- Cornelisse, R., Heise, J., Kuulkers, E., Verbunt, F., & in 't Zand, J. J. M. 2000, A&A, 357, L21 In the text
- Cornelisse, R., Kuulkers, E., in 't Zand, J. J. M., Verbunt, F., & Heise, J. 2002, A&A, 382, 174 In the text
- Cumming, A., & Bildsten, L. 2001, ApJ, 559, L127 In the text
- Cumming, A., Macbeth, J., in 't Zand, J. J. M., & Page, D. 2006, ApJ, 646, 429 In the text
- Czerny, M., Czerny, B., & Grindlay, J. 1987, ApJ, 312, 122 In the text
- den Hartog, P. R., in 't Zand, J. J. M., Kuulkers, E., et al. 2003, A&A, 400, 633 In the text
- Ebisuzaki, T. 1987, PASJ, 39, 287 In the text
- Eichler, D., & Cheng, A. F. 1989a, ApJ, 336, 360 In the text
- Eichler, D., & Cheng, A. F. 1989b, ApJ, 336, 360 In the text
- Farinelli, R., Titarchuk, L., & Frontera, F. 2007, ApJ, 662, 1167 In the text
- Fisker, J. L., Schatz, H., & Thielemann, F.-K. 2008, ApJS, 174, 261 In the text
- Galloway, D. K., Psaltis, D., Chakrabarty, D., & Muno, M. P. 2003, ApJ, 590, 999 In the text
- Galloway, D. K., Cumming, A., Kuulkers, E., et al. 2004, ApJ, 601, 466 In the text
- Galloway, D. K., Muno, M. P., Hartman, J. M., Psaltis, D., & Chakrabarty, D. 2008, ApJS, 179, 360 In the text
- Gotthelf, E. V., & Kulkarni, S. R. 1997, ApJ, 490, L161 In the text
- Heger, A., Cumming, A., Galloway, D. K., & Woosley, S. E. 2007, ApJ, 671, L141 In the text
- Homer, L., Charles, P. A., & O'Donoghue, D. 1998, MNRAS, 298, 497 In the text
- Hoyle, F., & Fowler, W. A. 1965, in Quasi-Stellar Sources and Gravitational Collapse, ed. I. Robinson, A. Schild, & E. L. Schucking, 17 In the text
- in 't Zand, J. J. M., Verbunt, F., Strohmayer, T. E., et al. 1999, A&A, 345, 100 In the text
- in 't Zand, J. J. M., Strohmayer, T. E., Markwardt, C. B., & Swank, J. 2003, A&A, 409, 659 In the text
- in 't Zand, J. J. M., Cumming, A., van der Sluys, M. V., Verbunt, F., & Pols, O. R. 2005, A&A, 441, 675 In the text
- in 't Zand, J. J. M., Jonker, P. G., & Markwardt, C. B. 2007, A&A, 465, 953 In the text
- in 't Zand, J. J. M., Bassa, C. G., Jonker, P. G., et al. 2008, A&A, 485, 183 In the text
- Jahoda, K., Markwardt, C. B., Radeva, Y., et al. 2006, ApJS, 163, 401 In the text
- Keek, L., & in 't Zand, J. J. M. 2008, in 7th INTEGRAL Workshop - An INTEGRAL View of Compact Objects, Proceedings of Science In the text
- Keek, L., in 't Zand, J. J. M., Kuulkers, E., et al. 2008, A&A, 479, 177 In the text
- King, A. 1995, in X-ray binaries, ed. W. H. G. Lewin, J. van Paradijs, & E. P. J. van den Heuvel, 419 In the text
- Kong, A. K. H., Miller, J. M., Méndez, M., et al. 2007, ApJ, 670, L17 In the text
- Kuulkers, E., Homan, J., van der Klis, M., Lewin, W. H. G., & Méndez, M. 2002a, A&A, 382, 947 In the text
- Kuulkers, E., in 't Zand, J. J. M., van Kerkwijk, M. H., et al. 2002b, A&A, 382, 503 In the text
- Kuulkers, E., in 't Zand, J. J. M., & Lasota, J. P. 2008, arXiv e-prints In the text
- Lewin, W. H. G., van Paradijs, J., & Taam, R. E. 1993, Space Sci. Rev., 62, 223 In the text
- Linares, M., Watts, A. L., Wijnands, R., et al. 2008, MNRAS, L130 In the text
- London, R. A., Taam, R. E., & Howard, W. M. 1986, ApJ, 306, 170 In the text
- Majczyna, A., Madej, J., Joss, P. C., & Rózanska, A. 2005, A&A, 430, 643 In the text
- Mescheryakov, A. V., Khamitov, I. M., Revnivtsev, M. G., et al. 2004, Astron. Lett., 30, 751 In the text
- Molkov, S. V., Grebenev, S. A., & Lutovinov, A. A. 2000, A&A, 357, L41 In the text
- Parmar, A. N., White, N. E., Giommi, P., & Gottwald, M. 1986, ApJ, 308, 199 In the text
- Pavlov, G. G., Shibanov, I. A., & Zavlin, V. E. 1991, MNRAS, 253, 193 In the text
- Schatz, H., Aprahamian, A., Barnard, V., et al. 2001, Phys. Rev. Lett., 86, 3471 In the text
- Strohmayer, T. E., & Brown, E. F. 2002, ApJ, 566, 1045 In the text
- Strohmayer, T. E., & Bildsten, L. 2006, in Compact stellar X-ray sources, ed. W. Lewin & M. van der Klis, Cambridge Astrophysics Series, 39, 113 In the text
- Strüder, L., Briel, U., Dennerl, K., et al. 2001, A&A, 365, L18 In the text
- Swank, J., Becker, R., Boldt, E., et al. 1977, ApJ, 212, L73 In the text
- Thompson, T. W. J., Rothschild, R. E., Tomsick, J. A., & Marshall, H. L. 2005, ApJ, 634, 1261 In the text
- Thompson, T. W. J., Galloway, D. K., Rothschild, R. E., & Homer, L. 2008, ApJ, 681, 506 In the text
- Ubertini, P., Bazzano, A., Cocchi, M., et al. 1999, ApJ, 514, L27 In the text
- van Paradijs, J., & Lewin, H. G. 1986, A&A, 157, L10 In the text
- Wilms, J., Allen, A., & McCray, R. 2000, ApJ, 542, 914 In the text
- Wolff, M. T., Becker, P. A., Ray, P. S., & Wood, K. S. 2005, ApJ, 632, 1099 In the text
- Woosley, S. E., Heger, A., Cumming, A., et al. 2004, ApJS, 151, 75 In the text
- Yakovlev, D. G., & Urpin, V. A. 1980, Sov. Astron., 24, 303 In the text
- Zavlin, V. E., Pavlov, G. G., & Shibanov, Y. A. 1996, A&A, 315, 141 In the text
Footnotes
- ... much
![[*]](/icons/foot_motif.png)
- This value depends on where the boundary between prompt burst and tail is chosen, but it is always significantly larger than 1.
All Tables
Table 1: Selection of X-ray bursts from GS 1826-24 studied here. For more details, see Galloway et al. (2008).
Table 2: Summary of measurements.
All Figures
| |
Figure 1: Average time profile of 29 X-ray bursts from GS 1826-24 as measured with PCU2 on RXTE/PCA, in two photon-energy bandpasses and at logarithmically scaled resolution. |
| Open with DEXTER | |
| In the text | |
| |
Figure 2:
Average time profile of 29 X-ray bursts from GS 1826-24 as measured with PCU2 on RXTE/PCA in 2-9 keV and at logarithmically scaled resolution, together with an exponential decay function (smooth curve) as fitted between 600 and 5500 s ( |
| Open with DEXTER | |
| In the text | |
| |
Figure 3:
Average time profile of 14 X-ray bursts from GS 1826-24 as
measured with XMM/EPIC, in one bandpass and at a logarithmically scaled resolution. The count rate scaling is different from Fig. 1 due to the different time resolution at
the peak and the occurrence of saturation effects in the XMM-Newton data. The smooth curve shows an exponential function, fitted between 600 and 3000 s. The decay time was found to be |
| Open with DEXTER | |
| In the text | |
| |
Figure 4:
Modeling results for time-resolved PCA burst spectra of average of 17 bursts. The model consists of a black body and power-law component absorbed by a fixed column of
|
| Open with DEXTER | |
| In the text | |
| |
Figure 5:
Modeling results for time-resolved 0.7-10 keV burst spectra
of 14 bursts detected XMM-Newton observation. Spectral channels were binned so that each bin contains at least 15 photons. The number of degrees of freedom ranges between roughly 500 and 2000 (for 2 spectra, one for each observation) which explains the small scatter in
|
| Open with DEXTER | |
| In the text | |
| |
Figure 6: Geometrically binned Fourier power density difference spectrum between pre-burst and tail data (in formula: tail pds minus pre-burst pds divided by pre-burst pds). |
| Open with DEXTER | |
| In the text | |
| |
Figure 7:
Modeling results for time-resolved PCA burst spectra of average of 36 bursts from 4U 1728-34. The model consists of a black body and power-law component absorbed by a fixed column of
|
| Open with DEXTER | |
| In the text | |
| |
Figure 8: Light curve of triple burst from EXO 0748-676 seen on September 12, 2006, at 16:30:36 UT (ObsID 92013-01-03-000). The peaks of the bursts are truncated to zoom in on the long tail of the first burst. The peak fluxes of the 3 bursts are 785.5, 462.1 and 86.8 c/s. The horizontal line is plotted as a reference for the out-of-burst flux. |
| Open with DEXTER | |
| In the text | |
| |
Figure 9:
Time-resolved spectroscopy of the triple burst from EXO 0748-676. A pre-burst spectrum was subtracted before fitting the spectra with an absorbed black body model with
|
| Open with DEXTER | |
| In the text | |
| |
Figure 10: Average observed (red histogram) and predicted (solid) time profiles of bolometric flux, after normalization at the respective peak values and alignment at the peak. The vertical dashed lines indicate the times for the depth profiles plotted in Fig. 11. The inset shows the model on a broader and linear time scale, exhibiting the slow luminosity increase between bursts from burning of increasing amounts of accreted hydrogen in the hot CNO cycle. The color version of this figure is only available online. |
| Open with DEXTER | |
| In the text | |
| |
Figure 11:
Profiles of temperature ( top panel), net outward luminosity
( middle; dashed parts indicate inward luminosity) and specific nuclear energy generation rate ( bottom) calculated as a function of depth for a flash model specifically for GS 1826-24 (model ``A3'' of Heger et al. 2007). Seven profiles are shown. The black curve is for t=0 (burst onset), the other curves are for the times indicated with vertical lines in Fig. 10 with the same color. The top panel shows the inward heating (compare with the location of the
heat source in the bottom panel, down to only 9 |
| Open with DEXTER | |
| In the text | |
| |
Figure 12:
Dynamic depth profile of the specific nuclear energy generation rate, as calculated in model ``A3'' (Heger et al. 2007). Each level of shading indicates a change in the rate by one order of magnitude. The bottom of this plot is taken to be the bottom of the reservoir of ashes in the model. The hatched regions indicate convective layers (green hatched for convection and red cross-hatched for semiconvection; see Woosley et al. 2004). The convective region between 102 and 103 s is located at the bottom of the hydrogen left over after the burst and is probably due to a
Rayleigh-Taylor instability related to composition inversion resulting from the burning. It does not have a major influence on the structure and evolution of the model. `` |
| Open with DEXTER | |
| In the text | |
| |
Figure 13: Average time profile of 56 X-ray bursts from GS 1826-24 as measured with PCU2 on RXTE/PCA in 2-9 keV, now zooming out to times further away from the burst. |
| Open with DEXTER | |
| In the text | |
| |
Figure 14: The average time profiles of the bolometric flux for GS 1826-24 (solid green curve) and 4U 1728-34 (dotted black) and the profile for the triple burst from EXO 0748-676 (dashes red; the profile is cut at the time the 2nd burst occurs). Fluxes are renormalized with the respective peak values. |
| Open with DEXTER | |
| In the text | |
Copyright ESO 2009
Current usage metrics show cumulative count of Article Views (full-text article views including HTML views, PDF and ePub downloads, according to the available data) and Abstracts Views on Vision4Press platform.
Data correspond to usage on the plateform after 2015. The current usage metrics is available 48-96 hours after online publication and is updated daily on week days.
Initial download of the metrics may take a while.