| Issue |
A&A
Volume 497, Number 2, April II 2009
|
|
|---|---|---|
| Page(s) | 463 - 468 | |
| Section | Stellar structure and evolution | |
| DOI | https://doi.org/10.1051/0004-6361/200811362 | |
| Published online | 05 March 2009 | |
Thermohaline mixing in super-AGB stars
L. Siess1,2
1 - Institut d'Astronomie et d'Astrophysique, Université
Libre de Bruxelles (ULB), CP 226, 1050 Brussels, Belgium
2 -
Centre for Stellar and Planetary Astrophysics, School of
Mathematical Sciences, Monash University, Victoria 3800,
Australia
Received 17 November 2008 / Accepted 26 January 2009
Abstract
Aims. We present the first study of the effects of thermohaline mixing on the structure and evolution of solar-composition super-AGB (SAGB) stars in the mass range 9-11  .
.
Methods. We developed and analyzed stellar models taking into account thermohaline mixing and varying mixing efficiencies.
Results. In SAGB stars, thermohaline mixing becomes important after carbon has been ignited off-center and it affects significantly the propagation of the flame. In the radiative layers located below the convective carbon-burning zone, a molecular weight inversion is created which allows the efficient transport of chemicals. The outward diffusion of 12C from the CO-rich core into the flame, depletes the burning front of fuel and causes the extinction of the flame before it reaches the center. As a consequence the amount of unburnt carbon can be as high as  in mass at the center of the star. During the subsequent thermally pulsing SAGB phase, the high temperature at the base of the convective envelope prevents the development of thermohaline instabilities associated with 3He burning as found in low-mass red giant stars.
Conclusions. In contrast to the case of low-mass RGB stars, thermohaline mixing is unable to alter the surface composition of SAGB stars. We also emphasize that if the SAGB star evolves into an electron-capture supernovae, the 12C remaining in the core may alter the hydrodynamical explosion and modify the explosive nucleosynthesis.
Key words: stars: evolution - stars: supernovae: general - nuclear reactions, nucleosynthesis, abundances - instabilities
1 Introduction
Thermohaline instabilities are also referred to as double diffusive
instabilities and are driven by the fact that the stabilizing component
(heat) diffuses more rapidly than the destabilizing one (chemicals). The
classical picture consists of a layer of warm, salty water positioned on
top of pure cold water. Since heat diffuses faster than salt, a fluid
element that is displaced downward remains heavier than its surrounding and
continues to sink despite the stabilizing temperature gradient. Mixing
proceeds until the two effects compensate each other and the element
becomes turbulent. These instabilities produces finger-like patterns and
are responsible for the efficient mixing. In the stellar case, the mean
molecular weight ( )
plays the role of the salinity, and the
instability develops inside the radiative layers when
)
plays the role of the salinity, and the
instability develops inside the radiative layers when
 .
.
As the extensive literature attests, the effects of thermohaline mixing on the structure and composition of stars have been analyzed in various astrophysical contexts. In binary systems, thermohaline instabilities may be induced when heavy material from the primary star is transferred to its companion. This includes both close and wide low-mass binaries (e.g., Marks & Sarna 1998; Bitzaraki et al. 2004; Stancliffe et al. 2008), as well as massive systems (e.g., de Grève & Cugier 1989; Wellstein et al. 2001). However, these instabilities can also develop in single stars as the result of the accretion of metal-rich matter during the phase of planetary formation (e.g. Vauclair 2004) or because of nuclear burning. In this latter case it was realized that thermohaline mixing is likely to operate during the core helium flash in low-mass stars (Thomas 1967) or in the region of H burning where the 3He(3He,2p)4He reactions are active (Ulrich 1972). Using 3D hydrodynamical simulations, Eggleton et al. (2006) detected the presence of this instability at the convective envelope base of a low-mass red giant. This hydrodynamical study was then complemented by stellar evolution computations (Charbonnel & Zahn 2007; Eggleton et al. 2008), where it was shown that the mean molecular weight inversion created below the convective envelope by the 3He+3He reactions produces an efficient transport of chemicals. This additional mixing process is activated when the H burning shell crosses the discontinuity left by the passage of the convective envelope during the first dredge-up, i.e. at the luminosity bump, and accounts for the reduction in the surface abundance of 3He, 7Li, as well as the 12C/13C ratio, in agreement with observations of globular cluster stars.
The non-explosive evolution of solar metallicity SAGB stars was first investigated in details by Garcia-Berro and collaborators (Garcia-Berro et al. 1997; Iben et al. 1997; Ritossa et al. 1996, 1999) with special attention to the propagation of a laminar flame after the off-center ignition of carbon. More recently SAGB stars in binary systems have been studied (e.g., Gil-Pons & Garcia-Berro 2002), non-solar models have been computed (e.g., Gil-Pons et al. 2005; Siess 2007) and the effect of overshooting and numerics have been investigated (e.g., Gil-Pons et al. 2007; Siess 2007; Poelarends et al. 2008).
In the present paper, we explore in more details the effects of thermohaline mixing in SAGB stars, where the off-center ignition of carbon provides favorable conditions for the development of this instability. In Sect. 2, we briefly review the main physical assumptions used in the computations, before discussing in detail the effects of this process on the structure and evolution of SAGB stars. Our analysis proceeds linearly along an evolutionary sequence from the main sequence to the thermally pulsing SAGB (TP-SAGB) phase. In Sect. 4, we investigate the effects of varying the mixing efficiency, and in Sect. 5, we analyze how this process operates in stars of various initial stellar masses. A summary is presented in Sect. 6.
2 Input physics
The models are computed with version v3.00 of starevol as
described by Siess (2007) and Siess & Arnould (2008). The Schwarzschild
criterion is used to delineate the convective boundaries, core overshooting
is not accounted for, and the chemical composition is scaled to solar
values according to the Grevesse et al. (1996) mixture. The condition for the
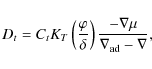
occurrence of thermohaline mixing is given by
where
 ,
,
 ,
,
 the
adiabatic gradient, and
the
adiabatic gradient, and
 .
Mixing is treated as a
diffusive process and the associated coefficient follows the Kippenhahn
et al. (1980) formulation
.
Mixing is treated as a
diffusive process and the associated coefficient follows the Kippenhahn
et al. (1980) formulation
where the thermal diffusivity
 and
and
 is a form factor that depends on the ratio
 of the length l and diameter d of the unstable fluid element
(Ulrich 1972).
of the length l and diameter d of the unstable fluid element
(Ulrich 1972).
Following Charbonnel & Zahn (2007), we assume by default that Ct = 1000. The arguments supporting this high value arise from the necessity to increase the mixing efficiency along the RGB to reproduce the observed decrease in 3He at the luminosity bump. A high value of Ct is also in closer agreement with laboratory experiments that show the development of elongated fingers (Krishnamurti 2003). This phenomenological approach remains nevertheless largely uncertain since laboratory conditions are far from being comparable to those prevailing in stellar interiors and the effects of varying Ct will be analyzed in Sect. 4.
3 Effects of thermohaline mixing
The effects of thermohaline mixing are investigated by the detailed
analysis of a representative SAGB model of initially 9.5
and
metallicity Z=0.02.
3.1 Evolution prior to C-ignition
![\begin{figure}
\par\includegraphics[width=9cm]{1362fig1.ps}
\end{figure}](/articles/aa/full_html/2009/14/aa11362-08/img21.png) |
Figure 1:
Top panel: evolution of the surface 3He
abundance. Bottom panel: Kippenhahn diagram showing the evolution
of the internal structure of a 9.5 |
| Open with DEXTER | |
 does not necessarily imply efficient mixing. The H and He burning
shells are also delineated by the green (outer) and blue (inner) dashed
lines, respectively.
does not necessarily imply efficient mixing. The H and He burning
shells are also delineated by the green (outer) and blue (inner) dashed
lines, respectively.Prior to carbon ignition, thermohaline mixing has almost no effect on the evolution and structure of massive intermediate-mass stars. This is caused mainly, in contrast to low-mass stars, by H burning being powered mostly by the CNO cycle. The 3He(3He,2p)4He reactions responsible for producing a mean molecular weight inversion are only active in the uppermost layers of these stars. The thermohaline instabilities that may develop in these remote shells are active during a short period of time and operate to homogenise the surface radiative layers. Deeper inside the star, because of the higher temperatures, most of the 3He initially present and produced by deuterium burning during the pre-main sequence evolution is destroyed efficiently. Therefore, when the first dredge-up occurs after central H exhaustion, the surface 3He abundance first increases, corresponding to the engulfment of the surviving external 3He pocket, and then decreases as the convective envelope moves inward into the 3He-free layers as illustrated at the top of Fig. 2.
At the deepest extent of the convective envelope, the 3He mass
fraction has decreased by of factor of two with respect to its initial
value, the 12C/13C ratio has dropped down to  20, and
the surface 14N and 13C mass fractions have increased by
0.45 dex as in the standard case without mixing
20, and
the surface 14N and 13C mass fractions have increased by
0.45 dex as in the standard case without mixing![]() . On the ascent of the RGB and in contrast to low-mass stars,
the H burning shell (HBS) never crosses the chemical discontinuity left by
the envelope during the first dredge-up before He ignites at the center
(Fig. 1). The HBS thus always remains detached from the
envelope, and the surface abundances are unmodified, at least until the
second dredge-up comes into play, i.e. at the time of carbon burning.
. On the ascent of the RGB and in contrast to low-mass stars,
the H burning shell (HBS) never crosses the chemical discontinuity left by
the envelope during the first dredge-up before He ignites at the center
(Fig. 1). The HBS thus always remains detached from the
envelope, and the surface abundances are unmodified, at least until the
second dredge-up comes into play, i.e. at the time of carbon burning.
3.2 Carbon-burning phase
In SAGB stars, carbon ignites off-center in an energetic flash driving a convective zone (e.g., Garcia-Berro et al. 1997; Gil-Pons et al. 2005; Siess 2006). After the decay of the instability, carbon reignites deeper in the star releasing less energy and the structure readjusts into a new configuration in which all the energy produced by the 12C+12C reactions is carried away by neutrinos. When this ``balanced-power condition'' (Timmes et al. 1994) is achieved, carbon burning proceeds as a deflagration with the burning front moving inward, dragging behind a convective zone. When the flame reaches the center, the core consists of 16O (55-60%) and 20Ne (28-32%) plus traces of 23Na and 24Mg. The presence of thermohaline mixing will alter this standard picture.
![\begin{figure}
\par\includegraphics[width=9cm]{1362fig2.ps}
\end{figure}](/articles/aa/full_html/2009/14/aa11362-08/img23.png) |
Figure 2:
Compared evolution of a 9.5 |
| Open with DEXTER | |
 ,
blue dotted-dashed
line), nuclear energy production by carbon (
,
blue dotted-dashed
line), nuclear energy production by carbon ( green dashed line) and hydrogen (
 cyan dashed line if present) burning as well as the surface
luminosity (solid black line) are depicted in the right panels for both
stars. The origin of time has been reset to the peak carbon luminosity
during the carbon flash.
cyan dashed line if present) burning as well as the surface
luminosity (solid black line) are depicted in the right panels for both
stars. The origin of time has been reset to the peak carbon luminosity
during the carbon flash.
The production of mostly 20Ne (but also of 23Na and
24Mg) above the degenerate CO core produces a mean molecular weight
inversion and sets the conditions for the development of thermohaline
instabilities. When carbon-burning reactions are activated, initially at a
low rate close to the center, a -inversion develops. Thereafter, as
the maximum temperature increases and moves outward, the unstable region
(where Eq. (1) is satisfied) grows in mass, and when the flash
ignites, it extends throughout the core (Fig. 2). However,
until carbon is burnt significantly,
 remains small, which
prevents efficient mixing being possible (see the diffusion coefficients in
Fig. 3). This is why the flash properties are weakly affected
by this process. We note however that models accounting for thermohaline
diffusion ignite carbon slightly closer to the center in a shell where the
degeneracy is a bit lower. As a consequence, the peak carbon luminosity
remains small, which
prevents efficient mixing being possible (see the diffusion coefficients in
Fig. 3). This is why the flash properties are weakly affected
by this process. We note however that models accounting for thermohaline
diffusion ignite carbon slightly closer to the center in a shell where the
degeneracy is a bit lower. As a consequence, the peak carbon luminosity  as well as the extent of the convective flash are reduced
compared to the standard case, but the differences are small (<10%). The main differences concern the duration of the convective flash
and the time interval between the flash and the flame, both of which are
shorter in the standard case.
as well as the extent of the convective flash are reduced
compared to the standard case, but the differences are small (<10%). The main differences concern the duration of the convective flash
and the time interval between the flash and the flame, both of which are
shorter in the standard case.
The most significant impact of this nuclear-induced chemical transport is
visible in the evolution of the carbon luminosity. Despite the expansion
and cooling of the core after the flash, mixing sustains the nuclear energy
production by bringing more fuel into the layers where carbon burning
occurs. In Fig. 2 and the top panel of Fig. 6, we
clearly see that after the flash extinction, the carbon luminosity reaches
its highest value in the models where thermohaline mixing is most
efficient. Consequently, when convection resumes, the second peak in
is much smaller in the thermohaline model since carbon burning
operates already at a relatively high rate. This also explains why the
temperature is higher than in the standard models (Fig. 4).
![\begin{figure}
\par\includegraphics[width=9cm]{1362fig3.ps}
\end{figure}](/articles/aa/full_html/2009/14/aa11362-08/img25.png) |
Figure 3:
The left panel depicts the evolution of the thermohaline
diffusion coefficient Dt at various epochs during the propagation of
the flame in our reference 9.5 |
| Open with DEXTER | |
 is negative. Thermohaline instabilities develop in
these layers and allow the transport of chemicals between the convective
flame and the CO-rich core. The diffusion coefficient Dt is maximal at
the edge of the convective boundary mainly because in this region
is negative. Thermohaline instabilities develop in
these layers and allow the transport of chemicals between the convective
flame and the CO-rich core. The diffusion coefficient Dt is maximal at
the edge of the convective boundary mainly because in this region
 .
Away from the convective front, the transport by
radiation and conduction is efficient and, with decreasing temperatures,
Dt rapidly drops from
107-8 cm2 s-1 to an almost constant
value of 105 cm2 s-1 (Fig. 3). With these high
diffusion coefficients, the carbon present in the inert core is transported
outward, through the burning front into the convective flame. As evolution
proceeds, the carbon mass fraction in the precursor flame decreases and the
nuclear energy production, which depends strongly on the carbon mass
fraction (
.
Away from the convective front, the transport by
radiation and conduction is efficient and, with decreasing temperatures,
Dt rapidly drops from
107-8 cm2 s-1 to an almost constant
value of 105 cm2 s-1 (Fig. 3). With these high
diffusion coefficients, the carbon present in the inert core is transported
outward, through the burning front into the convective flame. As evolution
proceeds, the carbon mass fraction in the precursor flame decreases and the
nuclear energy production, which depends strongly on the carbon mass
fraction (
 )
eventually
stops. By removing the fuel, thermohaline mixing is thus able to stop the
nuclear burning. The resulting impoverishment in 12C also reduces
the flame speed, which then provides additional time for further fuel
removal. This is in sharp contrast to the standard case where the
chemical discontinuity that forms at the edge of the convective flame is
maintained at all times during the propagation of the flame to the center.
)
eventually
stops. By removing the fuel, thermohaline mixing is thus able to stop the
nuclear burning. The resulting impoverishment in 12C also reduces
the flame speed, which then provides additional time for further fuel
removal. This is in sharp contrast to the standard case where the
chemical discontinuity that forms at the edge of the convective flame is
maintained at all times during the propagation of the flame to the center.
Another approach to understand the quenching of the flame is to consider
the ``carbon ignition lines'', which delineate the region in the
density-temperature plane where the rates of neutrino and nuclear energy
production by carbon burning equal each other, i.e. where
 (Fig. 4). Because
 also depends on the carbon mass fraction, a
different ignition line exists for each of the 12C abundances. Below
each curve, the temperature and density are lower,
also depends on the carbon mass fraction, a
different ignition line exists for each of the 12C abundances. Below
each curve, the temperature and density are lower,
 and cooling dominates, while above the curve, carbon
burning and nuclear heating prevail. It must be emphasized that these
ignition lines provide a local criterion for the existence of carbon
burning since they were computed using the local properties of the
plasma. In a realistic model, the situation is far more complex because the
nuclear and neutrino energy production rates are distributed over a
large region and energy is transported by both radiation and
convection. Therefore, the abundances quoted on the curves do not
necessarily correspond to the carbon mass fractions found in our
models. Nevertheless, this approach illustrates our point
effectively. During the propagation of the flame, mixing lowers the carbon
abundance in the burning front and the ignition curves are shifted to
regions of higher temperature and density, which eventually becomes out of
reach of the flame. Once the 12C abundance is too low, neutrino
emission begins to dominate the energy production and the maximum
temperature (
and cooling dominates, while above the curve, carbon
burning and nuclear heating prevail. It must be emphasized that these
ignition lines provide a local criterion for the existence of carbon
burning since they were computed using the local properties of the
plasma. In a realistic model, the situation is far more complex because the
nuclear and neutrino energy production rates are distributed over a
large region and energy is transported by both radiation and
convection. Therefore, the abundances quoted on the curves do not
necessarily correspond to the carbon mass fractions found in our
models. Nevertheless, this approach illustrates our point
effectively. During the propagation of the flame, mixing lowers the carbon
abundance in the burning front and the ignition curves are shifted to
regions of higher temperature and density, which eventually becomes out of
reach of the flame. Once the 12C abundance is too low, neutrino
emission begins to dominate the energy production and the maximum
temperature (
 )
decreases. The quenching of the instability is
then irreversible because of the stronger temperature dependence of
)
decreases. The quenching of the instability is
then irreversible because of the stronger temperature dependence of
 )
compared to that of
)
compared to that of
 ).
).
Standard models do not have this problem because the carbon abundance in
the precursor flame is approximately constant
(Fig. 3). Consequently,
increases steadily as the
burning front moves inward until it reaches the center, where the flame is
extinguished because of fuel exhaustion.
![\begin{figure}
\par\includegraphics[width=9cm]{1362fig4.ps}
\end{figure}](/articles/aa/full_html/2009/14/aa11362-08/img34.png) |
Figure 4:
Carbon ignition lines as a function of the 12C mass
fraction. For a given carbon abundance as indicated by the label, the
region located below the selected curve is where
|
| Open with DEXTER | |
It should be noted that the early quenching of the flame is a physical feature
that does not depend on the numerical resolution. We completed a series of
tests in which the constraint on the timestep was further increased by
imposing a maximum change to the chemical abundances of 2% between two
consecutive models (the reference value is set to be 0.05) and the spatial
resolution increased, so that the relative variation in the main variables
(T, P,  ,
L) between 2 mesh-points did not exceed 2% (the default
value being 10%). These modifications produced timesteps 2 to 3 times
shorter than in the standard case and a number of shells ranging between 2000 and 4000. In all cases, the flame was stopped before reaching the
stellar center. The differences between these simulations are visible
in the duration of the flame or/and on the mass coordinate of the
deepest extent of the convection zone, but the overall variations never
exceed
,
L) between 2 mesh-points did not exceed 2% (the default
value being 10%). These modifications produced timesteps 2 to 3 times
shorter than in the standard case and a number of shells ranging between 2000 and 4000. In all cases, the flame was stopped before reaching the
stellar center. The differences between these simulations are visible
in the duration of the flame or/and on the mass coordinate of the
deepest extent of the convection zone, but the overall variations never
exceed  .
We also report that simulations performed with a lower
spatial resolution can result in the occurrence of 3 separate
convective episodes, consisting of 2 carbon flashes of decreasing strength
and a flame.
.
We also report that simulations performed with a lower
spatial resolution can result in the occurrence of 3 separate
convective episodes, consisting of 2 carbon flashes of decreasing strength
and a flame.
![\begin{figure}
\par\includegraphics[width=9cm]{1362fig5.ps}
\end{figure}](/articles/aa/full_html/2009/14/aa11362-08/img37.png) |
Figure 5:
Evolution of the 12C profiles after the quenching of the
convective flame in the 9.5 |
| Open with DEXTER | |
3.3 Evolution of the core composition
After the quenching of the flame, carbon burning resumes in a shell and initiates the development of secondary convective zones as the peak temperature moves through residual carbon pockets (Fig. 2). However, thermohaline mixing continues to operate in the central regions, smoothing the chemical profiles (Fig. 5). In contrast to the standard case where the central 12C mass fraction drops suddenly when the flame reaches the center, the transport of chemicals produces a continuous decline in the central carbon abundance (Fig. 6) concomitant with a decrease in 16O and an increase in 23Na and 20Ne. In the end, the models computed with thermohaline mixing have a higher amount of carbon in their core (Table 1).
During the subsequent thermally pulsing AGB phase, the core mass increases
due to mass accretion from the H and He burning shells. In the course of
its evolution, if the core mass reaches the critical value of 1.37
(Nomoto 1984), electron capture (EC) reactions are activated and trigger
the hydrodynamical collapse of the core. The initial mass of single stars
ending their life as EC-supernovae (EC-SN) is highly uncertain and depends
on the mixing processes operating during central H and He burning and on
the competition between core growth and mass loss rates during the TP-SAGB
phase. The studies of Siess (2007) and Poelarends et al. (2008) indicate
that the mass range of EC-SN progenitors is probably small (<1 ),
supporting the idea of a binary scenario in which an oxygen-neon (ONe)
white dwarf accretes material from a companion star (Podsiadlowski et al.
2004). However, most importantly for our purpose, the details of the
explosion depend sensitively on the core composition. Gutiérrez
et al. (2005) showed that traces of unburnt carbon as low as 1.5% in
mass can trigger a low- to moderate-density explosion that would completely
disrupt the star instead of a high density explosion where the star
collapses to form a neutron star. Our results including thermohaline
mixing indicate that the amount of carbon left in the core is large enough
to produce a complete disruption of the ONe core. Thermohaline mixing may
thus alter the fate of the star as well as nucleosynthesis but these
aspects should be explored.
![\begin{figure}
\par\includegraphics[width=9cm]{1362fig6.ps}
\end{figure}](/articles/aa/full_html/2009/14/aa11362-08/img38.png) |
Figure 6:
top panel: evolution of the carbon luminosity. The solid
line corresponds to the standard case while the dotted short- and
long-dashed lines to the mixing case with
|
| Open with DEXTER | |
 and 103,
respectively. lower panel: Evolution of the central 12C
mass fraction for the same stars. Dots on the curves indicate the time
of extinction of the convective flame.
and 103,
respectively. lower panel: Evolution of the central 12C
mass fraction for the same stars. Dots on the curves indicate the time
of extinction of the convective flame.
3.4 The thermally pulsing SAGB phase
We continued the evolution of our reference 9.5
model during the
thermally pulsing super-AGB (TP-SAGB) phase. In SAGB stars, the temperature
below the convective envelope is too high (>
 K) for
3He to survive, and with a mass fraction as small as 10-11, its
nuclear burning is unable to modify significantly the mean molecular weight
and thus trigger mixing. The peak flux of the
3He(3He,2p)4He reaction is located within the
convective envelope and, given the short convective turnover timescale,
is unable to increase. Therefore, thermohaline mixing is
inhibited during the TP-SAGB phase and this conclusion can be extended to
intermediate-mass AGB stars that experience hot bottom burning i.e., stars
with
K) for
3He to survive, and with a mass fraction as small as 10-11, its
nuclear burning is unable to modify significantly the mean molecular weight
and thus trigger mixing. The peak flux of the
3He(3He,2p)4He reaction is located within the
convective envelope and, given the short convective turnover timescale,
is unable to increase. Therefore, thermohaline mixing is
inhibited during the TP-SAGB phase and this conclusion can be extended to
intermediate-mass AGB stars that experience hot bottom burning i.e., stars
with  (depending on the metallicity). As for the lower
mass AGB stars, the possible activation of thermohaline mixing depends
strongly on the amount of 3He remaining in the convective
envelope. This abundance depends on the mixing history and, in particular,
on the efficiency parameter Ct (see also Cantiello et al. 2008). As a
conclusion, thermohaline mixing does not affect the surface abundances
during the TP-SAGB phase.
(depending on the metallicity). As for the lower
mass AGB stars, the possible activation of thermohaline mixing depends
strongly on the amount of 3He remaining in the convective
envelope. This abundance depends on the mixing history and, in particular,
on the efficiency parameter Ct (see also Cantiello et al. 2008). As a
conclusion, thermohaline mixing does not affect the surface abundances
during the TP-SAGB phase.
Table 1:
Selected evolutionary properties of the SAGB models as a
function of initial mass M ()
and mixing efficiency (Ct).
4 Efficiency of thermohaline mixing
The phenomenological description of thermohaline mixing is affected by
significant uncertainties, and to assess these effects, we computed new
9.5
models in which the factor Ct was arbitrarily set to 10 and
102. By changing Ct, we directly control the transport efficiency
because the characteristic mixing timescale scales as Ct-1. As is clear
from the previous section, thermohaline mixing becomes truly important after
carbon ignition. In the period following the quenching of the flash, the
arrival of fresh 12C in the nuclear, active layers previously
occupied by the convective instability boosts the nuclear energy
production. With a higher mixing rate, a larger amount of 12C is
injected into the burning layers and a higher carbon luminosity can be
sustained. We also note that, with increasing Ct and faster chemical
transport, the departure from the standard
curve in
Fig. 6 occurs at earlier times.
The sustained nuclear energy production is unable however to prevent core contraction and the temperature from increasing in the central regions. Carbon eventually reignites at a lower-mass coordinate, where 12C is more abundant, and a new convective zone develops that subsequently evolves into a flame. In all our models, the presence of thermohaline mixing prevents the convective zone from reaching the center. With decreasing mixing efficiency, the flame is stopped at a later time and thus penetrates deeper into the core. We also note that the temperature in the burning front is higher when the efficiency is higher. This is a natural response from the structure, which is forced to increase its temperature to cope with the decrease in nuclear energy production induced by the migration of 12C away from the burning front. After the flame extinction, the core composition continues to evolve until it reaches an asymptotic limit (Fig. 6). We see that a faster transport characterized by a higher value of Ct produces an earlier decrease in the central 12C mass fraction.
Concerning the final central carbon abundance, our simulations indicate
that it is relatively independent of the mixing efficiency
(Table 1). A closer look at the chemical profiles reveals that
after the quenching of the flame, the 12C profile presents a minimum
at a mass coordinate
 ,
which varies between
0.25-0.48
and increases with Ct. At
,
becomes positive
and thermohaline mixing is thus confined to the inner shells enclosing
.
The dilution of the unburnt carbon is thus larger in models
computed with a higher Ct but this effect is compensated for by the fact
that the amount of carbon left after the flame extinction is larger
in
these models.
This is why in our models the final carbon abundance appears
almost independent of the mixing
efficiency.
,
which varies between
0.25-0.48
and increases with Ct. At
,
becomes positive
and thermohaline mixing is thus confined to the inner shells enclosing
.
The dilution of the unburnt carbon is thus larger in models
computed with a higher Ct but this effect is compensated for by the fact
that the amount of carbon left after the flame extinction is larger
in
these models.
This is why in our models the final carbon abundance appears
almost independent of the mixing
efficiency.
5 Mixing as a function of initial stellar mass
The effect of thermohaline mixing in stars of different masses is
illustrated in Fig. 7. In all cases, thermohaline mixing
prevents the convective flame from reaching the center. In the 9
model, the star experiences 2 short-lived carbon flashes before the
convective flame develops. In the higher mass range ( ), only
one convective episode is present, the flash progressively evolving into a
flame. The main reason for the absence of a classical flash+flame pattern
in these models is due to the fast injection of carbon into the
convective burning zone that boosts the nuclear energy production. The
extra heat source induced by mixing compensates for the cooling associated
with the modest expansion and prevents the drop in both
and
temperature. As a consequence, carbon burning is maintained at the base of
the convective zone and the flash moves inwards instead of receding as in
the standard case. This effect is not present in the lower-mass models
because carbon ignites at a higher degeneracy. A much
stronger flash is generated leading to a more rapid expansion and stronger
cooling of the structure that cannot be counterbalanced by the increased
nuclear energy production induced by the transport of 12C.
), only
one convective episode is present, the flash progressively evolving into a
flame. The main reason for the absence of a classical flash+flame pattern
in these models is due to the fast injection of carbon into the
convective burning zone that boosts the nuclear energy production. The
extra heat source induced by mixing compensates for the cooling associated
with the modest expansion and prevents the drop in both
and
temperature. As a consequence, carbon burning is maintained at the base of
the convective zone and the flash moves inwards instead of receding as in
the standard case. This effect is not present in the lower-mass models
because carbon ignites at a higher degeneracy. A much
stronger flash is generated leading to a more rapid expansion and stronger
cooling of the structure that cannot be counterbalanced by the increased
nuclear energy production induced by the transport of 12C.
The premature quenching of the convective flame leaves unburnt amounts
of carbon in the core (Table 1). With increasing initial mass, carbon
ignites closer to the center because of the lower degeneracy. It is thus
logical that, for a given mixing efficiency, the flame also stops closer to
the center and the central carbon mass fraction decreases when the initial
mass increases. These computations indicate that, except for the most
massive stars ( with our parameters), the central carbon
mass fraction remains above the theoretical threshold of 0.015 for core
disruption.
with our parameters), the central carbon
mass fraction remains above the theoretical threshold of 0.015 for core
disruption.
![\begin{figure}
\par\includegraphics[width=8.8cm]{1362fig7.ps}
\end{figure}](/articles/aa/full_html/2009/14/aa11362-08/img46.png) |
Figure 7:
Kippenhahn diagrams of the carbon burning phase of solar
metallicity super-AGB stars in the mass range 9 to 11 |
| Open with DEXTER | |
6 Summary
We have analyzed the effect of thermohaline mixing in the evolution of
super-AGB stars in the mass range 9-11 .
We have found that this
instability operates after the carbon is ignited. The efficient transport
of chemicals and particularly of 12C away from the core deprives the
burning front of the fuel needed to power the combustion. The nuclear
energy production consequently drops and the flame quenches before it
reaches the center. This leaves relatively large amounts of unburnt
12C in the central regions (
 )
that may have
important consequences if the stellar core is able to reach the critical
mass of 1.37
and activate electron-capture reactions. We also
found that the final central 12C abundance does not depend strongly
on the mixing efficiency. The core composition of the most massive
SAGB stars is less affected by thermohaline mixing because the carbon ignites
closer to the center in these models. During the thermally pulsing
super-AGB phase, the high temperature encountered at the base of the
convective envelope prevents the establishment of a mean molecular
inversion because of the absence of 3He. Hot bottom burning thus
inhibits the thermohaline mixing. To conclude, we emphasize that other
hydrodynamical instabilities, associated for example with rotation or
magnetic fields, may interfere with thermohaline mixing and erase
before this instability can develop. Multi-D hydrodynamical
simulations are required to clarify this issue and provide a clearer
description of this process.
)
that may have
important consequences if the stellar core is able to reach the critical
mass of 1.37
and activate electron-capture reactions. We also
found that the final central 12C abundance does not depend strongly
on the mixing efficiency. The core composition of the most massive
SAGB stars is less affected by thermohaline mixing because the carbon ignites
closer to the center in these models. During the thermally pulsing
super-AGB phase, the high temperature encountered at the base of the
convective envelope prevents the establishment of a mean molecular
inversion because of the absence of 3He. Hot bottom burning thus
inhibits the thermohaline mixing. To conclude, we emphasize that other
hydrodynamical instabilities, associated for example with rotation or
magnetic fields, may interfere with thermohaline mixing and erase
before this instability can develop. Multi-D hydrodynamical
simulations are required to clarify this issue and provide a clearer
description of this process.
Acknowledgements
Marc Joos participated in the early exploration of thermohaline mixing in SAGB stars as part of his bachelor project and is acknowledged for his input. LS is FNRS research scientist. The author also thanks the anonymous referee for constructive comments. This research was supported under Australian Research Council's Discovery Projects funding scheme (project number DP0877317) and by the Communauté française de Belgique - Actions de Recherche Concertées.
References
- Bitzaraki, O. M., Rovithis-Livaniou, H., Tout, C. A., & van den Heuvel, E. P. J. 2004, A&A, 416, 262 In the text
- Cantiello, M., & Langer, N. 2008, IAU Symp., 252, 103 In the text
- Charbonnel, C., & Zahn, J.-P. 2007, A&A, 467, L15 In the text
- Eggleton, P. P., Dearborn, D. S. P., & Lattanzio, J. C. 2006, Science, 314, 1580 In the text
- Eggleton, P. P., Dearborn, D. S. P., & Lattanzio, J. C. 2008, ApJ, 677, 581 In the text
- de Grève, J. P., & Cugier, K. 1989, A&A, 211, 356
- Garcia-Berro, E., Ritossa, C., & Iben, I. 1997, ApJ, 485, 765 In the text
- Gil-Pons, P., & Garcia-Berro, E. 2002, A&A, 296, 589 In the text
- Gil-Pons, P., Suda, T., Fujimoto, M. Y., et al. 2005, ApJ, 433, 1037 In the text
- Gil-Pons, P., Gutiérrez, J., & Garcia-Berro, E. 2007, A&A, 464, 667 In the text
- Grevesse, N., Noels, A., & Sauval, A. J. 1996, ASPC, 99, 117 In the text
- Gutiérrez, J., Canal, R., & García-Berro, E. 2005, A&A, 435, 231 In the text
- Iben, I., Ritossa, C., & Garcia-Berro, E. 1997, ApJ, 489, 772 In the text
- Kippenhahn, R., Ruschenplatt, G., & Thomas, H.-C. 1980, A&A, 91, 175 In the text
- Krishnamurti, R. 2003, J. Fluid. Mech., 483, 287 In the text
- Marks, P. B., & Sarna, M. J. 1998, MNRAS, 301, 699 In the text
- Nomoto, K. 1984, ApJ, 277, 791 In the text
- Podsiadlowski, P., Langer, N., Poelarends, A. J. T., et al. 2004, ApJ, 612, 1044 In the text
- Poelarends, A. J. T., Herwig, F., Langer, N., & Heger, A. 2008, ApJ, 675, 614 In the text
- Ritossa, C., Garcia-Berro, E., & Iben, I. 1996, ApJ, 460, 489 In the text
- Ritossa, C., Garcia-Berro, E., & Iben, I. 1999, ApJ, 515, 381 In the text
- Siess, L. 2006, A&A, 448, 717 In the text
- Siess, L. 2007, A&A, 476, 893 In the text
- Siess, L., & Arnould, M. 2008, A&A, 489, 395 In the text
- Stancliffe, R. J., & Glebbeek, E. 2008, MNRAS, 389, 1828 In the text
- Timmes, F. X., Woosley, S. E., & Taam, R. E. 1994, ApJ, 420, 348 In the text
- Thomas, H.-C. 1967, Z. Astrophys. 67, 420 In the text
- Ulrich, R. K. 1972, ApJ, 172, 165 In the text
- Vauclair, S. 2004, ApJ, 605, 874 In the text
- Wellstein, S., Langer, N., & Braun, H. 2001, A&A, 369, 939 In the text
Footnotes
- ... mixing
![[*]](/icons/foot_motif.png)
- Hereafter, a standard model designates a stellar model computed without thermohaline mixing.
- ... value
- This region is traditionally referred to as the precursor flame (Garcia-Berro et al. 1997).
All Tables
Table 1:
Selected evolutionary properties of the SAGB models as a
function of initial mass M (![]() )
and mixing efficiency (Ct).
)
and mixing efficiency (Ct).
All Figures
| |
Figure 1:
Top panel: evolution of the surface 3He
abundance. Bottom panel: Kippenhahn diagram showing the evolution
of the internal structure of a 9.5 |
| Open with DEXTER | |
| In the text | |
| |
Figure 2:
Compared evolution of a 9.5 |
| Open with DEXTER | |
| In the text | |
| |
Figure 3:
The left panel depicts the evolution of the thermohaline
diffusion coefficient Dt at various epochs during the propagation of
the flame in our reference 9.5 |
| Open with DEXTER | |
| In the text | |
| |
Figure 4:
Carbon ignition lines as a function of the 12C mass
fraction. For a given carbon abundance as indicated by the label, the
region located below the selected curve is where
|
| Open with DEXTER | |
| In the text | |
| |
Figure 5:
Evolution of the 12C profiles after the quenching of the
convective flame in the 9.5 |
| Open with DEXTER | |
| In the text | |
| |
Figure 6:
top panel: evolution of the carbon luminosity. The solid
line corresponds to the standard case while the dotted short- and
long-dashed lines to the mixing case with
|
| Open with DEXTER | |
| In the text | |
| |
Figure 7:
Kippenhahn diagrams of the carbon burning phase of solar
metallicity super-AGB stars in the mass range 9 to 11 |
| Open with DEXTER | |
| In the text | |
Copyright ESO 2009
Current usage metrics show cumulative count of Article Views (full-text article views including HTML views, PDF and ePub downloads, according to the available data) and Abstracts Views on Vision4Press platform.
Data correspond to usage on the plateform after 2015. The current usage metrics is available 48-96 hours after online publication and is updated daily on week days.
Initial download of the metrics may take a while.