| Issue |
A&A
Volume 497, Number 1, April I 2009
|
|
|---|---|---|
| Page(s) | 311 - 323 | |
| Section | Astronomical instrumentation | |
| DOI | https://doi.org/10.1051/0004-6361/200809868 | |
| Published online | 09 February 2009 | |
Effective area calibration of the reflection grating spectrometers of XMM-Newton
II. X-ray spectroscopy of DA white dwarfs
J. S. Kaastra1,2 - T. Lanz3 - I. Hubeny4 - F. B. S. Paerels5
1 - SRON Netherlands Institute for Space Research, Sorbonnelaan 2,
3584 CA Utrecht, The Netherlands
2 -
Sterrenkundig Instituut, Universiteit Utrecht, PO Box 80000, 3508 TA Utrecht, The Netherlands
3 -
Department of Astronomy, University of Maryland, College Park, MD 20742, USA
4 -
Department of Astronomy and Steward Observatory, The University of Arizona, Tucson, AZ 85721, USA
5 -
Department of Astronomy and Columbia Astrophysics Laboratory, Columbia University, 550 West 120th Street, New York, NY 10027, USA
Received 28 March 2008 / Accepted 3 July 2008
Abstract
Context. White dwarf spectra have been widely used as a calibration source for X-ray and EUV instruments. The in-flight effective area calibration of the reflection grating spectrometers (RGS) of XMM-Newton depend upon the availability of reliable calibration sources.
Aims. We investigate how well these white dwarf spectra can be used as standard candles at the lowest X-ray energies in order to gauge the absolute effective area scale of X-ray instruments.
Methods. We calculate a grid of model atmospheres for Sirius B and HZ 43A, and adjust the parameters using several constraints until the ratio of the spectra of both stars agrees with the ratio as observed by the low energy transmission grating spectrometer (LETGS) of Chandra. This ratio is independent of any errors in the effective area of the LETGS.
Results. We find that we can constrain the absolute X-ray spectrum of both stars with better than 5% accuracy. The best-fit model for both stars is close to a pure hydrogen atmosphere, and we put tight limits to the amount of helium or the thickness of a hydrogen layer in both stars. Our upper limit to the helium abundance in Sirius B is 4 times below the previous detection based on EUVE data. We also find that our results are sensitive to the adopted cut-off in the Lyman pseudo-continuum opacity in Sirius B. We get best agreement with a long wavelength cut-off.
Conclusions. White dwarf model atmospheres can be used to derive the effective area of X-ray spectrometers in the lowest energy band. An accuracy of 3-4% in the absolute effective area can be achieved.
Key words: stars: atmospheres - X-rays: stars - X-rays: general - instrumentation: spectrographs - techniques: spectroscopic
1 Introduction
DA white dwarfs such as Sirius B and HZ 43A can be used very
well as calibration sources for UV and X-ray spectrometers. This is because
their spectra are simple and dominated by hydrogen features. In some cases there
are small traces of He visible in the spectrum. The simplicity of their
constitution and in particular for the hotter stars the straightforward physics
of the atmosphere allows ab initio calculations of the emerging spectra. The
models depend only upon a few free parameters, predominantly the effective
temperature
![]() ,
the surface gravity g and the relative helium
to hydrogen number density. The effective temperature and surface gravity can be
deduced from optical or UV spectra (Balmer and Lyman series). Despite the
relatively low surface temperatures, that are generally below 105 K, DA white
dwarfs emit soft X-rays because of the low opacity of the atmosphere for the
high energy photons that are produced in the deep and hot inner layers of the
star (Shipman 1976). Therefore, if an independent estimate of the radius of
the star as well as its distance are known, the ab initio calculations yield in
principle a model spectrum for the full spectral range including the X-ray band,
with known shape and normalisation (excluding ISM opacity). By comparing such a
model spectrum to the X-ray spectrum as observed with a given instrument, the
effective area of that instrument can be calibrated.
,
the surface gravity g and the relative helium
to hydrogen number density. The effective temperature and surface gravity can be
deduced from optical or UV spectra (Balmer and Lyman series). Despite the
relatively low surface temperatures, that are generally below 105 K, DA white
dwarfs emit soft X-rays because of the low opacity of the atmosphere for the
high energy photons that are produced in the deep and hot inner layers of the
star (Shipman 1976). Therefore, if an independent estimate of the radius of
the star as well as its distance are known, the ab initio calculations yield in
principle a model spectrum for the full spectral range including the X-ray band,
with known shape and normalisation (excluding ISM opacity). By comparing such a
model spectrum to the X-ray spectrum as observed with a given instrument, the
effective area of that instrument can be calibrated.
Table 1: Summary of LETGS observations used in this paper.
Even when the distance or radius of the star are not accurately known, measurements of the absolute optical flux of the star can be used to scale the X-ray flux of the star. In the optical band, absolute fluxes can be determined with an accuracy of the order of a percent (Holberg & Bergeron 2006).
The Chandra low energy transmission grating spectrometer (LETGS) is
currently the most sensitive high-resolution X-ray spectrometer operating in
the softest X-ray band. The effective area calibration as produced by the
Chandra X-ray Center was described by Pease et al. (2000); essentially, a pure
hydrogen, non-LTE model for Sirius B with
![]() K and
g=107 m s-2 was used (Holberg et al. 1998), with an estimated flux
uncertainty of less than 10%. A correction factor to the effective area was
determined by comparing the observed spectrum of Sirius B to this model. Using
the resulting corrected effective area, the observed LETGS spectrum of HZ 43A
agreed within 10-15% with a model spectrum for that source. Later
refinements of the effective area (Pease et al. 2003) mainly concerned the
mid-energy range, based on spectra of the blazars PKS 2155-304,
3C 273 and the isolated neutron star RXJ 1856.5-3754.
K and
g=107 m s-2 was used (Holberg et al. 1998), with an estimated flux
uncertainty of less than 10%. A correction factor to the effective area was
determined by comparing the observed spectrum of Sirius B to this model. Using
the resulting corrected effective area, the observed LETGS spectrum of HZ 43A
agreed within 10-15% with a model spectrum for that source. Later
refinements of the effective area (Pease et al. 2003) mainly concerned the
mid-energy range, based on spectra of the blazars PKS 2155-304,
3C 273 and the isolated neutron star RXJ 1856.5-3754.
Alternatively, at SRON, Kaastra and Heise derived the effective area of the LETGS following a different approach described in an internal report (Kaastra 2000). Basically, a grid of models was calculated using a version of Tlusty (Hubeny & Lanz 1995; Hubeny 1988) available at that time, with the effective temperature and gravity as free parameter, for both Sirius B and HZ 43A. A 6-dimensional grid search was done (varying for each source the effective temperature, gravity and interstellar absorption column), in order to find the best matching spectrum using as constraints (i) that the ratio of both model spectra should match as closely as possible the measured count ratio with the LETGS; (ii) that the 70-170 Å spectrum of Sirius B must be within the error bars of the model as derived by Holberg et al. (1998); and (iii) that the model parameters should not be too far off from the parameters for both stars as listed in the literature.
The effective area of the LETGS as derived by Kaastra (2000) and Pease et al. (2000) differ typically by 10%, but the differences are not constant as a function of wavelength.
More recently, Beuermann et al. (2006) have tackled the problem of
cross-calibration again using LETGS spectra of Sirius B, HZ 43A as well as
RXJ 1856.5-3754. Assuming a double blackbody model for the latter source, and
running grids of white dwarf models for the first two sources, they derived the
effective area of the LETGS by fitting simultaneously the parameters of these
stars and the effective area correction factor. Based on their solution, they
concluded that the Extreme UltraViolet Explorer (EUVE) short wavelength (SW)
detector effective area is off by ![]() 15% and that the ROSAT PSPC detector
agrees within a few percent with the LETGS.
15% and that the ROSAT PSPC detector
agrees within a few percent with the LETGS.
However, the assumption of a double blackbody model for the neutron star is not unquestionable. For instance, the source could have a more complicated atmosphere, or there may be multiple hot spots or a single spot with multi-temperature structure. Also, comparing our model calculations to the models derived by Beuermann et al. (2006) shows some significant differences, even if the same stellar parameters are used (see Sect. 5.5). This gives us sufficient motivation to re-examine carefully the calibration of the LETGS and the model spectra employed for both white dwarfs.
This paper is the second of a series of three intended to derive the absolute effective area of the reflection grating spectrometer (RGS) of XMM-Newton and through this of other instruments. In our first paper (Kaastra et al. 2009a) we have studied the RGS spectrum of Crab and derived accurately the interstellar absorption towards that source. However, the main uncertainty of 10 percent on the absolute flux of Crab could not be resolved. In the present paper we show how we can accurately calibrate the low-energy effective area of the Chandra LETGS using white dwarfs. In our third paper (Kaastra et al. 2009b) we combine these results on white dwarfs with the Crab results using blazar spectra taken simultaneously with the RGS and LETGS. This leads to a reduction of the uncertainty in the Crab flux and absolute effective area of the RGS to about 3 percent.
2 Data analysis and spectral modelling
We follow the same procedures as Kaastra (2000) but use the currently best available spectral models and boundary conditions. In Sect. 2.1 we derive the intensity ratio of the spectra of Sirius B and HZ 43A as measured by the Chandra LETGS. We will adjust the parameters of both stars using a number of boundary conditions until the best agreement with this observed intensity ratio is obtained. Section 2.2 describes our model for the white dwarf atmospheres. These model spectra essentially give the surface flux of the atmosphere, so we describe the scaling procedure to obtain the flux received at Earth in Sect. 2.3. In Sect. 2.4 we list all constraints that we apply to our models, and Sect. 2.5 describes our spectral fitting procedure.
2.1 Data analysis
The data used in this paper are summarised in Table 1. All data were obtained with the high resolution camera (HRC-S) in combination with the low energy transmission grating (LETG). We will call this combination here LETGS, as in our paper we do not use the LETG combined with the ACIS-S detector.
For Sirius B we used all three LETGS spectra taken October 26-29, 1999. The net total exposure time is 44.6 ks. Recently (18 January 2008) the source was observed again for calibration purposes but as the source was close to the detector edge we do not use these data. For HZ 43A we used observation ID 59, observed November 12, 1999, with a net exposure time of 38.9 ks. HZ 43A is monitored regularly since then, but as we are only interested in the ratio of the spectra of Sirius B to HZ 43A, and HZ 43 A is the strongest source, the statistical uncertainty on the ratio is dominated by the statistical uncertainty of the Sirius B spectrum. Moreover, the sensitivity of the LETGS slowly decreases over time (Beuermann et al. 2006), and therefore it is important to compare observations not too far apart in time.
The data processing is similar to Kaastra et al. (2002). Periods with high background are filtered out in two steps. In the first step, the observation is split into 1 s intervals; all intervals where the total detector count rate saturates (more than 180 counts s-1) are discarded. After this a light curve for the zeroth order spectrum of the source is created, binned in 100 s intervals. This serves to check the constancy of the source. All intervals with less than 50 s exposure are discarded. The remaining exposure time is then corrected for dead time using the standard dead time correction factors taken every 2.05 s, provided with each dataset.
A few other health checks are made; in one of these, we compare the average
pulseheight (PHA) of the dispersed spectrum with a reference spectrum. This
comparison is done in 2-20 Å wide bins, and the average PHA difference of
the spectrum compared to the standard is calculated (see
Table 1). Clearly, the average PHA in Sirius B observation 1452
is significantly lower than for all other observations. Also, the average zeroth
order count rate is lower: while the count rates for observation 1421 and 1459
are consistent with an average value of
![]() counts s-1, for
observation 1452 we have
counts s-1, for
observation 1452 we have
![]() counts s-1, or 3.6% less
counts. A smaller effect is present in the dispersed spectra of Sirius B. We
have fitted all three spectra individually and found that their shapes are -
within the error bars - consistent with the same model, but the average flux
for observation 1452 is
counts s-1, or 3.6% less
counts. A smaller effect is present in the dispersed spectra of Sirius B. We
have fitted all three spectra individually and found that their shapes are -
within the error bars - consistent with the same model, but the average flux
for observation 1452 is
![]() % smaller than for the other observations.
As observation 1452 contributes 43% to the total exposure time for Sirius B,
we kept the data but corrected the fluxes of the total spectrum by +0.34% to
account for the lower sensitivity during observation 1452. In this way, the data
for both stars are all corrected to a similar PHA-level.
% smaller than for the other observations.
As observation 1452 contributes 43% to the total exposure time for Sirius B,
we kept the data but corrected the fluxes of the total spectrum by +0.34% to
account for the lower sensitivity during observation 1452. In this way, the data
for both stars are all corrected to a similar PHA-level.
The spectra were extracted from a region with half-width h in the cross-dispersion
given by
![]() where h is in arcsec and
where h is in arcsec and
![]() is the wavelength in Å. The background was extracted from the two
rectangular regions between 10
is the wavelength in Å. The background was extracted from the two
rectangular regions between 10
![]() -40
-40
![]() above and below the source
spectrum, in the cross-dispersion direction.
above and below the source
spectrum, in the cross-dispersion direction.
![\begin{figure}
\par\includegraphics[angle=-90,width=9cm,clip]{09868f1.ps}
\end{figure}](/articles/aa/full_html/2009/13/aa09868-08/img23.gif) |
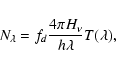
Figure 1: Ratio of the spectrum of Sirius B to the spectrum of HZ 43A. data points with error bars: ratio as observed by the LETGS. The solid line shows our best-fit model 2 (with a long wavelength cut-off of the Lyman pseudo-continuum), and the dotted line our best-fit model 1 (short cut-off), as discussed in Sect. 4. The lower panel shows the fit residuals of the observed ratio with respect to model 2; the dotted line in that panel shows on the same scale the differences between model 2 and model 1. Note that the first data point at 50 Å is off-scale in this lower panel. |
| Open with DEXTER | |
The spectra of both stars were fitted with a spline continuum with knots with a spacing of 5 Å; the values of the spline at each knot and the associated uncertainties were determined. This model was then folded through the response matrix, and higher spectral order contamination, although very small, was taken into account (see Sect. A.3 for an estimate of the associated uncertainty). From these fits to the count spectra, the ratio between both photon spectra was calculated. Thanks to the high spectral resolution, this ratio is independent on any errors in the effective area. The ratio is shown in Fig. 1.
2.2 White dwarf model spectra
The white dwarf models that have been successfully used in modelling the spectra of Sirius B and HZ 43A can be classified as follows:
- 1.
- pure hydrogen models;
- 2.
- homogeneous H-He models;
- 3.
- stratified models with a hydrogen layer atop of a helium atmosphere.
In most cases the differences between the models in the UV and optical part of the spectrum are small, which is no surprise as the range of parameters has been adopted from previous studies that estimated these parameters by fitting the optical and UV spectra. However, as the X-ray spectrum can be considered more or less as an exponential tail to the full spectrum, a tiny shift in effective temperature or surface gravity can have a large effect to the X-ray spectrum. For this reason the X-ray spectra need to be calculated with care.
2.2.1 Compton scattering
A potential important effect for the radiative transfer of X-ray photons in the white dwarf atmosphere is Compton scattering. This was first indicated by Madej (1998) for the case of HZ 43A. Hard X-ray photons scatter many times before they reach the surface of the star, and the combined effect of all the collisions with relatively cool electrons can cause a significant energy loss for these photons, and therefore a softening of the high-energy tail of the spectrum. This effect is most noticeable at wavelengths smaller than 100 Å. However, recently Suleimanov et al. (2006) showed using a more sophisticated calculation that for both HZ 43A and Sirius B Compton scattering can be completely ignored. Therefore, in the present calculations we will also ignore Compton scattering.
2.2.2 Hydrogen Lyman pseudo-continuum opacity
When we compared our calculations in detail with the calculations of Beuermann et al. (2006, see Sect. 5.5 for more details), we got a good agreement for HZ 43A but large differences for Sirius B in the EUV/X-ray band. A detailed investigation of the problem showed that the differences are due to the treatment of the Lyman pseudo-continuum.
What basically happens is the following. In the high density atmosphere of Sirius B, the density is high enough that a fraction of the atoms have neighbours so nearby that they are significantly perturbed. The highest energy levels for these atoms become partly dissolved, that is an atom ending in them can be viewed as ionised, and these levels are viewed as partly dissolved, and partly truly occupied. Hummer & Mihalas (1988) have considered this phenomenon in detail, and calculated well-defined occupation probabilities for hydrogenic levels.
Consequently, in addition to a traditional continuum that extends from the
photoionisation threshold shortward and that corresponds to a true
photoionisation, there is also a ``pseudo-continuum'' that extends longward of the
threshold, and that corresponds to transitions from a bound lower level to the
dissolved parts of higher levels. The basic physical process is well-defined,
because a transition to the dissolved part of the level leaves an atom indeed in
an unbound state and thus the process is a sort of photoionisation, but the
essential problem is how to formulate the appropriate cross-section for the
pseudo-continuum. According to the standard approach
(Hubeny et al. 1994; Däppen et al. 1987), the cross-section is formulated through an
extrapolation of the traditional photoionisation cross-section shortward of the
edge, and the so-called ``dissolved fraction'' that is given through a dissolution
probability of a fictitious level that would correspond to the current frequency
![]() (for details, refer to the above cited papers). Hubeny et al. (1994)
outlined a proof of this assertion, but stressed that the proof only applies
``close to the photoionisation limit''. It is hard to specify exactly how far from
the edge is the formalism valid, but it was certainly never meant to extend
hundreds or even thousands of Ångstroms away from the edge. Therefore, most
researchers begun to use ad hoc cut-off frequencies for the pseudo-continuum
cross-sections, with the belief that their actual values do not significantly
influence modelling results. Some researchers have even introduced smoothed
cut-off regions (Bergeron, private communication), but in any case it should be
clearly understood that any cut-off is a completely ad hoc concept.
(for details, refer to the above cited papers). Hubeny et al. (1994)
outlined a proof of this assertion, but stressed that the proof only applies
``close to the photoionisation limit''. It is hard to specify exactly how far from
the edge is the formalism valid, but it was certainly never meant to extend
hundreds or even thousands of Ångstroms away from the edge. Therefore, most
researchers begun to use ad hoc cut-off frequencies for the pseudo-continuum
cross-sections, with the belief that their actual values do not significantly
influence modelling results. Some researchers have even introduced smoothed
cut-off regions (Bergeron, private communication), but in any case it should be
clearly understood that any cut-off is a completely ad hoc concept.
In fact, a more rigorous treatment of this problem should be developed, perhaps analogously to a recent treatment of the pseudo-continuum cross-sections for neutral perturbers by Kowalski & Saumon (2006) and Kowalski (2006), but this was not yet done. For the moment, we are left with a necessity of using artificial cut-offs. The TMAP code (Werner et al. 2003) employed by Beuermann et al. (2006) uses a long cut-off at 2431 Å, while the default for Tlusty, employed in the present work, is a short cut-off at 925 Å, close to the Lyman edge. Lacking a better physical model for the pseudo-continuum, it is hard to decide which approach is better. Therefore we use in this paper two different sets of calculations: one with a short cut-off (referred to here as model 1), the other with a long cut-off (model 2).
2.3 Scaling of the white dwarf spectra
The model spectra calculated with our code gives the Eddington flux ![]() (usually expressed in units equivalent to W m-2 Hz-1). The photon
spectrum
(usually expressed in units equivalent to W m-2 Hz-1). The photon
spectrum ![]() (in photons m-2 s-1 Å-1) seen at Earth
is then given by
(in photons m-2 s-1 Å-1) seen at Earth
is then given by
where
For Sirius B, the distance is known accurately with a precision of 0.4% (the
HIPPARCOS-based parallax is
![]() ,
Holberg et al. 1998). Its radius R can be determined in principle from the
surface gravity
,
Holberg et al. 1998). Its radius R can be determined in principle from the
surface gravity
![]() ,
since the white dwarf mass
,
since the white dwarf mass ![]() is known with an accuracy of 1.5%. However, the typical uncertainty in
g is 15% based on fits to the optical and (extreme) ultraviolet spectra
(for example Holberg et al. 1998). Using the currently best available value
for the gravitational redshift (see later), the uncertainty in g is still
12%. Therefore, using this scaling in the form
is known with an accuracy of 1.5%. However, the typical uncertainty in
g is 15% based on fits to the optical and (extreme) ultraviolet spectra
(for example Holberg et al. 1998). Using the currently best available value
for the gravitational redshift (see later), the uncertainty in g is still
12%. Therefore, using this scaling in the form
![]() gives a flux uncertainty of at least 12%.
gives a flux uncertainty of at least 12%.
There is a simple way out, however. We define
![]() and
substitute
and
substitute
![]() in (1). For a given
spectral model, g is prescribed as one of the input parameters of the model
and therefore exactly known. It is easy to show that
in (1). For a given
spectral model, g is prescribed as one of the input parameters of the model
and therefore exactly known. It is easy to show that

with
For HZ 43B, the distance is less accurately known, and we use here the observed
flux in the optical band to scale the spectrum. The most accurate and best
calibrated flux is obtained in the V band: the V magnitude of HZ 43 is
![]() (Bohlin 2000). Holberg & Bergeron (2006) give the relation
between the monochromatic flux
(Bohlin 2000). Holberg & Bergeron (2006) give the relation
between the monochromatic flux ![]() at 5423 Å and the V magnitude as
at 5423 Å and the V magnitude as
![]() ,
within about 0.5%. This
corresponds to a photon flux of 71.25 phot m-2 s-1 Å-1 at
5423 Å. We use this flux to scale all our model calculations, and assign a
nominal uncertainty of 1% to it. Note that a similar procedure is harder to
apply to Sirius B, as contamination by Sirius A enhances photometric
uncertainties (see Sect. 2.4).
,
within about 0.5%. This
corresponds to a photon flux of 71.25 phot m-2 s-1 Å-1 at
5423 Å. We use this flux to scale all our model calculations, and assign a
nominal uncertainty of 1% to it. Note that a similar procedure is harder to
apply to Sirius B, as contamination by Sirius A enhances photometric
uncertainties (see Sect. 2.4).
2.4 Constraints on the spectral models
2.4.1 Gravitational redshift
The gravitational redshift of Sirius B is now known much more accurately using
STIS data (
![]() km s-1, Barstow et al. 2005) then
previously (for example
km s-1, Barstow et al. 2005) then
previously (for example ![]() km s-1, Greenstein et al. 1971;
km s-1, Greenstein et al. 1971;
![]() km s-1, Hébrard et al. 1999). This more accurate
gravitational redshift, combined with the mass derived from astrometric
methods allows an independent estimate of the surface gravity
km s-1, Hébrard et al. 1999). This more accurate
gravitational redshift, combined with the mass derived from astrometric
methods allows an independent estimate of the surface gravity
![]() or
or
 |
(3) |
using the same fundamental parameters as employed for (2). This leads to
For HZ 43A, Reid (1996) gives a value of
![]() km s-1;
Kruk et al. (2002) estimate the accuracy of this value to be 10-15 km s-1.
Therefore we limit our models to those cases where the gravitational redshift of
HZ 43A is within the 10-50 km s-1 range. We do this as follows. The
parallax of HZ 43 A is known to be
km s-1;
Kruk et al. (2002) estimate the accuracy of this value to be 10-15 km s-1.
Therefore we limit our models to those cases where the gravitational redshift of
HZ 43A is within the 10-50 km s-1 range. We do this as follows. The
parallax of HZ 43 A is known to be
![]() mas (van Altena et al. 1995). We
use this to derive the minimum and maximum allowed distance d. For a given
surface gravity, this distance range corresponds to an allowed range for
mas (van Altena et al. 1995). We
use this to derive the minimum and maximum allowed distance d. For a given
surface gravity, this distance range corresponds to an allowed range for
![]() when we use the accurately known value of
fd=R2/d2 derived from the optical flux (Sect. 2.3). We then
add this uncertainty in quadrature to a nominal uncertainty of 15 km s-1in the observed redshift. Solutions off by more than
when we use the accurately known value of
fd=R2/d2 derived from the optical flux (Sect. 2.3). We then
add this uncertainty in quadrature to a nominal uncertainty of 15 km s-1in the observed redshift. Solutions off by more than ![]() are discarded.
Also whenever the predicted range for
are discarded.
Also whenever the predicted range for
![]() does not overlap with the
10-50 km s-1 range, we discard the solution.
does not overlap with the
10-50 km s-1 range, we discard the solution.
2.4.2 Optical and UV flux of Sirius B
For HZ 43A, we already scale our spectra to agree with the optical flux of this star. Our model spectra for Sirius B must also be in agreement with optical and UV flux measurements (Table 2). We only consider here monochromatic fluxes, and avoid the use of magnitudes as this involves an extra complication, namely the convolution with filter transmissions. Care should be taken in assessing the uncertainties in those flux measurements.
Table 2: Measured monochromatic fluxes of Sirius B.
![\begin{figure}
\includegraphics[angle=-90,width=9cm,clip]{09868f2.ps}
\end{figure}](/articles/aa/full_html/2009/13/aa09868-08/img69.gif) |
Figure 2:
Spectrum of HZ 43 for stratified models with hydrogen layers
(in |
| Open with DEXTER | |
Hébrard et al. (1999) analysed the HST-GHRS Echelle-A spectrum of Sirius B. From
their Fig. 2 we measure the continuum flux at 1302 Å as
![]() W m-2 s-1 Å-1 or
W m-2 s-1 Å-1 or
![]() photons m-2 s-1 Å-1. Although the statistical errors are
small, systematic effects are larger as shown below.
photons m-2 s-1 Å-1. Although the statistical errors are
small, systematic effects are larger as shown below.
Mack et al. (1997) have calibrated the GHRS Echelle-A spectrometer by comparing
spectra with IUE spectra of the standard star ![]() Col. From their Fig. 4c we
find that the relative calibration accuracy of this instrument between
1250-1350 Å is
Col. From their Fig. 4c we
find that the relative calibration accuracy of this instrument between
1250-1350 Å is
![]() percent (the residual rms scatter between
the GHRS and IUE spectra). Thus, the flux depends critically upon the
calibration of IUE.
percent (the residual rms scatter between
the GHRS and IUE spectra). Thus, the flux depends critically upon the
calibration of IUE.
Bohlin et al. (1990) used more than 2700 individual IUE SWP and LWR spectra to
define the absolute flux distributions of the 37 HST standard stars in the
wavelength range 1150-3300 Å. They conclude that the systematic external
errors in the fluxes are less than 15 percent, while comparison with ANS flux
measurements demonstrates an internal consistency of the IUE spectrophotometry
of 2 percent. The basis for the absolute flux scale in the UV is given by the
spectrum of ![]() UMa, which has an uncertainty of 10% in its absolute flux
scale according to Bohlin et al. (1990). IUE fluxes may be too low by
UMa, which has an uncertainty of 10% in its absolute flux
scale according to Bohlin et al. (1990). IUE fluxes may be too low by
![]() 10%.
10%.
![\begin{figure}
\par\includegraphics[width=9cm,clip]{09868f3.ps}
\end{figure}](/articles/aa/full_html/2009/13/aa09868-08/img75.gif) |
Figure 3:
Contours of
|
| Open with DEXTER | |
![\begin{figure}
\par\includegraphics[angle=-90,width=9cm,clip]{09868f4.ps}
\end{figure}](/articles/aa/full_html/2009/13/aa09868-08/img76.gif) |
Figure 4: Ratio of the spectrum of Sirius B to the spectrum of HZ 43A. Data points with error bars: ratio as observed with EUVE. The solid line shows our best-fit model 2 (with a long wavelength cut-off of the Lyman pseudo-continuum, and the dotted line our best-fit model 1 (short cut-off), as discussed in Sect. 4. Note that these fits are based solely upon the Chandra LETGS data, not upon the EUVE data. The lower panel shows the residuals of the observed ratio with respect to model 2; the dotted line in that panel shows on the same scale the differences between model 2 and model 1. Note that the first two data points below 80 Å are off-scale in this lower panel. |
| Open with DEXTER | |
In summary, we combine the following errors: systematic uncertainty IUE scale:
10%; internal uncertainty IUE specrum ![]() Col: 2%; relative error
GHRS/IUE: 0.84%; statistical error GHRS spectrum Sirius B: 0.8%. The
resulting total uncertainty is 10.3%, obviously dominated by the uncertainty
in the absolute UV flux of
Col: 2%; relative error
GHRS/IUE: 0.84%; statistical error GHRS spectrum Sirius B: 0.8%. The
resulting total uncertainty is 10.3%, obviously dominated by the uncertainty
in the absolute UV flux of ![]() UMa. We therefore adopt a 1302 Å flux of
UMa. We therefore adopt a 1302 Å flux of
![]() photons m-2 s-1 Å-1. For this
wavelength, we can neglect any ISM continuum extinction.
photons m-2 s-1 Å-1. For this
wavelength, we can neglect any ISM continuum extinction.
Barstow et al. (2005) have analysed STIS spectra of Sirius B. From their Fig. 5,
we estimate the flux at 3500 and 4600 Å (using the G430L grating), and from
their Fig. 4, we estimate the flux at 6400 and 6700 Å (using the G750M
grating). The typical statistical uncertainty combined with the uncertainty on
the STIS flux scale is about 1%, and we adopt that as the nominal statistical
uncertainty. Barstow et al. (2005) argue that although STIS has been calibrated to
a nominal precision of ![]() 1%, the necessary usage of the narrow
1%, the necessary usage of the narrow
![]() slit for Sirius B gives an additional 4.5% error,
as estimated first by Bohlin & Hartig (1998). This error, however, always leads to
an underestimate of the flux. Therefore, we add a one-sided, positive systematic
uncertainty of 4.5% to the fluxes.
slit for Sirius B gives an additional 4.5% error,
as estimated first by Bohlin & Hartig (1998). This error, however, always leads to
an underestimate of the flux. Therefore, we add a one-sided, positive systematic
uncertainty of 4.5% to the fluxes.
In practice, for the five UV and optical flux values we add the statistical and
systematic uncertainties in quadrature, and calculate for each point the
contribution to a formal ![]() when comparing to a set of model fluxes. In
this, the one-sidedness of the systematic uncertainties in STIS fluxes is taken
into account. Whenever this
when comparing to a set of model fluxes. In
this, the one-sidedness of the systematic uncertainties in STIS fluxes is taken
into account. Whenever this ![]() (with 5 degrees of freedom) exceeds the
(with 5 degrees of freedom) exceeds the
![]() upper limit (at
upper limit (at
![]() )
we discard the solution.
)
we discard the solution.
![\begin{figure}
\par\includegraphics[angle=-90,width=9cm,clip]{09868f5.ps}
\end{figure}](/articles/aa/full_html/2009/13/aa09868-08/img81.gif) |
Figure 5: Fluxed EUVE spectrum of HZ 43A. Data points: observed spectrum with EUVE. The solid line shows our best-fit model 2 (with a long wavelength cut-off of the Lyman pseudo-continuum), and the dotted line our best-fit model 1 (short cut-off), as discussed in Sect. 4. The lower panel shows the ratio of the observed spectrum with respect to model 2; the dotted line in that panel shows on the same scale the differences between model 2 and model 1. |
| Open with DEXTER | |
2.4.3 EUVE flux of Sirius B
The EUV flux of Sirius B is a very sensitive indicator for the spectral parameters of this source (Holberg et al. 1998). Unfortunately, there is little information publicly available about the effective area calibration of EUVE.
The following information is given in the EUVE guest observer
handbook![]() . It explains at page 2-15
the calibration procedure, paraphrased below. ``Because of the lack of standard
stars in the EUV, the effective area of the spectrometers was determined from
model spectra for continuum sources. White dwarf stars provided the baseline
measurements. After spectra were extracted, white dwarf model spectra for the
object were input to a spectrometer simulation program, and the model parameters
adjusted to produce simulated data that match the observed spectra as nearly as
possible. In most cases,
. It explains at page 2-15
the calibration procedure, paraphrased below. ``Because of the lack of standard
stars in the EUV, the effective area of the spectrometers was determined from
model spectra for continuum sources. White dwarf stars provided the baseline
measurements. After spectra were extracted, white dwarf model spectra for the
object were input to a spectrometer simulation program, and the model parameters
adjusted to produce simulated data that match the observed spectra as nearly as
possible. In most cases,
![]() and g were well constrained by
other optical and UV spectra. The resulting models were then compared whenever
possible to photometric and spectroscopic EUV/soft X-ray observations of the
same target made with the ROSAT WFC, EXOSAT, HUT, IUE, and various rocket
experiments. The effective area function was then readjusted to bring the
measurements into better agreement''.
and g were well constrained by
other optical and UV spectra. The resulting models were then compared whenever
possible to photometric and spectroscopic EUV/soft X-ray observations of the
same target made with the ROSAT WFC, EXOSAT, HUT, IUE, and various rocket
experiments. The effective area function was then readjusted to bring the
measurements into better agreement''.
However, given the uncertainty of white dwarf fluxes measured with previous instruments in both the UV and soft X-ray band, as well as the strong dependence of the soft X-ray flux on slight changes in the spectral parameters, we believe there is significant systematic uncertainty involved; moreover, the ground calibration was accurate to about 25%. A fit to the EUVE spectrum of HZ 43 by Barstow et al. (1995) shows remaining residuals of the order of 5%. Also the analysis of Sing et al. (2002) of a sample of 7 DA white dwarfs shows systematic residuals up to 10%, with a typical scatter of 5%. We therefore assume that the absolute fluxes measured with EUVE have a systematic uncertainty of 10%.
We constrain our models using the EUVE flux measurement at 250 Å
(
![]() W m-2 Å-1),
taken from Fig. 1 of Holberg et al. (1998),
with a 10% statistical error margin added in quadrature to the systematic
uncertainty, to account for both the statistical and systematic uncertainties in
the EUVE spectrum. When the EUVE flux point at 250 Å exceeds the 1
W m-2 Å-1),
taken from Fig. 1 of Holberg et al. (1998),
with a 10% statistical error margin added in quadrature to the systematic
uncertainty, to account for both the statistical and systematic uncertainties in
the EUVE spectrum. When the EUVE flux point at 250 Å exceeds the 1![]() bound, we discard the solution.
bound, we discard the solution.
Finally, we list in Table 2 a constraint from the longest wavelength EUVE LW spectrometer, although the error on this estimate is large. The main reason for inclusion is that the spectrum at this wavelength is rather sensitive to the foreground absorption model, and we want our model not to be in conflict with this EUV constraint.
2.4.4 Interstellar absorption
Table 3: Adopted absorption parameters for Sirius B and HZ 43A. Numbers in brackets are derived from the basic numbers given in the other entries of this table.
The adopted values of the interstellar absorption towards Sirius B and HZ 43A
are shown in Table 3. The hydrogen column towards Sirius B is the
weighted average of
![]() m-2 (Hébrard et al. 1999, from
Ly
m-2 (Hébrard et al. 1999, from
Ly![]() with the HST-GHRS detector) and
with the HST-GHRS detector) and
![]() m-2 (Holberg et al. 1998, from Ly
m-2 (Holberg et al. 1998, from Ly![]() with IUE detector).
Unfortunately Sirius B has a low EUV flux such that only upper limits to the He
column densities are known: <
with IUE detector).
Unfortunately Sirius B has a low EUV flux such that only upper limits to the He
column densities are known: <
![]() m-2 for He I and
<
m-2 for He I and
<
![]() m-2 for He II (Wolff et al. 1999). Therefore, we
adopt the average H I/He I ratio of
m-2 for He II (Wolff et al. 1999). Therefore, we
adopt the average H I/He I ratio of
![]() derived for the
local environment of the Sun (Slavin & Frisch 2007). Similarly, we follow
Holberg et al. (1998) who use the average He II/He ratio of
derived for the
local environment of the Sun (Slavin & Frisch 2007). Similarly, we follow
Holberg et al. (1998) who use the average He II/He ratio of
![]() derived by Barstow et al. (1997). Note that the uncertainty in the hydrogen column
of Sirius B leads to an uncertainty of 34% in the predicted flux at 700 Å.
At shorther wavelengths the corresponding flux uncertainty is smaller, for
example only 2% at the peak of the soft X-ray spectrum (150 Å).
derived by Barstow et al. (1997). Note that the uncertainty in the hydrogen column
of Sirius B leads to an uncertainty of 34% in the predicted flux at 700 Å.
At shorther wavelengths the corresponding flux uncertainty is smaller, for
example only 2% at the peak of the soft X-ray spectrum (150 Å).
The neutral hydrogen column towards HZ 43A (Table 3) has been discussed in detail by Kruk et al. (2002), and we use their value. For He I and He II we use the weighted average of Wolff et al. (1999); Barstow et al. (1997); Dupuis et al. (1995), based on EUVE measurements.
Due to the low column densities, other ions than those from hydrogen and helium can be ignored in the Chandra band: we estimate that between 1-180 Å metals contribute less than 0.3% to the continuum opacity. For our opacity calculations, we use the model by Rumph et al. (1994). The uncertainty in the measured column densities hardly affects our estimated flux of HZ 43A in the Chandra band: at 180 Å where the ISM opacity is highest, the uncertainty in the column densities of H I, He I and He II corresponds to a transmission uncertainty of 0.3, 0.2 and 1.0%, respectively. The combined rms error is 1.1%. Hence, the uncertainty in our model is mainly determined by the intrinsic parameters of HZ 43A itself.
In our spectral modelling, for both stars we allowed the column densities for
HZ 43A and Sirius B (only H I) or the ratios H I/He I and
He II/He (for Sirius B) to vary between the
![]() limits as given
in Table 3.
limits as given
in Table 3.
2.5 Parameter estimation
Our model depends on twelve parameters, six for each star, namely the effective temperature, surface gravity, helium abundance or hydrogen layer thickness, and interstellar column densities of H I, He I and He II. Often there are strong correlations between these parameters, and we have a number of constraints to be obeyed (Sect. 2.4). In summary, these constraints are:
- 1.
- 250 Å EUVE flux of Sirius B;
- 2.
- optical and UV fluxes of Sirius B at 1302, 4600, 6400 and 6700 Å;
- 3.
 for Sirius B within the 2
 range of the value
derived from the gravitational redshift;
range of the value
derived from the gravitational redshift;
- 4.
- gravitational redshift of HZ 43A;
- 5.
- derived column densities (or ratios) towards both stars within
their 2
error limits.
where Oi and
We find the best solution using a Monte Carlo method. Starting with a broad
range of allowed parameters, we draw random sets of parameters within that
allowed range, and evaluate ![]() for each set. Solutions with
for each set. Solutions with ![]() larger than a threshold are discarded. After having obtained a sufficient number
of solutions, we slowly decrease the
larger than a threshold are discarded. After having obtained a sufficient number
of solutions, we slowly decrease the ![]() threshold and simultaneously
shrink the allowed parameter space, encompassing with some margin all solutions
that up to then have been acceptable. All acceptable solutions are stored, and
after having reached the best solution with
threshold and simultaneously
shrink the allowed parameter space, encompassing with some margin all solutions
that up to then have been acceptable. All acceptable solutions are stored, and
after having reached the best solution with
![]() we find the
errors on the parameters by finding for each parameter the minimum and maximum
value for which
we find the
errors on the parameters by finding for each parameter the minimum and maximum
value for which
![]() .
We also store each acceptable
spectrum, so we can also determine for each wavelength the range of allowed flux values.
.
We also store each acceptable
spectrum, so we can also determine for each wavelength the range of allowed flux values.
3 Models to be used for Sirius B and HZ 43A
3.1 Sirius B
For Sirius B we have used homogeneous models, which include a pure hydrogen atmosphere as limiting case.
We have also calculated a grid of stratified models for Sirius B, but we were
not able to obtain successful fits. Basically, we constrained the photometric
hydrogen column to the range of
![]()
![]() ,
around the
value of
,
around the
value of
![]()
![]() found by Holberg et al. (1998) for this
class of models. The main reason for the failure is that the stratified models
show a flux deficit of up to a factor of 2-3 around 50 Å as compared to
homogeneous models (see also Fig. 2); the deficit sets on below
80 Å. As this range was at the short wavelength end of the EUVE spectrometer,
Holberg et al. (1998) were not able to exclude this class of models completely.
Thanks to the sensitivity of Chandra it is now possible to rule out this class of models.
found by Holberg et al. (1998) for this
class of models. The main reason for the failure is that the stratified models
show a flux deficit of up to a factor of 2-3 around 50 Å as compared to
homogeneous models (see also Fig. 2); the deficit sets on below
80 Å. As this range was at the short wavelength end of the EUVE spectrometer,
Holberg et al. (1998) were not able to exclude this class of models completely.
Thanks to the sensitivity of Chandra it is now possible to rule out this class of models.
3.2 HZ 43A
For HZ 43A we first consider the homogeneous models. Barstow et al. (1995) have
put strict upper limits to the amount of He in HZ 43A, based on the limits to
the 304 Å line of He II in the EUVE spectrum. The nominal equivalent
width of this line derived by Barstow et al. is
![]() Å, but due to
possible systematic effects in the EUVE spectrum this cannot be regarded as a
detection. For their mixed He/H models, they obtain an upper limit of
Å, but due to
possible systematic effects in the EUVE spectrum this cannot be regarded as a
detection. For their mixed He/H models, they obtain an upper limit of
![]() for the He/H ratio. We have calculated a grid of homogeneous models
with He/H ratio's between 0 and 10-5. Our models with a small ratio such
as found by Barstow et al. (1995) yield fluxes in the Chandra band (10-180 Å)
that are 1.4-2.7% smaller than the fluxes for a pure H model, for the same
values of
for the He/H ratio. We have calculated a grid of homogeneous models
with He/H ratio's between 0 and 10-5. Our models with a small ratio such
as found by Barstow et al. (1995) yield fluxes in the Chandra band (10-180 Å)
that are 1.4-2.7% smaller than the fluxes for a pure H model, for the same
values of
![]() and g. It is clear that such small differences
can be easily accommodated for in a pure H model using slightly different
values for
and g. It is clear that such small differences
can be easily accommodated for in a pure H model using slightly different
values for
![]() and g, which are still consistent with the
limits from other parts of the spectrum to these numbers. We conclude that -
at least for our calibration purposes - we can safely adopt a pure hydrogen
model as far as the class of homogeneous models is concerned.
and g, which are still consistent with the
limits from other parts of the spectrum to these numbers. We conclude that -
at least for our calibration purposes - we can safely adopt a pure hydrogen
model as far as the class of homogeneous models is concerned.
The other important class of models that include He are the stratified models.
We have made a grid of models with a hydrogen layer mass between 10-14 and
10-10 ![]() .
All models with a hydrogen layer less than 10-13
.
All models with a hydrogen layer less than 10-13 ![]() produce too deep He features in the spectrum, consistent with the findings of
Barstow et al. (1995). On the other hand, if the hydrogen layer mass is
>10-11
produce too deep He features in the spectrum, consistent with the findings of
Barstow et al. (1995). On the other hand, if the hydrogen layer mass is
>10-11 ![]() ,
the spectrum cannot be distinguished from a pure hydrogen
atmosphere in the Chandra band. However in the case of an intermediate
thickness hydrogen layer of
,
the spectrum cannot be distinguished from a pure hydrogen
atmosphere in the Chandra band. However in the case of an intermediate
thickness hydrogen layer of ![]() 10-12
10-12 ![]() there is a significant
effect in the Chandra band (Fig. 2). For the lowest allowed
hydrogen column (
there is a significant
effect in the Chandra band (Fig. 2). For the lowest allowed
hydrogen column (
![]()
![]() ,
see below), there is a
,
see below), there is a ![]() 70%
flux reduction around 55 Å, diminishing rapidly for larger columns, while at
shorter wavelengths the flux is higher, peaking for
70%
flux reduction around 55 Å, diminishing rapidly for larger columns, while at
shorter wavelengths the flux is higher, peaking for
![]()
![]() and then diminishing rapidly in the pure hydrogen limit.
and then diminishing rapidly in the pure hydrogen limit.
Table 4: Lyman series of He II in HZ 43.
For this reason, we carefully reconsider the constraints to the hydrogen layer.
From the EUVE spectrum published by Barstow et al. (1995, their Fig. 2#, we
estimated the equivalent widths of the He II Ly![]() ,
,
![]() and
and
![]() absorption lines (Table 4). We compared these
equivalent widths with our model calculations. None of them can be regarded as a
detection. Combining all three lines, we obtain a best fit hydrogen mass
absorption lines (Table 4). We compared these
equivalent widths with our model calculations. None of them can be regarded as a
detection. Combining all three lines, we obtain a best fit hydrogen mass
![]()
![]() .
This mass predicts equivalent widths for the
He II Ly
.
This mass predicts equivalent widths for the
He II Ly![]() ,
,
![]() and
and ![]() lines of 0.02, 0.04 and 0.02 Å,
respectively. The 99% confidence lower limit is
lines of 0.02, 0.04 and 0.02 Å,
respectively. The 99% confidence lower limit is
![]()
![]() .
While the lower limit is rather strict, we cannot fully exclude that the
hydrogen layer is very thick (which would make the model effectively a pure
hydrogen model): the pure hydrogen limit is at the 90% confidence upper limit.
Another constraint on the thickness of the hydrogen layer is obtained from the
He II Lyman limit edge. Effectively, the edge is slightly shifted due to
blending with the higher Lyman series lines and occurs near 230 Å. We find
from the EUVE spectrum that the edge is invisible, corresponding to an optical
depth of less than 2%. This corresponds to a lower limit to the hydrogen mass
of
.
While the lower limit is rather strict, we cannot fully exclude that the
hydrogen layer is very thick (which would make the model effectively a pure
hydrogen model): the pure hydrogen limit is at the 90% confidence upper limit.
Another constraint on the thickness of the hydrogen layer is obtained from the
He II Lyman limit edge. Effectively, the edge is slightly shifted due to
blending with the higher Lyman series lines and occurs near 230 Å. We find
from the EUVE spectrum that the edge is invisible, corresponding to an optical
depth of less than 2%. This corresponds to a lower limit to the hydrogen mass
of
![]()
![]() .
.
We conclude that the thickness of the hydrogen layer in HZ 43 is most likely
between 2-
![]()
![]() ,
with lower values excluded but with
no solid upper limit to the hydrogen mass.
,
with lower values excluded but with
no solid upper limit to the hydrogen mass.
Given all this, we consider only stratified models for HZ 43A with hydrogen
mass >
![]()
![]() ;
as argued before, a pure hydrogen atmosphere is
a limiting case of this set of models.
;
as argued before, a pure hydrogen atmosphere is
a limiting case of this set of models.
4 Results
Our best fit model 1 (short cut-off) has a ![]() of
56.17 (52.50), our
best fit model 2 (long cut-off) has
of
56.17 (52.50), our
best fit model 2 (long cut-off) has
![]() .
The numbers in
brackets denote the contribution of the Chandra data only. With 25 data
points and 12 adjustable parameters the number of degrees of freedom would be
13, and hence the value of
.
The numbers in
brackets denote the contribution of the Chandra data only. With 25 data
points and 12 adjustable parameters the number of degrees of freedom would be
13, and hence the value of ![]() is slightly enhanced with respect to purely
statistical noise. However, the actual number of degrees of freedom is higher,
as several parameters are strongly correlated and the best fit is rather
insensitive to others (such as the helium abundance in Sirius B, and in general
the interstellar absorption column densities). Moreover, our additional
constraints also effectively limit the number of degrees of freedom. Although
hard to estimate exactly, the true number of degrees of freedom may be of the
order of 20.
is slightly enhanced with respect to purely
statistical noise. However, the actual number of degrees of freedom is higher,
as several parameters are strongly correlated and the best fit is rather
insensitive to others (such as the helium abundance in Sirius B, and in general
the interstellar absorption column densities). Moreover, our additional
constraints also effectively limit the number of degrees of freedom. Although
hard to estimate exactly, the true number of degrees of freedom may be of the
order of 20.
Figure 1 shows the observed ratio of the LETGS spectra of
Sirius B to HZ 43A, together with the best fit models 1 and 2. From this figure
it is clear that there is some additional systematic scatter in the data points
(as the models in the 50-170 Å wavelength range are, as expected, rather
smooth). For instance, the data point at 160 Å deviates by
![]() or
+3.7%. In this case, some of the systematic effect may be due to the fact
that this wavelength is close to the edge of the spectrum in the -1 spectral
order (the physical edge of the detector). For other data points, the relative
deviations are smaller or less significant. By adding a systematic uncertainty
of only 1 or 2% to our ratios, the
or
+3.7%. In this case, some of the systematic effect may be due to the fact
that this wavelength is close to the edge of the spectrum in the -1 spectral
order (the physical edge of the detector). For other data points, the relative
deviations are smaller or less significant. By adding a systematic uncertainty
of only 1 or 2% to our ratios, the ![]() for the best fit model 2 would
reduce from 49.41 to 29 or 16, respectively, i.e. in the acceptable range given
the
for the best fit model 2 would
reduce from 49.41 to 29 or 16, respectively, i.e. in the acceptable range given
the ![]() 20 degrees of freedom. This reduction by a factor of
20 degrees of freedom. This reduction by a factor of ![]() 2 in
2 in
![]() then suggests that we should use
then suggests that we should use
![]() instead of
instead of
![]() for the original fits without systematic uncertainties, in
order to determine the
for the original fits without systematic uncertainties, in
order to determine the ![]() confidence limits on the parameters.
confidence limits on the parameters.
Table 5: Best-fit parameters of Sirius B and HZ 43A.
We list the best-fit parameters in Table 5, and the spectrum at
a few selected wavelength in Table 6. The absorbed spectrum
of HZ 43 is represented with an accuracy of better than 0.5% over the full
43-180 Å wavelength range by
for model 1 and for model 2 with an accuracy better than 0.7% by
Note that (5)-(6) should not be used outside this range.
5 Discussion
5.1 Parameters of HZ 43
Our lower limit to the hydrogen mass of 2.5 to
![]()
![]() is an
order of magnitude higher than the lower limit derived by Barstow et al. (1995)
based on the EUVE continuum. We could derive this tighter limit because the
LETGS covers also shorter wavelengths, for which the continuum is very sensitive
to the hydrogen thickness (Fig. 2). Our best-fit model is
indistinguishable from a pure hydrogen model, and even for our lower limit
hydrogen mass, above 50 Å the differences with a pure hydrogen model are less
than a few percent.
is an
order of magnitude higher than the lower limit derived by Barstow et al. (1995)
based on the EUVE continuum. We could derive this tighter limit because the
LETGS covers also shorter wavelengths, for which the continuum is very sensitive
to the hydrogen thickness (Fig. 2). Our best-fit model is
indistinguishable from a pure hydrogen model, and even for our lower limit
hydrogen mass, above 50 Å the differences with a pure hydrogen model are less
than a few percent.
One of the most recent alternative measurements of gravity and temperature of
HZ 43A were given by Barstow et al. (2003) based on FUSE observations of the Lyman
series lines. They obtain values of
![]() K and
K and
![]() (m s-2)
(m s-2)
![]() .
These values are not consistent with our
model 1 or model 2 (Fig. 3), but they are closer to model 2. The
uncertainties given by Barstow et al. (2003) correspond to the scatter between the
parameters derived from the individual fits of the only three FUSE spectra that
were available, hence the nominal uncertainty may be quite uncertain by itself.
We also note that the differences between our best fit model and the model by
Barstow et al. (2003) are less than 1% of the continuum level in the Lyman
series line cores, hence rather sensitive to uncertainties in scattered light
contributions or background subtraction.
.
These values are not consistent with our
model 1 or model 2 (Fig. 3), but they are closer to model 2. The
uncertainties given by Barstow et al. (2003) correspond to the scatter between the
parameters derived from the individual fits of the only three FUSE spectra that
were available, hence the nominal uncertainty may be quite uncertain by itself.
We also note that the differences between our best fit model and the model by
Barstow et al. (2003) are less than 1% of the continuum level in the Lyman
series line cores, hence rather sensitive to uncertainties in scattered light
contributions or background subtraction.
Also, for model 1 the allowed range for the gravitational redshift is relatively
high, given that the best value is ![]() to
to ![]() km s-1 (see
Sect. 2.4.1). For the interstellar absorption column densities, our
model fits do not put strong constraints.
km s-1 (see
Sect. 2.4.1). For the interstellar absorption column densities, our
model fits do not put strong constraints.
5.2 Parameters of Sirius B
Until recently, the most accurate parameters of Sirius B were given by
Holberg et al. (1998). These authors used the Lyman alpha line obtained by
IUE together with the EUVE spectrum to constrain the effective temperature and
surface gravity. With only the IUE observations the effective temperature is
known within ![]() K, but by including the EUVE spectrum this uncertainty
reduces to
K, but by including the EUVE spectrum this uncertainty
reduces to ![]() K.
K.
Table 6: Absorbed fluxes (in photons m-2 s-1 Å-1) of Sirius B and HZ 43A at selected wavelengths.
In a recent paper, Barstow et al. (2005) have decreased the formal error bars on
the effective temperature even further down to ![]() K by using
high-accuracy STIS spectra. However, the quoted uncertainty is only the
statistical uncertainty, and Barstow et al. (2005) argue that the systematic
uncertainty on these numbers is hard to assess, mainly because there is little
else to compare with. A major reason of concern is the much larger effective
temperature (25 193 K) found by Barstow et al. (2005) as compared to the value
of 24 790 K obtained by Holberg et al. (1998). While the surface gravity given
in both papers is almost equal and consistent within the error bars, this
temperature difference is >
K by using
high-accuracy STIS spectra. However, the quoted uncertainty is only the
statistical uncertainty, and Barstow et al. (2005) argue that the systematic
uncertainty on these numbers is hard to assess, mainly because there is little
else to compare with. A major reason of concern is the much larger effective
temperature (25 193 K) found by Barstow et al. (2005) as compared to the value
of 24 790 K obtained by Holberg et al. (1998). While the surface gravity given
in both papers is almost equal and consistent within the error bars, this
temperature difference is >![]() and causes the EUV flux at 300 Å to
increase by a factor of 2.4 according to our own model calculations. Although
the absolute accuracy of the EUVE calibration has its limitations (see
Sect. 2.4.3), we believe that a factor of 2.4 cannot be easily
accommodated for. Moreover, Barstow et al. (2005) also show that their best
normalisation of the G430L spectrum obtained with STIS has systematic
uncertainties larger than desirable. Given this problem with the EUV flux, we
prefer here the older Holberg et al. (1998) parameters with the corresponding
error ranges.
and causes the EUV flux at 300 Å to
increase by a factor of 2.4 according to our own model calculations. Although
the absolute accuracy of the EUVE calibration has its limitations (see
Sect. 2.4.3), we believe that a factor of 2.4 cannot be easily
accommodated for. Moreover, Barstow et al. (2005) also show that their best
normalisation of the G430L spectrum obtained with STIS has systematic
uncertainties larger than desirable. Given this problem with the EUV flux, we
prefer here the older Holberg et al. (1998) parameters with the corresponding
error ranges.
For model 1, the temperature is clearly higher (by 570 K) than the value found
by Holberg et al. (1998), while for model 2 it is consistent with the Holberg et
al. value within ![]() (only 180 K higher). For both models,
(only 180 K higher). For both models, ![]() is
consistent with Holberg et al. (1998).
is
consistent with Holberg et al. (1998).
According to Holberg et al. (1998), Sirius B contains a small amount of helium
so pure hydrogen models are ruled out. For homogeneous H/He models, they found
![]() .
Our upper limit to
the amount of helium of <
.
Our upper limit to
the amount of helium of <
![]() is well below that value. However,
the claim of detection of helium is based on the non-significant detection of
possible He II Ly
is well below that value. However,
the claim of detection of helium is based on the non-significant detection of
possible He II Ly![]() and Ly
and Ly![]() lines in the EUVE spectrum,
as well as on the global fit to the EUVE spectrum. If we evaluate our models
for the parameters of Holberg et al. (1998), we find that there should be a deep
and sharp He II edge in the model near 230 Å, with a depth of 13%.
The edge is very broad, and reaches half of its maximum depth at 100 Å.
Clearly, such a deep edge is not observed in the EUVE spectrum, and the
systematic deviations from their best-fit model as shown in their Fig. 4 are
of the same order of magnitude. In fact, for wavelengths below the
He II edge the EUVE data show even a small systematic excess, pointing
to a lower helium abundance than adopted. We conclude that there is no
convincing evidence for a substantial amount of helium in Sirius B.
lines in the EUVE spectrum,
as well as on the global fit to the EUVE spectrum. If we evaluate our models
for the parameters of Holberg et al. (1998), we find that there should be a deep
and sharp He II edge in the model near 230 Å, with a depth of 13%.
The edge is very broad, and reaches half of its maximum depth at 100 Å.
Clearly, such a deep edge is not observed in the EUVE spectrum, and the
systematic deviations from their best-fit model as shown in their Fig. 4 are
of the same order of magnitude. In fact, for wavelengths below the
He II edge the EUVE data show even a small systematic excess, pointing
to a lower helium abundance than adopted. We conclude that there is no
convincing evidence for a substantial amount of helium in Sirius B.
As for HZ 43A, our models for Sirius B do not give additional useful constraints for the interstellar absorption columns.
5.3 The cut-off of the Lyman pseudo-continuum
Based on our fits alone, it is not well possible to distinguish between model 1 (short Lyman pseudo-continuum cut-off) or model 2 (long cut-off), as both models reproduce well the observed spectral ratio between Sirius B and HZ 43A (Fig. 1), albeit with different derived parameters for both stars. When we look to those parameters (see previous subsection), it appears that the derived temperature for Sirius B and the surface gravity of HZ 43A are in reasonable agreement with recent literature values only for model 2 (a long cut-off). Model 2 therefore achieves a better consistency between analyses of the UV/optical and soft X-ray ranges. Moreover, model 2 seems to match the gravitational redshift of HZ 43A better.
The most direct test of the Lyman pseudo-continuum is provided by the far-UV
spectrum of Sirius B. The FUV spectrum was recorded with the far ultraviolet
spectroscopic explorer (FUSE) on 2002 June 14, using medium resolution (MDRS)
and the SiC channel covering the range
![]() 916-1100 Å. Model 2
with the long cut-off clearly provides the best match, though discrepancies up
to 10% between the model and the FUSE spectrum remain. In particular, the
observed spectrum reveals slightly broader high Lyman lines (Ly
916-1100 Å. Model 2
with the long cut-off clearly provides the best match, though discrepancies up
to 10% between the model and the FUSE spectrum remain. In particular, the
observed spectrum reveals slightly broader high Lyman lines (Ly ![]() and
higher lines) than those predicted by model 2. The overall continuum flux level
is however well matched contrary to model 1. A detailed analysis of the FUSE
spectrum will be presented in a separate paper.
and
higher lines) than those predicted by model 2. The overall continuum flux level
is however well matched contrary to model 1. A detailed analysis of the FUSE
spectrum will be presented in a separate paper.
In summary, there seems to be more support for a long cut-off (model 2).
5.4 A comparison with EUVE
We have obtained fluxed, order-subtracted spectra of both stars from the public
EUVE archive![]() . We sampled
these fluxed spectra on a grid with 5 Å spacing using a spline fit, and
estimated the uncertainty on the flux point by looking to the rms variations
with respect to this fit in 5 Å wide bins centred at the grid points (the
fluxed spectra from the public archive do not contain error estimates). In
addition to these statistical uncertainties, we added systematic uncertainties
of about 2, 3.5 and 5 photons m-2 s-1 Å-1 for
. We sampled
these fluxed spectra on a grid with 5 Å spacing using a spline fit, and
estimated the uncertainty on the flux point by looking to the rms variations
with respect to this fit in 5 Å wide bins centred at the grid points (the
fluxed spectra from the public archive do not contain error estimates). In
addition to these statistical uncertainties, we added systematic uncertainties
of about 2, 3.5 and 5 photons m-2 s-1 Å-1 for
![]() Å, 150 Å
Å, 150 Å
![]() Å and
Å and
![]() Å,
respectively. These are based upon a comparison of the spectra with smoothed
spectra on even larger scales of
Å,
respectively. These are based upon a comparison of the spectra with smoothed
spectra on even larger scales of ![]() 50 Å.
50 Å.
The ratio of these fluxed spectra of both stars is shown in
Fig. 4. It is evident from this figure that the models that
we found using the observed Chandra LETGS ratios agree very well with the
observed EUVE data, even beyond the Chandra range for
![]() Å. Again,
these data cannot help to choose between model 1 and 2, although model 2
describes the data in the 170-250 Å range slightly better.
Å. Again,
these data cannot help to choose between model 1 and 2, although model 2
describes the data in the 170-250 Å range slightly better.
In Fig. 5 we compare the fluxed EUVE spectrum of HZ 43A with our models 1 and 2. In the SW band (below 180 Å) the EUVE flux is typically 15% below our model flux, while in the MW band fluctuations up to 10% occur. Note also the relatively large systematic fluctuations in both bands of up to a few % in the SW band to 5% in the LW band.
5.5 Comparison with Beuermann et al. (2006)
We have compared our model calculations with Beuermann et al. (2006) by evaluating our model using exactly the same parameters as obtained by these authors (their Table 2). We show this comparison in Table 7. We have used here the long cut-off of the Lyman pseudo-continuum (see Sect. 2.2.2).
It should be noted that Tables 2 and 3 of Beuermann et al. (2006) contain errors, as explained in an erratum on that paper (in press). This erratum was triggered by our present results. Accordingly, we used their updated temperatures of 24 897 and 51 111 K for Sirius B and HZ 43A, as well as the updated fluxes (Table 1 of the erratum).
Table 7: Comparison of model spectra for the same set of parameters (those of Beuermann et al. 2006). Fluxes are in photons m-2 s-1 Å-1and include interstellar absorption.
For HZ 43A there is an excellent agreement between both codes; only at the
shortest wavelength listed (48 Å), there is a small 4% difference.
However, for Sirius B there are large differences. It is striking that at all
wavelengths our predicted flux is smaller than the flux given by
Beuermann et al. (2006), also because we used exactly the same interstellar
absorption column as well as normalisation
![]() as
these authors. We verified that the (unabsorbed) and integrated spectrum of
our model obeys with high precision the normalisation condition that
as
these authors. We verified that the (unabsorbed) and integrated spectrum of
our model obeys with high precision the normalisation condition that
![]() with
with ![]() the
Stefan-Boltzmann constant and
the
Stefan-Boltzmann constant and ![]() the emitted surface flux. As we both
use the same effective temperature of 24 897 K, the conclusion must be that
the spectrum for Sirius B as calculated by Beuermann et al. (2006) is probably
not correct.
the emitted surface flux. As we both
use the same effective temperature of 24 897 K, the conclusion must be that
the spectrum for Sirius B as calculated by Beuermann et al. (2006) is probably
not correct.
Independently, we compare the ratio of the spectra of both stars as calculated
by Beuermann et al. (2006) to the ratio that we measured with the LETGS. Again,
the measured ratio is smaller by on average a factor of
![]() .
The
reason for this discrepancy is not clear, but we note that our ratio for the
LETGS spectra is consistent with the ratio obtained from the EUVE spectra.
.
The
reason for this discrepancy is not clear, but we note that our ratio for the
LETGS spectra is consistent with the ratio obtained from the EUVE spectra.
Remarkably, our own normalisation constant for Sirius B for the same value of
g and
![]() is 7.3% higher than the value given by
Beuermann et al. (2006), the main difference being that we use a value of Rbased on the measured gravitational redshift instead of the spectral modelling
derived effective gravity. If we would have used our own normalisation in
Table 7, the discrepancy would have been smaller.
is 7.3% higher than the value given by
Beuermann et al. (2006), the main difference being that we use a value of Rbased on the measured gravitational redshift instead of the spectral modelling
derived effective gravity. If we would have used our own normalisation in
Table 7, the discrepancy would have been smaller.
5.6 Effective area comparison
![\begin{figure}
\par\includegraphics[angle=-90,width=9cm,clip]{09868f6.ps}
\end{figure}](/articles/aa/full_html/2009/13/aa09868-08/img142.gif) |
Figure 6: Fluxes of HZ 43A with respect to the model flux of our model 2 (long cut-off). Solid line: model 1; circles: results of a spline fit to the LETGS spectrum using the old SRON effective area calibration based on work in 2000; dashed histogram: EUVE flux; squares: Beuermann et al. (2006); dash-dotted line, triangles: results of a spline fit to the LETGS spectrum using the standard CXC CIAO pipeline. |
| Open with DEXTER | |
As the effective area of the LETGS depends on details such as pha (pulseheight) selection, the spectral order, or the width of the spectral extraction box, it is not very usefull to give the effective area here. Instead, we compare here directly model spectra. This comparison is shown in Fig. 6.
A comparison between model 1 and 2 shows that in particular at the shorter wavelengths the differences are large: at 40 Å, model 1 predicts 38% more flux than model 1. This difference is solely due to the adopted value of the Lyman pseudo-continuum cut-off that affects the model calculations for Sirius B. As we fit both stars together, however, the different spectrum for Sirius B implies then a different solution for HZ 43A, as the ratio of both spectra is constrained by the observed ratio with Chandra. The difference between both models then must be found through a comparison with other data, for instance temperatures and effective gravities determined from detailed line fitting.
The differences between the present model 2 and our older (2000) effective
area based on work by Heise and Kaastra are less than 20% for
![]() Å, and differ by 10% below 80 Å. Compared to
Model 1, there is a constant offset of about 20% for
Å, and differ by 10% below 80 Å. Compared to
Model 1, there is a constant offset of about 20% for
![]() Å;
for the shorter wavelengths, the effective area in the 2000 version was not
based upon HZ 43 but on matching blazar spectra from shorter wavelengths, so it
is not surprising that the differences are larger for shorter wavelengths.
Å;
for the shorter wavelengths, the effective area in the 2000 version was not
based upon HZ 43 but on matching blazar spectra from shorter wavelengths, so it
is not surprising that the differences are larger for shorter wavelengths.
The model flux given by Beuermann et al. (2006) is on average 3% lower than the flux that we derive for model 2, although the shape agrees within 1%.
We also compare our model to the model flux derived directly from the observed LETGS spectrum of HZ 43A as processed and modelled using the official CXC software (instead of our local SRON software). We used CIAO version 4.0 with CALDB version 3.4.2. The spectrum was fitted using a spline, similar to what we described in Sect. 2.1, and we show in Fig. 6 the ratio of this fluxed spectrum to our model 2 with the dash-dotted line. Above 90 Å, there is good agreement in shape with model 1 (apart from a 10% flux difference), but for shorter wavelengths there is a strong dip: between 70-90 Å, there is a relative change of almost 25% between our models and the CXC-based model. The large scale (tens of Å) fluctuations with an amplitude of a few percent as compared for instance to our old (2000) calibration and also to Beuermann et al. (2006) are not very surprising, as we fudged effectively the effective area to get the observed spectrum agree by definition to the predicted model.
Finally, the dotted line shows the comparison of the EUVE fluxed spectrum
discussed earlier to our model 2. Over the wavelength band of the LETGS, the
difference with model 2 is ![]() 15%.
15%.
5.7 Uncertainty of the model flux
![\begin{figure}
\par\includegraphics[angle=-90,width=9cm,clip]{09868f7.ps}
\end{figure}](/articles/aa/full_html/2009/13/aa09868-08/img145.gif) |
Figure 7:
Relative uncertainty on our model spectra for Sirius B (dashed lines)
and HZ 43A (solid lines). All acceptable solutions with
|
| Open with DEXTER | |
Table 8: Summary of systematic and statistical uncertainties in the Sirius B and HZ 43A spectra.
The statistical uncertainty of our model spectrum for both stars is shown in Fig. 7. Although not as good as the flux limits in the optical band (1% accuracy), we still can reach an accuracy of better than 5% on the absolute flux of both stars. As we will show in another paper (Kaastra et al. 2009b), we can even reduce this uncertainty to 3-4% by using additional constraints at high energies. Here we will carefully asses the possible size of systematic uncertainties in our model spectra.
We follow the same approach as Kaastra et al. (2009a). We estimate the known systematic uncertainties and present them in Table 8. For each relevant factor, we estimate its magnitude for a range of characteristic wavelengths, covering the LETGS range between 50-170 Å. These numbers are given in the table. Then we put each error in one of two specific categories.
For category ``c'', the systematic uncertainties at different wavelengths are more
or less correlated. Example: an error in the interstellar absorption column
density will lead to correlated deviations. As a rough approximation, such
deviations can be approximated by a power law in wavelength. We can assess for
these ``correlated'' errors how they will affect the normalisation and slope of
this power law written in the form
![]() by
``fitting'' the estimated systematic uncertainties (all having the same sign)
directly to such a power law shape.
by
``fitting'' the estimated systematic uncertainties (all having the same sign)
directly to such a power law shape.
For category ``u'', the systematic uncertainties at different wavelengths are
uncorrelated over the full LETGS wavelength scale. A good example are the
statistical errors on the Sirius B to HZ 43A ratio. In those cases, we
estimated ![]() from the typical slope and normalisation that we would
obtain if the systematic uncertainties at different wavelengths had random
signs. In general, for this type of uncertainty the direct effect on A and
from the typical slope and normalisation that we would
obtain if the systematic uncertainties at different wavelengths had random
signs. In general, for this type of uncertainty the direct effect on A and
![]() is smaller than for correlated errors (category ``c'').
is smaller than for correlated errors (category ``c'').
More details on the individual systematic uncertainties are given in Appendix A. In summary, the most important factor is the uncertainty in the spectral modelling. This can give a flux difference at 100 Å of 1% and a difference in slope of 0.022. However, these values are well within the uncertainty range that we found for the spectrum of HZ 43 (Fig. 7).
6 Conclusions
We have modelled carefully the X-ray spectra of Sirius B and HZ 43A using the most sophisticated spectral models presently available. By using the observed spectral ratio of both stars with LETGS as constraints, together with some other constraints, we have obtained models for each star that predict the flux in the 50-170 Å band to better than 5%. This allows also to calibrate the relative and absolute effective area of the LETGS in the same wavelength band with the same accuracy.
The model spectrum for Sirius B appears to depend significantly upon the assumption made about the cut-off of the Lyman pseudo-continuum. This affects our solutions in two ways. First, the best fit parameters for both stars depend upon this choice, and secondly the absolute flux of both stars at the shorter wavelengths depends strongly upon it. Accordingly, we have investigated here two classes of models for Sirius B: model 1 with a short cut-off of the Lyman pseudo-continuum, model 2 with a long cut-off. From our X-ray data alone we cannot distinguish between both models. However, it appears that only for model 2 (a long cut-off) the derived temperature and far UV flux of Sirius B, and the temperature, surface gravity and gravitational redshift of HZ 43A agree much better with recent analyses of the UV and optical spectra.
For both stars, we can put tight upper limits to the amount of helium or a tight lower limit to the thickness of a hydrogen layer. In fact, both stars show to agree remarkably well with a pure hydrogen atmosphere. The values that we derive for the surface gravity and temperature of both stars have an accuracy comparable to what has been achieved by detailed line profile fitting, apart from the larger differences between model 1 and model 2.
Acknowledgements
We thank Jay Holberg for helpfull comments on this paper, Vadim Burwitz for discussions about the Chandra data analysis, and Thomas Rauch for discussions on the difference between the TMAP and Tlusty calculations. This research has made use of data obtained from the Chandra Data Archive and software provided by the Chandra X-ray Center (CXC) in the application package CIAO. SRON is supported financially by NWO, the Netherlands Organization for Scientific Research.
Appendix A: Breakdown of systematic uncertainties
A.1 Interstellar absorption
We have used the interstellar absorption cross sections of Rumph et al. (1994). Replacing the atomic cross sections with those of Verner & Yakovlev (1995) gives small differences, as listed in Col. (a) of Table 8.
Also, we use slightly different ionisation fractions of hydrogen and helium as compared to Beuermann et al. (2006). Replacing our ionisation fractions by those of Beuermann et al. (2006) yields the differences in Col. (b).
Further, in the absorption model of Rumph et al. (1994) all elements other than hydrogen and helium are ignored. We estimate this effect by comparing the transmission with and without metals using the hot absorption model of SPEX with the appropriate parameters. The differences are very small and shown in Col. (c).
A.2 Atmosphere models
The effects of ignoring Compton scattering has been estimated from the study of Suleimanov et al. (2006) and are listed in Col. (d).
Using the adopted model atmosphere for HZ 43A, we estimated the internal accuracy of model atmosphere calculations by allowing for different treatment of the hydrogen opacity (line broadening, extension of Lyman pseudo-continuum) and using different discretisation in frequency and depth. The cumulative systematic uncertainties are listed in Col. (e). These estimates are similar to the differences found in calculating a model with Tlusty and TMAP using the same parameters (see for instance Table 7, the column for HZ 43A).
In our fitting procedure, we calculate atmosphere models by interpolating models on a three-dimensional grid (temperature, gravity and helium abundance or hydrogen column mass). We estimate the uncertainties corresponding to this interpolation by comparing a few interpolated models with exact calculations. We list these in Col. (f).
A.3 Spectral extraction
The background towards both stars was determined from boxes below and above the spectral extraction region. The background of the HRC-S detector is not completely flat. For typical HRC-S extraction regions, the background below and above the spectrum may differ by 2-3%. As a conservative estimate we therefore can assume that the average background uncertainty in the source extraction region is less than 1%. As Sirius B is the faintest of both stars, this uncertainty is the strongest for that source. We list the corresponding uncertainty in Col. (g).
HZ 43A is a very strong source. Inspection and modelling of the empirical distribution of photons in the cross-dispersion direction shows that at the longest wavelengths the background can be enhanced by 10-15% due to scattered photons of HZ 43A. We have not taken this into account in our background subtraction, but the effect can be easily estimated, see Col. (h).
The higher spectral order contribution to the HZ 43A spectrum is small, less than 3% for all wavelengths. Adopting conservatively a maximum uncertainty of 30% on the estimated higher order calibration relative to the first order, we determined the maximum uncertainty due to higher order subtraction as listed in Col. (i).
Our observation of Sirius B was taken slightly off-axis with respect to HZ 43A
by about 1![]() .
According to the Proposer's Observatory Guide of Chandra,
the main effect of this off-axis angle is due to vignetting of the Chandra
mirror. At the low energies that are relevant for white dwarfs and this
off-axis angle, the vignetting effect is less than 0.5% and constant as a
function of wavelength, see Col. (j).
.
According to the Proposer's Observatory Guide of Chandra,
the main effect of this off-axis angle is due to vignetting of the Chandra
mirror. At the low energies that are relevant for white dwarfs and this
off-axis angle, the vignetting effect is less than 0.5% and constant as a
function of wavelength, see Col. (j).
Finally, we list the statistical errors on the observed ratio of both stars in Col. (k).
References
- Barstow, M. A., Holberg, J. B., & Koester, D. 1995, MNRAS, 274, L31 [NASA ADS] (In the text)
- Barstow, M. A., Dobbie, P. D., Holberg, J. B., Hubeny, I., & Lanz, T. 1997, MNRAS, 286, 58 [NASA ADS] (In the text)
- Barstow, M. A., Good, S. A., Burleigh, M. R., et al. 2003, MNRAS, 344, 562 [NASA ADS] [CrossRef] (In the text)
- Barstow, M. A., Bond, H. E., Holberg, J. B., et al. 2005, MNRAS, 362, 1134 [NASA ADS] [CrossRef] (In the text)
- Beuermann, K., Burwitz, V., & Rauch, T. 2006, A&A, 458, 541 [NASA ADS] [CrossRef] [EDP Sciences] (In the text)
- Bohlin, R. C. 2000, AJ, 120, 437 [NASA ADS] [CrossRef] (In the text)
- Bohlin, R. C., & Hartig, G. 1998, STIS Instrument Science reports, www.stsci.edu/hst/stis/documents/isrs, ISR 98-20 (In the text)
- Bohlin, R. C., Harris, A. W., Holm, A. V., & Gry, C. 1990, ApJS, 73, 413 [NASA ADS] [CrossRef] (In the text)
- Craig, N., Abbott, M., Finley, D., et al. 1997, ApJS, 113, 131 [NASA ADS] [CrossRef]
- Däppen, W., Anderson, L., & Mihalas, D. 1987, ApJ, 319, 195 [NASA ADS] [CrossRef]
- Dupuis, J., Vennes, S., Bowyer, S., Pradhan, A. K., & Thejll, P. 1995, ApJ, 455, 574 [NASA ADS] [CrossRef]
- Gatewood, G. D., & Gatewood, C. V. 1978, ApJ, 225, 191 [NASA ADS] [CrossRef] (In the text)
- Greenstein, J. L., Oke, J. B., & Shipman, H. L. 1971, ApJ, 169, 563 [NASA ADS] [CrossRef] (In the text)
- Hébrard, G., Mallouris, C., Ferlet, R., et al. 1999, A&A, 350, 643 [NASA ADS] (In the text)
- Holberg, J. B., & Bergeron, P. 2006, AJ, 132, 1221 [NASA ADS] [CrossRef] (In the text)
- Holberg, J. B., Barstow, M. A., Bruhweiler, F. C., Cruise, A. M., & Penny, A. J. 1998, ApJ, 497, 935 [NASA ADS] [CrossRef] (In the text)
- Hubeny, I. 1988, Comput. Phys. Commu., 52, 103 [NASA ADS] [CrossRef]
- Hubeny, I., Hummer, D. G., & Lanz, T. 1994, A&A, 282, 151 [NASA ADS] (In the text)
- Hubeny, I., & Lanz, T. 1995, ApJ, 439, 875 [NASA ADS] [CrossRef]
- Hummer, D. G., & Mihalas, D. 1988, ApJ, 331, 794 [NASA ADS] [CrossRef] (In the text)
- Kaastra, J. S. 2000, unpublished internal report, SRON (In the text)
- Kaastra, J. S., Steenbrugge, K. C., Raassen, A. J. J., et al. 2002, A&A, 386, 427 [NASA ADS] [CrossRef] [EDP Sciences] (In the text)
- Kaastra, J. S., de Vries, C. P., Costantini, E., & den Herder, J. W. A. 2009a, A&A, 497, 291 [NASA ADS] [CrossRef] [EDP Sciences] (Paper I) (In the text)
- Kaastra, J. S., de Vries, C. P., den Herder, J. W. A., et al. 2009b, A&A, in preparation (Paper III) (In the text)
- Kowalski, P. M. 2006, ApJ, 651, 1120 [NASA ADS] [CrossRef] (In the text)
- Kowalski, P. M., & Saumon, D. 2006, ApJ, 651, L137 [NASA ADS] [CrossRef] (In the text)
- Kruk, J. W., Howk, J. C., André, M., et al. 2002, ApJS, 140, 19 [NASA ADS] [CrossRef] (In the text)
- Lanz, T., & Hubeny, I. 2003, ApJS, 146, 417 [NASA ADS] [CrossRef] (In the text)
- Mack, J. R., Sherbert, L. E., & Soderblom, D. R. 1997, GHRS Instrument Science Report No. 88, available at http://www.stsci.edu/ftp/instrument_news/GHRS/Ghrs_isr088.ps (In the text)
- Madej, J. 1998, A&A, 340, 617 [NASA ADS] (In the text)
- Pease, D. O., Drake, J. J., Johnson, C. O., et al. 2000, Proc. SPIE, 4012, 700 [NASA ADS] (In the text)
- Pease, D. O., Drake, J. J., Kashyap, V. L., et al. 2003, Proc. SPIE, 4851, 157 [NASA ADS] (In the text)
- Reid, I. N. 1996, AJ, 111, 2000 [NASA ADS] [CrossRef] (In the text)
- Rumph, T., Bowyer, S., & Vennes, S. 1994, AJ, 107, 2108 [NASA ADS] [CrossRef] (In the text)
- Shipman, H. L. 1976, ApJ, 206, L67 [NASA ADS] [CrossRef] (In the text)
- Sing, D., Holberg, J. B., & Dupuis, J. 2002, in Continuing the Challenge of EUV Astronomy: Current Analysis and Prospects for the Future, ed. S. B. Howell, J. Dupuis, D. Golombek, F. M. Walter, & J. Cullison, ASP Conf. Ser., 264, 57 (In the text)
- Slavin, J. D., & Frisch, P. C. 2007, Space Sci. Rev., 130, 409 [NASA ADS] [CrossRef] (In the text)
- Suleimanov, V., Madej, J., Drake, J. J., Rauch, T., & Werner, K. 2006, A&A, 455, 679 [NASA ADS] [CrossRef] [EDP Sciences] (In the text)
- van Altena, W. F., Lee, J. T., & Hoffleit, E. D. 1995, The general catalogue of trigonometric stellar paralaxes, 4t [NASA ADS]h edn., Yale Univ. Observatory, New Haven, CT (In the text)
- van den Bos, W. H. 1960, Journal des Observateurs, 43, 145 [NASA ADS] (In the text)
- Verner, D. A., & Yakovlev, D. G. 1995, A&AS, 109, 125 [NASA ADS] (In the text)
- Werner, K., Deetjen, J. L., Dreizler, S., et al. 2003, in Stellar Atmosphere Modeling, ed. I. Hubeny, D. Mihalas, & K. Werner, ASP Conf. Ser., 288, 31 (In the text)
- Wolff, B., Koester, D., & Lallement, R. 1999, A&A, 346, 969 [NASA ADS] (In the text)
Footnotes
- ...
handbook
![[*]](/icons/foot_motif.gif)
- Available at http://archive.stsci.edu/euve/handbook/handbook.html
- ... archive
- http://archive.stsci.edu/euve/search.php
All Tables
Table 1: Summary of LETGS observations used in this paper.
Table 2: Measured monochromatic fluxes of Sirius B.
Table 3: Adopted absorption parameters for Sirius B and HZ 43A. Numbers in brackets are derived from the basic numbers given in the other entries of this table.
Table 4: Lyman series of He II in HZ 43.
Table 5: Best-fit parameters of Sirius B and HZ 43A.
Table 6: Absorbed fluxes (in photons m-2 s-1 Å-1) of Sirius B and HZ 43A at selected wavelengths.
Table 7: Comparison of model spectra for the same set of parameters (those of Beuermann et al. 2006). Fluxes are in photons m-2 s-1 Å-1and include interstellar absorption.
Table 8: Summary of systematic and statistical uncertainties in the Sirius B and HZ 43A spectra.
All Figures
| |
Figure 1: Ratio of the spectrum of Sirius B to the spectrum of HZ 43A. data points with error bars: ratio as observed by the LETGS. The solid line shows our best-fit model 2 (with a long wavelength cut-off of the Lyman pseudo-continuum), and the dotted line our best-fit model 1 (short cut-off), as discussed in Sect. 4. The lower panel shows the fit residuals of the observed ratio with respect to model 2; the dotted line in that panel shows on the same scale the differences between model 2 and model 1. Note that the first data point at 50 Å is off-scale in this lower panel. |
| Open with DEXTER | |
| In the text | |
| |
Figure 2:
Spectrum of HZ 43 for stratified models with hydrogen layers
(in |
| Open with DEXTER | |
| In the text | |
| |
Figure 3:
Contours of
|
| Open with DEXTER | |
| In the text | |
| |
Figure 4: Ratio of the spectrum of Sirius B to the spectrum of HZ 43A. Data points with error bars: ratio as observed with EUVE. The solid line shows our best-fit model 2 (with a long wavelength cut-off of the Lyman pseudo-continuum, and the dotted line our best-fit model 1 (short cut-off), as discussed in Sect. 4. Note that these fits are based solely upon the Chandra LETGS data, not upon the EUVE data. The lower panel shows the residuals of the observed ratio with respect to model 2; the dotted line in that panel shows on the same scale the differences between model 2 and model 1. Note that the first two data points below 80 Å are off-scale in this lower panel. |
| Open with DEXTER | |
| In the text | |
| |
Figure 5: Fluxed EUVE spectrum of HZ 43A. Data points: observed spectrum with EUVE. The solid line shows our best-fit model 2 (with a long wavelength cut-off of the Lyman pseudo-continuum), and the dotted line our best-fit model 1 (short cut-off), as discussed in Sect. 4. The lower panel shows the ratio of the observed spectrum with respect to model 2; the dotted line in that panel shows on the same scale the differences between model 2 and model 1. |
| Open with DEXTER | |
| In the text | |
| |
Figure 6: Fluxes of HZ 43A with respect to the model flux of our model 2 (long cut-off). Solid line: model 1; circles: results of a spline fit to the LETGS spectrum using the old SRON effective area calibration based on work in 2000; dashed histogram: EUVE flux; squares: Beuermann et al. (2006); dash-dotted line, triangles: results of a spline fit to the LETGS spectrum using the standard CXC CIAO pipeline. |
| Open with DEXTER | |
| In the text | |
| |
Figure 7:
Relative uncertainty on our model spectra for Sirius B (dashed lines)
and HZ 43A (solid lines). All acceptable solutions with
|
| Open with DEXTER | |
| In the text | |
Copyright ESO 2009
Current usage metrics show cumulative count of Article Views (full-text article views including HTML views, PDF and ePub downloads, according to the available data) and Abstracts Views on Vision4Press platform.
Data correspond to usage on the plateform after 2015. The current usage metrics is available 48-96 hours after online publication and is updated daily on week days.
Initial download of the metrics may take a while.