| Issue |
A&A
Volume 496, Number 2, March III 2009
|
|
|---|---|---|
| Page(s) | 557 - 576 | |
| Section | Astronomical instrumentation | |
| DOI | https://doi.org/10.1051/0004-6361:200810897 | |
| Published online | 14 January 2009 | |
Analysis of extremely low signal-to-noise ratio data from INTEGRAL/PICsIT
P. Lubinski1,2
1 - Centrum Astronomiczne im. M. Kopernika,
Bartycka 18, 00-716 Warszawa, Poland
2 -
ISDC Data Centre for Astrophysics, Chemin d'Ecogia 16,
1290 Versoix, Switzerland
Received 2 September 2008 / Accepted 18 November 2008
Abstract
Context. The PICsIT detector onboard the INTEGRAL satellite was designed to provide information about emission in the soft ![]() -ray band for many bright sources. Due to strong and variable instrumental background, only 4 objects have been detected so far using standard software.
-ray band for many bright sources. Due to strong and variable instrumental background, only 4 objects have been detected so far using standard software.
Aims. The moderate sensitivity of PICsIT can be compensated for in the case of many objects by adopting a long exposure time, thanks to INTEGRAL's large field of view and an observing strategy focused on the Galactic plane. With angular resolution far higher than that of all other instruments operating in a similar energy band, PICsIT is suitable for fields too crowded or too significantly affected by Galactic diffuse emission. Therefore, it is desirable to improve the spectral extraction software to both obtain more reliable results and enlarge the number of objects that can be studied.
Methods. The new PICsIT spectral extraction method is based on three elements: careful modelling of the background, an energy-dependent pixel-illumination function, and the computation of the probability density of the source count rate. Background maps of the detector plane are prepared for short periods and relatively narrow energy bands to insure that the background dependence on time and energy is modelled well. The most important element of the new spectral extraction method is the proper treatment of the Poisson-distributed data, developed within a Bayesian framework.
Results. The new method was tested extensively on both a large true data set and simulated data. Results assumed in simulations were reproduced perfectly, without any bias and with high precision. Count rates measured for Crab were far more stable than those obtained with the standard software. For weaker sources, the new method produced spectra of far higher quality and allows us to detect at least 8 additional objects. Comparison with other INTEGRAL instruments demonstrated that PICsIT is well calibrated and provides valuable information about the continuum emission in the 250 keV - 1 MeV band, detectable currently only by INTEGRAL.
Key words: gamma rays: observations - instrumentation: detectors - methods: data analysis - methods: statistical
1 Introduction
The low-energy ![]() -ray band (100 keV-10 MeV) is extremely difficult to
observe, mainly because of the intense nuclear-decay emission induced by cosmic
rays inside the detector and surrounding materials. As the flux of the observed
objects decline significantly with increasing energy from X-rays to
-ray band (100 keV-10 MeV) is extremely difficult to
observe, mainly because of the intense nuclear-decay emission induced by cosmic
rays inside the detector and surrounding materials. As the flux of the observed
objects decline significantly with increasing energy from X-rays to
![]() -rays, the strong increase in internal background of the detector
makes the ratio of observed signal to background very small. This ratio
usually does not exceed 0.01 even for sources as bright as the
Crab nebula, despite the passive and active shielding applied. Moreover, the
fact that soft
-rays, the strong increase in internal background of the detector
makes the ratio of observed signal to background very small. This ratio
usually does not exceed 0.01 even for sources as bright as the
Crab nebula, despite the passive and active shielding applied. Moreover, the
fact that soft ![]() -rays cannot be focused as well as soft X-rays reduces
the angular resolution in this energy range. Therefore, observations of crowded
Galactic fields with
-rays cannot be focused as well as soft X-rays reduces
the angular resolution in this energy range. Therefore, observations of crowded
Galactic fields with ![]() -ray telescopes are often affected by contamination
from nearby sources or from Galactic diffuse emission.
-ray telescopes are often affected by contamination
from nearby sources or from Galactic diffuse emission.
There have been many ![]() -ray observatories, but due to their generally
limited life times and sensitivities only a few have provided a significant
amount of data. More detailed studies of the soft
-ray observatories, but due to their generally
limited life times and sensitivities only a few have provided a significant
amount of data. More detailed studies of the soft ![]() -ray spectra became
possible in the last decade of the 20th century, thanks to the SIGMA detector
(Paul et al. 1991) onboard the GRANAT satellite, and the OSSE and BATSE detectors
(Johnson et al. 1993) onboard the CGRO satellite. SIGMA was a coded-mask instrument
with a good angular resolution of 13
-ray spectra became
possible in the last decade of the 20th century, thanks to the SIGMA detector
(Paul et al. 1991) onboard the GRANAT satellite, and the OSSE and BATSE detectors
(Johnson et al. 1993) onboard the CGRO satellite. SIGMA was a coded-mask instrument
with a good angular resolution of 13
![]() ,
and its nominal energy range was
35-1300 keV. The OSSE telescope has been the most sensitive soft
,
and its nominal energy range was
35-1300 keV. The OSSE telescope has been the most sensitive soft ![]() -ray
instrument sent into orbit until now, due to its large size. The high sensitivity
of OSSE was in practice slightly reduced by limitations related to its low orbit.
In addition, the large field of view of OSSE made it difficult to resolve
closeby objects at the Galactic centre and to distinguish point-source emission
from Galactic diffuse emission. BATSE was an all-sky monitor, used mainly for
detecting GRBs and monitoring the activity of brighter
-ray
instrument sent into orbit until now, due to its large size. The high sensitivity
of OSSE was in practice slightly reduced by limitations related to its low orbit.
In addition, the large field of view of OSSE made it difficult to resolve
closeby objects at the Galactic centre and to distinguish point-source emission
from Galactic diffuse emission. BATSE was an all-sky monitor, used mainly for
detecting GRBs and monitoring the activity of brighter ![]() -ray sources. The
nominal energy range of the PDS detector (Frontera et al. 1997) onboard the BeppoSAX
satellite was 15-300 keV but its sensitivity above 150 keV was insufficient to
provide more precise data.
-ray sources. The
nominal energy range of the PDS detector (Frontera et al. 1997) onboard the BeppoSAX
satellite was 15-300 keV but its sensitivity above 150 keV was insufficient to
provide more precise data.
There are four missions presently in operation with soft ![]() -ray
instruments, namely RXTE (HEXTE), INTEGRAL, Swift (BAT), and Suzaku (HXD/GSO).
The HEXTE (Rothschild et al. 1998) and BAT (Gehrels et al. 2004) energy ranges do not
exceed
-ray
instruments, namely RXTE (HEXTE), INTEGRAL, Swift (BAT), and Suzaku (HXD/GSO).
The HEXTE (Rothschild et al. 1998) and BAT (Gehrels et al. 2004) energy ranges do not
exceed ![]() 150 keV, and these instruments have therefore limited
capabilities of studying the high energy emission. GSO onboard Suzaku was
declared to be the detector with the lowest internal background in the 40-600 keV band, due to a more advanced active-shielding technique (Takahashi et al. 2007).
This low background should correspond to high sensitivity, but 3 years after
Suzaku's launch almost no results above 200 keV have been published, apart from
Cyg X-1 observed up to 400 keV (Makishima et al. 2008). Therefore, taking into
account the limited angular resolution of GSO above 100 keV (
150 keV, and these instruments have therefore limited
capabilities of studying the high energy emission. GSO onboard Suzaku was
declared to be the detector with the lowest internal background in the 40-600 keV band, due to a more advanced active-shielding technique (Takahashi et al. 2007).
This low background should correspond to high sensitivity, but 3 years after
Suzaku's launch almost no results above 200 keV have been published, apart from
Cyg X-1 observed up to 400 keV (Makishima et al. 2008). Therefore, taking into
account the limited angular resolution of GSO above 100 keV (![]() 4.5
4.5
![]() ), current interest in the soft
), current interest in the soft ![]() -ray research is focused on
the data acquired by INTEGRAL detectors.
-ray research is focused on
the data acquired by INTEGRAL detectors.
The INTEGRAL satellite (Winkler et al. 2003) has onboard three coded-mask
![]() -ray detectors. ISGRI (Lebrun et al. 2003) is the upper detector of
INTEGRAL's imager IBIS (Ubertini et al. 2003), which operates nominally in the
13-1000 keV range. Owing to its relatively high sensitivity and angular
resolution of 12
-ray detectors. ISGRI (Lebrun et al. 2003) is the upper detector of
INTEGRAL's imager IBIS (Ubertini et al. 2003), which operates nominally in the
13-1000 keV range. Owing to its relatively high sensitivity and angular
resolution of 12
![]() ,
ISGRI remains the INTEGRAL instrument of choice for
studies of point sources, particularly Galactic ones. The lower layer of the IBIS
imager, the PICsIT detector (Labanti et al. 2003), is described in the next section.
The spectrometer SPI (Vedrenne et al. 2003) is a high spectral resolution
,
ISGRI remains the INTEGRAL instrument of choice for
studies of point sources, particularly Galactic ones. The lower layer of the IBIS
imager, the PICsIT detector (Labanti et al. 2003), is described in the next section.
The spectrometer SPI (Vedrenne et al. 2003) is a high spectral resolution
![]() -ray telescope operating in the energy range 20 keV-8 MeV. Despite its
lower sensitivity and limited angular resolution (
-ray telescope operating in the energy range 20 keV-8 MeV. Despite its
lower sensitivity and limited angular resolution (![]() 2.5
2.5
![]() ), SPI
spectra extracted for brighter sources complement the ISGRI spectra well,
especially above 150 keV where the ISGRI sensitivity declines rapidly. Due to its
reliable, ground-based efficiency calibration, SPI serves also as a reference
instrument for the INTEGRAL cross-calibration tests. Observations of crowded
fields, however, are difficult, as for OSSE, and special care is required in
analysing such data (Roques & Jourdain 2005).
), SPI
spectra extracted for brighter sources complement the ISGRI spectra well,
especially above 150 keV where the ISGRI sensitivity declines rapidly. Due to its
reliable, ground-based efficiency calibration, SPI serves also as a reference
instrument for the INTEGRAL cross-calibration tests. Observations of crowded
fields, however, are difficult, as for OSSE, and special care is required in
analysing such data (Roques & Jourdain 2005).
Notwithstanding their unique capabilities, SPI and ISGRI provide rather limited
information about the continuum emission from point sources above ![]() 200 keV. In the case of SPI, besides its limited angular resolution, there are some
difficulties in modelling the instrumental background at higher energy, where
the number of photons is low. However, by applying a more sophisticated analysis
to SPI data, it was possible to detect 20 objects above 200 keV
(Bouchet et al. 2008). The sensitivity of ISGRI declines dramatically above 150 keV,
and the efficiency calibration remains uncertain in that range
(Jourdain et al. 2008).
200 keV. In the case of SPI, besides its limited angular resolution, there are some
difficulties in modelling the instrumental background at higher energy, where
the number of photons is low. However, by applying a more sophisticated analysis
to SPI data, it was possible to detect 20 objects above 200 keV
(Bouchet et al. 2008). The sensitivity of ISGRI declines dramatically above 150 keV,
and the efficiency calibration remains uncertain in that range
(Jourdain et al. 2008).
Initially, the INTEGRAL imager sensitivity was planned to exceed that of OSSE by
about an order of magnitude (Winkler 1994). Unfortunately, due to a reduction
in mission funds, this plan became impossible, when the foreseen three layers of
the high energy detector were reduced to two layers of smaller volume and
a limited telemetry was ascribed to them. The effect is that the PICsIT detector,
being still the largest soft ![]() -ray detector on orbit, has the thickness of
only 3 cm compared to almost 18 cm of OSSE. The sensitivity of PICsIT is reduced
further because the pixellated structure and data-acquisition logic produce an
additional loss in the fraction of the Compton-scattered photons. On the other
hand, due to the elongated orbit, both the Earth occultations and passages
through the radiation belts affect only a small part of the INTEGRAL revolution
period. This and the observing strategy focused on the Galactic centre and
Galactic plane ensures that many objects are observed by PICsIT with a long
exposure time, compensating to some extent the moderate sensitivity of the
instrument.
-ray detector on orbit, has the thickness of
only 3 cm compared to almost 18 cm of OSSE. The sensitivity of PICsIT is reduced
further because the pixellated structure and data-acquisition logic produce an
additional loss in the fraction of the Compton-scattered photons. On the other
hand, due to the elongated orbit, both the Earth occultations and passages
through the radiation belts affect only a small part of the INTEGRAL revolution
period. This and the observing strategy focused on the Galactic centre and
Galactic plane ensures that many objects are observed by PICsIT with a long
exposure time, compensating to some extent the moderate sensitivity of the
instrument.
Shortly after launch, it appeared that the PICsIT background level was about two times lower than the pre-launch conservative estimate (Di Cocco et al. 2003). Only the energy band below 300 keV showed a higher background, with an excess originating in track events induced by high-energy cosmic rays (Segreto et al. 2003). Despite the lower background, the sensitivity achieved after the first year of detector operation was low, a factor between 5 and 10 lower than the statistical limit. The situation was improved considerably when the long-exposure background maps were included in the OSA 4.0 software release (Foschini 2004), allowing a sensitivity comparable to that of SPI to be achieved.
Nonetheless, almost six years after the INTEGRAL launch, there remain only three objects for which results with PICsIT have been reported: Crab (Di Cocco et al. 2003), Cyg X-1 (Cadolle Bel et al. 2006), and XTE J1550-564 during its 2003 outburst (Foschini 2005). The PICsIT spectra presented did not provide significantly more information than the SPI spectra. More spectacular PICsIT results were instead obtained for the observations of gamma-ray bursts (GRBs) (Malaguti et al. 2003a), in particular those appearing outside the INTEGRAL field of view (Marcinkowski et al. 2006), because these events are detectable at high energy with the use of IBIS Compton-mode data.
Since the possibilities of improving the spectral extraction performance for
PICsIT using the standard OSA software were limited, a completely novel approach
was developed for testing purposes. Preliminary results demonstrated that this
new approach produced very good results, by for example allowing us
to detect several objects not detected by the standard procedure. This paper
presents all the elements of the new method, which is now fully developed. Since
we decided after discussions with the IBIS Team that the new method should not
be implemented in the standard software for INTEGRAL data analysis, we provided
a detailed presentation here to allow a potential user to reproduce the results.
In Sects. 2-4, basic ingredients of the spectral
extraction technique are described. Section 5 presents the results of
testing the PICsIT detection limits. In Sect. 6, our main results,
PICsIT spectra, are widely presented and discussed. After a summary given in
Sect. 7, an extended Appendix A presents the results of tests
completed for different methods that can be used to extract the source count
rates from ![]() -ray instruments.
-ray instruments.
2 Instrument model
A detailed description of the PICsIT detector and IBIS in general can be found in the IBIS Observer's Manual (Kuulkers 2006) and in the references listed there. We present here only basic information related to the pixel-illumination modelling.
PICsIT is the PIxellated Caesium Iodide Telescope, which operates in the nominal
energy range of 175 keV-10 MeV and has an angular resolution of 12
![]() .
The fully coded field of view is a rectangle of 9
.
The fully coded field of view is a rectangle of 9
![]() and the
50% partially coded field of view has a size of 19
and the
50% partially coded field of view has a size of 19
![]() .
The detector consists of 4096 CsI crystals, organized in 8 Modular Detection
Units. Each pixel has the surface area of
.
The detector consists of 4096 CsI crystals, organized in 8 Modular Detection
Units. Each pixel has the surface area of
![]() mm2 and a 30 mm
thickness; pixels in a module are separated by 0.55 mm. The total sensitive area
is 2994 cm2. The IBIS mask is located 3283 mm above the PICsIT surface. The
mask consists of 9025 open or closed cells, each of surface area
mm2 and a 30 mm
thickness; pixels in a module are separated by 0.55 mm. The total sensitive area
is 2994 cm2. The IBIS mask is located 3283 mm above the PICsIT surface. The
mask consists of 9025 open or closed cells, each of surface area
![]() mm2, the total size of the mask being
mm2, the total size of the mask being
![]() mm2. Closed cells
consist of 16 mm thickness of tungsten. The ISGRI detector made of 16 384 CdTe
pixels (
mm2. Closed cells
consist of 16 mm thickness of tungsten. The ISGRI detector made of 16 384 CdTe
pixels (
![]() mm3) is mounted 9 cm above the PICsIT surface. The IBIS
collimator operates as a passive lateral shield and consists of the main IBIS
tube, a hopper giving an additional limit to solid angle observable by detectors,
and a side-mask shielding between the mask and tube walls. Both ISGRI and PICsIT
detectors are surrounded with lateral and bottom BGO crystals that form an
anti-coincidence shield, reducing the instrumental background by about a factor
of 2.
mm3) is mounted 9 cm above the PICsIT surface. The IBIS
collimator operates as a passive lateral shield and consists of the main IBIS
tube, a hopper giving an additional limit to solid angle observable by detectors,
and a side-mask shielding between the mask and tube walls. Both ISGRI and PICsIT
detectors are surrounded with lateral and bottom BGO crystals that form an
anti-coincidence shield, reducing the instrumental background by about a factor
of 2.
PICsIT operates in three modes: photon-by-photon, spectral-imaging, and spectral-timing. Due to the limited INTEGRAL telemetry, photon-by-photon mode is in practice used only for tests. Therefore, almost all PICsIT data are stored as spectral-imaging histograms and spectral-timing tables. The spectral-imaging is the basic mode since it provides full position information (count rate for each pixel) and 256 channels of energy information. Histograms correspond to a single science window (a single spacecraft pointing), thus the time resolution of the spectral-imaging data is usually in the range of 30-120 min. Spectral-timing data have a time resolution fixed between 1 and 500 ms but the count rates are integrated over all detector pixels and stored in only 8 energy channels. Therefore, this mode can be used only for extremely bright sources, typically GRBs, that have the signal strength that exceeds the background emission in short time intervals.
The spectral-imaging histograms are made for two types of events: single
and multiple. A single event detection is one in which there is only one photon
in a single PICsIT pixel. Multiple events are defined to be detections of 2 or 3
photons in a single submodule (half of the module, with pixels coupled
electronically); the event position is then given by the position of the pixel
with the highest energy deposit and the energy of the event equals the summed
energy of all photons registered within the event time. The fraction of multiple
events varies from ![]() 10% in the 300-400 keV band to
10% in the 300-400 keV band to ![]() 50%
in the 1500-2200 keV band. The logic of selecting single and multiple events
based on one submodule detection introduces some non-uniformity because the
multiple events in the border pixels are often registered as single events. This
paper describes the spectral extraction applied to single events
only, although the same procedure can be applied to multiple events.
50%
in the 1500-2200 keV band. The logic of selecting single and multiple events
based on one submodule detection introduces some non-uniformity because the
multiple events in the border pixels are often registered as single events. This
paper describes the spectral extraction applied to single events
only, although the same procedure can be applied to multiple events.
The standard analysis software for all INTEGRAL data is the Off-line Science Analysis (OSA) package, distributed by the INTEGRAL Science Data Centre (Courvoisier et al. 2003). The OSA software package presently allows for a limited PICsIT data analysis: image analysis for spectral-imaging data, and detector light curve and spectrum analysis for spectral-timing data. Taking into account that each source detected by PICsIT should be observable at lower energies by ISGRI, PICsIT alone is not expected to detect new sources. Therefore, the spectral extraction based on the Pixel Illumination Function (PIF) computed for the catalog source position appears to be more appropriate for quantitative PICsIT data analysis than the image deconvolution. The PIF-based method directly describes the photon absorption that on the detector surface creates a shadow of the mask illuminated by the source observed at a given angle. In contrast, image deconvolution is an indirect method, which usually applies some type of inversion or cross-correlation that can lead to decreased efficiency.
There has been a spectral extraction component in the OSA software since version 5.0 but the PIF model included is not yet reliable (Foschini 2007a). In consequence, all PICsIT spectra made with OSA are based on count rates determined from the mosaic images. For the purpose of the research presented here, a completely new software was developed for PIF modelling. The code was an adaptation of the code used to model the absorption in the Nomex structure supporting the IBIS mask (Lubinski 2007). The absorption of photons in the mask and the ISGRI detector layer was computed to be the mean fraction of source photons arriving at each pixel at given polar and azimuthal angles. Attenuation coefficients for tungsten (mask) and CdTe (ISGRI) are taken from the tables of Hubbell & Seltzer (1996). The PIF map is calculated for 22 energy bins, with an effective energy for each bin that is calculated by assuming that the spectral index of the source emission is 2.1. The probability that the photon arrives at each pixel of the detector is computed over a grid where photons are separated by 0.125 mm. The photon path length inside a given mask or ISGRI pixel was determined by numerical integration and the vertical step was also set to the value 0.125 mm, which was far smaller than the pixel size and thickness. Figure 1 presents an example of ISGRI and PICsIT PIF models calculated for the same science window and the same source. The Nomex structure supporting the IBIS mask absorbs between 10% and 25% of the source photons at energies above 200 keV, depending on the source off-axis angle. To correct the source count rates for this effect, a set of high-energy off-axis correction maps was prepared for PICsIT, in the same manner as those provided for ISGRI in the OSA package.
![\begin{figure}
\par\includegraphics[width=8.8cm,clip]{0897fg01.eps}
\end{figure}](/articles/aa/full_html/2009/11/aa10897-08/img25.gif) |
Figure 1:
ISGRI ( left, 50 keV) and PICsIT ( right, 450 keV) PIF models for science
window 007900330010 calculated for Cyg X-1 seen at 3.9
|
| Open with DEXTER | |
High energy photons from the source can pass through the IBIS tube walls
and illuminate the part of the detector that is not coded by the IBIS mask. For
that reason the non-coded part of shadowgrams cannot be used to estimate the
background level and the PIF is usually calculated only for the coded part.
However, the ISGRI PIF model implemented in OSA takes into account different
structures such as walls or hopper, providing a source illumination pattern for
the entire detector plane. This PIF model can be adapted for PICsIT after
applying shifts and changing the size of the pixels. Tube walls are quite
transparent to photons in the PICsIT energy range, for example, for sources at an
off-axis angle of 36
![]() and with an azimuthal angle of 53
and with an azimuthal angle of 53
![]() about 40%
of 450 keV photons can pass through the wall, illuminating the detector surface.
Therefore, it appears desirable to use such data in attempting to increase the
amount of information about a given source where the large off-axis angle
observations correspond to the exposure time, which can be several times longer
than the time of fully coded observations. Figure 2 shows an example
of the extended PIF model for the source observed at 36
about 40%
of 450 keV photons can pass through the wall, illuminating the detector surface.
Therefore, it appears desirable to use such data in attempting to increase the
amount of information about a given source where the large off-axis angle
observations correspond to the exposure time, which can be several times longer
than the time of fully coded observations. Figure 2 shows an example
of the extended PIF model for the source observed at 36
![]() off-axis. The
extended PIF model for PICsIT spectral extraction was tested with the Crab data,
and the results of these tests are presented in Sect. 6.2.
off-axis. The
extended PIF model for PICsIT spectral extraction was tested with the Crab data,
and the results of these tests are presented in Sect. 6.2.
![\begin{figure}
\par\includegraphics[width=5cm,clip]{0897fg02.eps}
\end{figure}](/articles/aa/full_html/2009/11/aa10897-08/img26.gif) |
Figure 2:
PICsIT extended PIF model for science window 022000970010 calculated for
Crab seen at 36
|
| Open with DEXTER | |
3 Background model
Given the fact that the PICsIT instrumental background rate exceeds the source
count rate by several orders of magnitude, a correct analysis of PICsIT data must
be based on careful modelling of the background. The background model for a given
observation must be prepared after detailed studies of general PICsIT background
properties and investigation of the behaviour of the background during that
observation. Positions of the ![]() -ray lines are one of the basic
characteristics of the background. Since these lines are emitted by isotopes
produced by cosmic rays in the detector and the surrounding materials, a spatial
distribution of the count rate over the detector surface is energy dependent.
Another important property of the background is its time evolution. Long-term
variability should be monitored to check, for example, the positions of the lines
in the background spectra. Short-term variability must be studied for selection
of data that can be used to prepare the background map for a given observation.
Solar flare periods or time intervals with a strange background behaviour should
also be excluded. This section presents the results of the PICsIT background
studies.
-ray lines are one of the basic
characteristics of the background. Since these lines are emitted by isotopes
produced by cosmic rays in the detector and the surrounding materials, a spatial
distribution of the count rate over the detector surface is energy dependent.
Another important property of the background is its time evolution. Long-term
variability should be monitored to check, for example, the positions of the lines
in the background spectra. Short-term variability must be studied for selection
of data that can be used to prepare the background map for a given observation.
Solar flare periods or time intervals with a strange background behaviour should
also be excluded. This section presents the results of the PICsIT background
studies.
3.1 Spectra
Figure 3 shows PICsIT background spectra from different periods of the mission. The spectra were integrated over one spacecraft revolution (hereafter Rev.) lasting almost 72 h. The spectrum of Rev. 0541 (19-21 March 2007), taken exactly 4 years after the Rev. 0052 spectrum (18-20 March 2003) illustrates how the background emission evolves during the mission. The sharpest increase in the emission with time was observed at low energy, below 300 keV, where the Rev. 0541 count rate was about as twice high as the Rev. 0052 count rate. Above 300 keV, the count rate after 4 years was about 50% higher than at the beginning of INTEGRAL operation.
The PICsIT energy resolution is rather coarse, varying between 30% at 300 keV and 4% at 4 MeV (Malaguti et al. 2003b). In spite of this, the background
spectra are not completely smooth, exhibiting strong peaks at 511 and 680 keV, weaker peaks at 1800 and 2750 keV, and a broad hump between 800 and 1700 keV. The identification of the background characteristic features can be useful
in properly adjusting the energy bins used in the data analysis and monitoring
the energy calibration stability. Due to the limited energy resolution even the
strongest lines positions were affected by contamination from weaker lines
nearby, while weaker lines were hidden in the Compton continuum associated with
the stronger lines, which form broad humps everywhere below 1700 keV.
Therefore, only several background lines could be identified with a high level of
plausibility. These identifications were supported by comparison with the list of
SPI background lines (Weidenspointner et al. 2003) that were clearly resolved, and
the data about CsI proton activation measurements (Ruiz et al. 1994). The main lines
identified in normal (non-flaring Sun periods)
spectra are listed in Table 1. The two strongest lines, the 511 keV
(![]() decay line) and the 680 keV complex, are emitted predominantly by
the iodine, caesium, and antimony isotopes produced in the detector material.
Radioactive bismuth is produced in the BGO crystals of the IBIS anticoincidence
system, whereas sodium and aluminum activity originates in the aluminum frame
holding both IBIS detectors.
decay line) and the 680 keV complex, are emitted predominantly by
the iodine, caesium, and antimony isotopes produced in the detector material.
Radioactive bismuth is produced in the BGO crystals of the IBIS anticoincidence
system, whereas sodium and aluminum activity originates in the aluminum frame
holding both IBIS detectors.
In addition to the lines presented in Table 1, normal spectra also
exhibit weak emission around 2230 keV, presumably from a
1H(![]() )2D reaction. The bumps observed between 800 and 1700 keV
are probably associated with emission from numerous isotopes produced mainly in
the detector and its frame, for example 59Fe, 67Ni, 28Mg, and
120Sb. In the spectrum from Rev. 0356 taken during flare, the Sun and Earth
atmosphere emission by light isotopes is observed at high energy. There are five
lines at about 2200, 3400, 3900, 4150, and 4450 keV, which can be identified with
the emission from (15O, 11B, 10B, 16O, 15N, 14N,
13N), (14N), (13C, 14N), (16O) and (12C, 11B),
respectively (Share & Murphy 2001). During quiet Sun states, the Earth atmospheric
emission is not observed, as demonstrated by analysing the spectra extracted from
Revs. 0401, 0404, 0404, and 0406, when the INTEGRAL Earth occultation observation
(Churazov et al. 2007) was performed.
)2D reaction. The bumps observed between 800 and 1700 keV
are probably associated with emission from numerous isotopes produced mainly in
the detector and its frame, for example 59Fe, 67Ni, 28Mg, and
120Sb. In the spectrum from Rev. 0356 taken during flare, the Sun and Earth
atmosphere emission by light isotopes is observed at high energy. There are five
lines at about 2200, 3400, 3900, 4150, and 4450 keV, which can be identified with
the emission from (15O, 11B, 10B, 16O, 15N, 14N,
13N), (14N), (13C, 14N), (16O) and (12C, 11B),
respectively (Share & Murphy 2001). During quiet Sun states, the Earth atmospheric
emission is not observed, as demonstrated by analysing the spectra extracted from
Revs. 0401, 0404, 0404, and 0406, when the INTEGRAL Earth occultation observation
(Churazov et al. 2007) was performed.
![\begin{figure}
\par\includegraphics[width=8.7cm,clip]{0897fg03.eps}
\end{figure}](/articles/aa/full_html/2009/11/aa10897-08/img29.gif) |
Figure 3:
PICsIT background spectra from Revs. 0052, 0130, 0356, and 0541. Data are
divided by the power-law model with a spectral index |
| Open with DEXTER | |
Table 1: Strongest PICsIT background lines seen in the spectra collected during non-flaring Sun periods. The most probable line origin is listed first. T1/2 is the half-life decay time of a given isotope. Lines around 670 and 690 keV form the 680 keV complex (see text).
3.2 Energy calibration
A routine energy calibration for PICsIT is based on the special data (so-called S5 datastream) collected in coincidence with the emission from the onboard 22Na calibration source (Bird et al. 2003). S5 data are collected as separate 64-channel spectra and monitored by the instrument team (Malaguti et al. 2003b), providing the parameters for the channel-energy conversion. This standard calibration assumes that energy is a linear function of the channel number, which in general is not necessarily true. Studies of 256-channel background spectra completed directly by using the standard spectral-imaging histograms of single events can help in controlling the energy calibration, as well as extending it outside the 511-1274 keV range of S5 data.
Energy calibration tests were completed as follows. Background spectra were extracted for all public data from revolutions 0039-0676. The positions of the 511, 667, and 1779 keV lines were then fitted in channel space using Xspec 11 (Arnaud 1996). The lines were modelled with Gaussian shape and the local continuum was asummed to be in the form of a powerlaw. After some initial calibration tests, the most reliable gain value was established to equal the width of one basic channel, i.e., 7.1 keV, in agreement with the standard energy calibration performed by the IBIS team (Foschini et al. 2007). The only remaining parameter needing to be adjusted was then an offset, a shift in energy units to be applied to the original onboard histograms to ensure that the three tested lines were in the correct positions. The best-fit offset was found to be +9.6 keV with respect to the standard energy calibration of PICsIT. The first usable channel of spectral-imaging single-events histograms was channel number 10, which in the standard OSA 7.0 calibration starts at 203 keV and in the new calibration presented here at 212.6 keV.
The mean positions and 1-![]() errors found for the background lines in the
spectra from revolutions 0170-0676 are equal to
errors found for the background lines in the
spectra from revolutions 0170-0676 are equal to
![]() keV,
keV,
![]() keV and
keV and
![]() keV. Before revolution 170, a different binning was
applied to the onboard histograms and the data were treated separately. The
corresponding mean positions of the calibration lines were found to be shifted by
about +5 keV with respect to the results quoted above.
keV. Before revolution 170, a different binning was
applied to the onboard histograms and the data were treated separately. The
corresponding mean positions of the calibration lines were found to be shifted by
about +5 keV with respect to the results quoted above.
The main factor driving the offset of energy calibration is the temperature of the PICsIT detector (Malaguti et al. 2003b). Short time variations in the line position reach as high as about 15 keV on timescales of weeks. This is a large value compared to the minimal width of the bin used in spectral extraction, 21.3 keV. In principle, this can introduce fluctuations in the extracted count rates. As we show in Sect. 6.3, Crab count rates are stable over the mission time, which indicates that the offset correction is not very important, although it should be taken into account in a proper preparation of the background maps. This is currently achieved by preparing several maps for revolutions with large temperature variations, using data from periods with an approximately constant temperature.
3.3 Variability
The count rate of the PICsIT background varies strongly in response to the cosmic-ray intensity changes, since it is moderated by the decay time of various radioactive nuclei produced in the detector neighborhood. On average, the background count rate increased with time during the first four and a half years of INTEGRAL operation, as shown in Fig. 4. This increase was caused by both the solar modulation of the cosmic-ray intensity and the accumulation of the radioactivity in the detector assembly. The increase in the background count rate is irregular, there are periods of high variations but there are also periods of almost constant count rate. Since March 2007 (around Rev. 0540), the background appeared to have saturated at a level of about 60% higher than the initial one. However, below 250 keV the increase in the background count rate is far more significant, higher than 100% since the beginning of the mission and appears still not to be saturated.
![\begin{figure}
\par\includegraphics[width=8.7cm,clip]{0897fg04.eps}
\end{figure}](/articles/aa/full_html/2009/11/aa10897-08/img34.gif) |
Figure 4: Variation in the PICsIT background count rate during the mission. Error bars correspond to the standard deviation of the mean for a given revolution and are much larger during solar flaring periods. |
| Open with DEXTER | |
Within a single revolution, a substantial variability is also observed, induced
mainly by the spacecraft passages through the Earth radiation belts and the Solar
activity. An example of this variability is presented in Fig. 5, for
six energy bands between 213 keV and 1940 keV. This figure illustrates a rather
typical behaviour, where the total count rate decreases with time for energies
below ![]() 511 keV and increases above that energy. The very low energy bands
(close to 200 keV) usually exhibit a different type of variation, due to the
track events. The second and third (from top) panels of Fig. 5
indicate that the background variability can be quite different in two close
energy bands. Consequently, spectral extraction with a background model
constructed for too wide an energy band can be inefficient when the radiation in
the low-energy part of the band increases but in the high-energy part decreases
with time. In general, there is a variety of background light curves observed,
sometimes the changes in all energy bands are correlated, sometimes there are
flare-like events or rapid count-rate variations that are only observable for a
limited energy range. Therefore, for a correct background modelling, the
variability in narrow energy bands must be determined for each revolution.
511 keV and increases above that energy. The very low energy bands
(close to 200 keV) usually exhibit a different type of variation, due to the
track events. The second and third (from top) panels of Fig. 5
indicate that the background variability can be quite different in two close
energy bands. Consequently, spectral extraction with a background model
constructed for too wide an energy band can be inefficient when the radiation in
the low-energy part of the band increases but in the high-energy part decreases
with time. In general, there is a variety of background light curves observed,
sometimes the changes in all energy bands are correlated, sometimes there are
flare-like events or rapid count-rate variations that are only observable for a
limited energy range. Therefore, for a correct background modelling, the
variability in narrow energy bands must be determined for each revolution.
![\begin{figure}
\par\includegraphics[width=8.7cm,clip]{0897fg05.eps}
\end{figure}](/articles/aa/full_html/2009/11/aa10897-08/img35.gif) |
Figure 5: Total PICsIT count rate measured in eight energy bands during Rev. 0159. IJD is the INTEGRAL Julian Date (IJD = MJD-51 544.0). |
| Open with DEXTER | |
3.4 Background maps
The background model for PICsIT is the map of pixel count rates corresponding to the background emission registered in a given energy band during some period of time. Both the sum of photons originating in all point sources in the field of view and the summed diffuse sky emission equal at most of the order of several per cent of the total detector count rate at energies above 200 keV. Accordingly, the background map consists of a sum of shadowgrams collected during a number of dithering observations, such that the point sources and the diffuse emission patterns are spread over the detector surface. In this way, the background model contains the same data used subsequently to extract the source count rate. The dithering observational strategy thus allows us to obtain for the coded-mask instruments the highest quality background estimate, based just on the actual data. This is one of the most important virtues of masked pixellated detectors compared with standard telescopes, where the background must be determined in some indirect way, such as a rocking observing strategy as applied for OSSE.
While there is no variation in count rate within each pixel during an observation, the background map provides the most accurate, experimentally-determined background model, with an accuracy increasing with the exposure time. This situation never occurs in reality and the main task in achieving a correct background model is to describe properly its variation in time. Some observations are also taken in special conditions, such as staring mode, when the map cannot be prepared with the contemporary data. Consequently, the variability model should allow us to check if another map can be used for these special observations. The simplest way of taking into account the background variability in time is to assume that there is only one global trend, coherent for all pixels. The only parameter that has then to be determined with the source count rate is the background map normalization for a given science window. As shown in Sect. 6, this approach produces completely acceptable results.
In view of the considerations mentioned above, the only parameter that is free in the modelling of the background is the time period for which the background map is prepared. Since the spacecraft activation is caused predominantly by passages through the Earth radiation belts, the natural choice of time interval for which a map is prepared is the revolution period. Owing to the large number of counts collected by each pixel during this time period, the accuracy of the revolution-averaged background rate is sufficiently high. On the other hand, if there is a sub-orbit variation observed, the shortest time for which the background map can be prepared is limited by the condition of smoothing the source illumination pattern. This will depend on the actual dithering pattern, but usually about 10 science windows are sufficient to obtain a sufficiently smoothed summed shadowgram. Nonetheless, producing more than one background map for a single revolution is unnecessary, unless there is clear variability in the background mean count rate or the detector temperature measured during the orbit time. In practice, almost all results presented later were obtained with the use of a single map, apart from several observations of Crab and Cyg X-1, where two maps per revolution were needed to suppress an artificial trend found in the source light curves.
Data used to prepare the map were selected according to the mean count-rate level over all pixels in a given science window. The fluctuations in that value usually did not exceed 3% for periods with a stable background and this criterion was adopted for the PICsIT data analysis presented in this paper. In the spectral extraction, a similar criterion was used, excluding the data, when the background map normalization was outside the 0.97-1.03 range. This selection automatically excludes periods with solar flares or science windows affected by the passage through the radiation belts at the beginning or end of revolution.
![\begin{figure}
\par\includegraphics[width=8.5cm,clip]{0897fg06.eps}
\end{figure}](/articles/aa/full_html/2009/11/aa10897-08/img36.gif) |
Figure 6: Distributions of differences between 336-448 keV shadowgram from Rev. 0079 and corresponding shadowgrams from Revs. 0070 to 0078 and 0080 to 0090 (starting from the upper left, row by row). Warmer colours (yellow, red) correspond to the higher count rates. The smallest differences (flattest images) are observed for Revs. 0072, 0075, 0078, 0080 and 0081. There was a small solar flare in Rev. 0076 that changed also the background distribution in the following revolution. |
| Open with DEXTER | |
When it was not possible to prepare the map for part or an entire revolution, one could use, in principle, a map prepared for another period close in time. Tests done for the Crab indicated that this approach did not always provide good results, especially when the map is constructed with data from another revolution. The simplest way of confirming the adequacy of a map is an investigation of the differences or ratios between the pixel count rates in the summed shadowgrams from both the map and the source observation. Figure 6 presents an example of this test made for the summed shadowgram from Rev. 0079 when Cyg X-1 was observed. The flattest difference shadowgrams are those for Revs. 0078 and 0080 (two rightmost in the second row of the plot). It has to be kept in mind, however, that this test may not be applicable when a relatively strong source is observed in staring mode, because then there will be a systematic imprint on the shadowgram from the source illuminating the same pixels all of the time. A possible solution to this limitation is to test the background stability over several revolutions adjacent to the actual source observation and to prepare some mean map.
4 Count-rate extraction method
The necessity of merging a large amount of PICsIT data to detect weaker sources
not only compels one to model the background precisely but also to apply a method
that is strictly correct for data with a low signal-to-noise ratio. Otherwise,
the inadequacy of the method can produce results with a bias comparable to the
signal strength. The most common way of estimating some parameter value and its
confidence limits is the application of the ![]() test statistic. Although
it is well known that the conditions needed to justify the use of the
test statistic. Although
it is well known that the conditions needed to justify the use of the ![]() test are not fulfilled for low number of counts, it is worth reminding us of all
limitations of the standard technique.
test are not fulfilled for low number of counts, it is worth reminding us of all
limitations of the standard technique.
- 1.
- The assumption that the Poisson distribution can be approximated by a
Gaussian distribution for a large number of counts is not always justified
because these distributions differ: the Poisson distribution is asymmetric
with non-zero skewness and kurtosis, whereas the Gaussian distribution is
symmetric with zero skewness and kurtosis. When the signal has an
amplitude comparable with the difference in shapes of the Poisson and
Gaussian distributions for the total (signal+background) number of counts,
the Gaussian approximation will provide a systematically biased result;
- 2.
- the Poisson distribution is defined for parameters of non-negative values.
Count rates also cannot be negative and any analysis using a Gaussian or other
distribution in negative signal space does not offer a completely proper
description of the phenomenon;
- 3.
- the difference of two parameters both characterized by a Poisson
distribution is not Poisson distributed. Consequently, the signal+background and
the background alone should be modelled simultaneously instead of
subtracting the background rate from the total rate, especially when this
subtraction leads to negative signals;
- 4.
- since the true variance is usually unknown, the observed number of counts
serves as a variance estimate for the
 statistic. This approximation
is invalid for a small number of counts and many solutions have been proposed to
improve the variance estimate, but none of them performs well for weak signals,
when zero net counts are measured in a majority of trials;
statistic. This approximation
is invalid for a small number of counts and many solutions have been proposed to
improve the variance estimate, but none of them performs well for weak signals,
when zero net counts are measured in a majority of trials;
- 5.
- to estimate the uncertainty of a parameter of interest when many parameters are fitted simultaneously, one usually considers the limits corresponding to the change in the statistic by a certain value (Lampton et al. 1976). This approach based on the projection of the respective parameter confidence region onto the parameter axis often overestimates the error. Moreover, its basic condition, namely the use of the model variance, is not met in many practical applications, as stated in point 4.
A Bayesian technique for dealing with the Poissonian type data in the presence of known or unknown background was presented by Loredo (1990). This type of approach applied to a low-quality ASCA data obtained for weak AGNs, was demonstrated to reconstruct precisely the assumed shape of the iron line complex (Lubinski 2004). Due to its efficiency, the method has now been generalized to deal with the extraction of count rates for objects observed with PICsIT. Developments have occured in two respects: the Poisson PDF is now computed in two (or more) dimensions, and the model now takes into account the main observation conditions.
The probability density function
pk(s,bk) of the source count rate
parameter s and the background map normalization factor bk in the science
window number k for a given energy band is defined as the product of Poisson
PDFs P for all nk active pixels
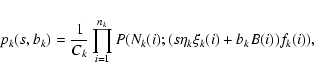
where the factor Ck normalizes the pk(s,bk) integral to 1, Nk(i) is the number of counts measured by the i-th pixel,
| (2) |
using the exposure time Tk and the pixel efficiency
The density pk(s,bk) is the posterior probability density, i.e. the prior probability densities on s and bk are assumed to be uniform. When a large amount of data is used, as in the PICsIT case, with thousands of pixels and hundreds of science windows, the final density distribution associated with the detected source signal is sufficiently concentrated not to be affected by the choice of the prior distribution.
Since the calculation of the PDF must be performed for a relatively wide range of s and bk, the product in Eq. (1) is computed by summing the PDF logarithm to avoid the multiplication of many small numbers. The final PDF p(s) is derived after integrating pk(s,bk) over the background normalization parameter and then computing the product of pk(s) for all science windows of interest. Using p(s), one can extract all needed parameters such as the mean, the median, or the desired credibility intervals. For PICsIT, it is possible to have a detection in a single science window only for sources at least as bright as the Crab. To achieve a reliable result for weaker objects, a large number of science windows must be merged. Table 2 compares typical values of the number of counts, count rates, and signal-to-noise ratios for data of a 50 mCrab source observed with PICsIT and a 2 mCrab source observed with ISGRI.
Table 2:
Typical source (![]() )
and background (
)
and background (![]() )
count rates observed
with PICsIT (upper part, Rev. 0301) and ISGRI (lower part, Rev. 0079) for sources
of 50 mCrab and 2 mCrab strength, respectively. Corresponding numbers of counts,
)
count rates observed
with PICsIT (upper part, Rev. 0301) and ISGRI (lower part, Rev. 0079) for sources
of 50 mCrab and 2 mCrab strength, respectively. Corresponding numbers of counts,
![]() and
and ![]() ,
were calculated for science windows with a 2 ks exposure
time. S/N is the signal-to-noise ratio, and
,
were calculated for science windows with a 2 ks exposure
time. S/N is the signal-to-noise ratio, and
![]() is the number of
science windows with the 2 ks exposure time needed to obtain a 3-sigma detection.
is the number of
science windows with the 2 ks exposure time needed to obtain a 3-sigma detection.
Examples of Poisson PDFs obtained for a true source are presented in Fig. 7. PDFs computed for a single science window are very broad when compared to the source count rate. For an object as weak as GRS 1758-258 (about 70 mCrab in the 300-500 keV band), even one-revolution of data is not enough to achieve a detection. Nevertheless, thanks to a frequent monitoring of the Galactic centre field by INTEGRAL, it is possible to follow the seasonal (i.e. on the scale of several months) changes in the high energy emission from this source in several energy bands below 500 keV.
| |
Figure 7: Examples of Poisson PDFs obtained for GRS 1758-258 in the 298-319 keV band. Left: broad distributions obtained for several single science windows from Rev. 0105 (dashed lines) and a narrower PDF from all Rev. 0105 data merged (solid line). Right: the same total PDF from Rev. 0105 (dashed line) compared to that of Rev. 0103 (dot-dashed line), and the final result for all data of August-October 2003 period (solid line), with an exposure time of 1.95 Ms. |
| Open with DEXTER | |
The technique presented in this paper is the most correct means of handling the
Poisson-distributed data within the Bayesian framework. Due to this first
application of such a method to extract the astrophysical ![]() -ray data,
some tests of the performance are needed to check for example the limiting signal
that can be extracted and compare this technique with several other commonly used
methods. An obvious test is to use this method for the ISGRI spectral extraction
and to compare the results with those of the standard OSA software. The results
of these tests are presented in Appendix A.
-ray data,
some tests of the performance are needed to check for example the limiting signal
that can be extracted and compare this technique with several other commonly used
methods. An obvious test is to use this method for the ISGRI spectral extraction
and to compare the results with those of the standard OSA software. The results
of these tests are presented in Appendix A.
The computation time needed to extract the source count rate over a PDF grid as
fine as possible (the grid step should be much smaller than the expected rate) is
long compared to the time needed by the method using the fitting with some
statistic. For only two parameters handled (the count rate for a single source
and the background normalization), computing over a PDF grid can be
performed even for a large data set. However, if there are several sources in the
field of view, the computation over the grid has to be replaced by some Monte
Carlo integration of multi-dimensional PDFs. Such procedures are time consuming
and need some adjustments to accelerate the data analysis. Due to the small
number of sources observed with PICsIT, this type of software does not appear to
be needed, especially in a situation when the emission from any contaminating
source is far weaker than the background. Nevertheless, a version of the software
with the Monte Carlo integration implemented was prepared and tested with the
simulated data for up to 7 sources in the field of view. These tests show that
only in the case of sources separated by a short distance (less than several
degrees) there can be some contamination for weaker sources. An independent test,
where the single-source PDF method was applied separately to ISGRI data of NGC 4151 and NGC 4051 (separated by 5.3
![]() ), has shown that the results for both
objects are fully consistent with those of the standard OSA software handling
many sources at once.
), has shown that the results for both
objects are fully consistent with those of the standard OSA software handling
many sources at once.
5 Detection limits
The standard way of verifying whether the observed signal corresponds to a detection is the ``n-sigma'' significance test. The test statistics (significance) is defined as the difference between the measured signal+background and the background estimated in an independent way, divided by the noise represented by the standard deviation of that difference. Detection can be claimed if the observed significance is higher than the threshold for a given probability level, e.g., 3 for probability level 0.997 (3-sigma test). The significance level is often set to 5- or 6-sigma because such a conservative approach is supposed to account for the number of trials or to balance all possible systematic effects not incorporated into the uncertainty calculation.
In true situations, the significance estimate should take into account all circumstances of the measurement: the detector model, the background model, and the method used to extract the count rate. For coded-mask instruments, one has to take into account the mask pattern and transparency, the spatial resolution of the detector and the background non-uniformity. There are many approaches developed to determine analytically the sensitivity of coded-mask instruments (see Skinner 2008, and references therein).
This simple ``n-sigma'' significance test cannot be applied to the results of the technique presented here. The method based on the Poisson PDFs extracts the net source count rates without direct background subtraction and operates in a physical, non-negative parameter space. The mean net count rate determined by integrating a PDF over a non-negative argument cannot be zero even when there is no signal, although it decreases with increasing exposure time. Therefore, there will always be some signal excess above zero resulting in an overestimation of the true significance level. On the other hand, for the weak signals expected to be observed with PICsIT, a too conservative approach might exclude some potential sources from the analysis. Therefore, we would like to find a way of estimating the true noise level. This will be useful not only for the verification of the results but will also help to judge if the source with a given flux level can be detected after a given observation time.
The question addressed here is: ``what is the probability of obtaining a false
signal, arising from the background (noise) fluctuation and described by the
probability density function with a given mean count rate, for an observation
lasting a given time''. To find the answer, we compiled the distribution of mean
count rates extracted for random positions in fields that do not include strong
sources. The tail of the distribution was then fitted to find the upper noise
limit corresponding to a given probability level. Tests of the PICsIT noise level
were completed for six wide energy bands: 277-362, 362-461, 461-632, 632-930,
930-1938, and 1938-3131 keV. The limits of these wide bands were adjusted to
have a coherent background variation within a given band (see Sect. 3.3). Input empty-field data were selected as observations when all of
the eight possibly brightest PICsIT sources (Crab, Cyg X-1, GRS 1758-258, 4U
1700-377, GRS 1915+105, Cen A, 1E 1740.7-294, XTE J1550-564) were farther than
45
![]() away from the pointing direction. This criterion provided 5599 science
windows from Revs. 0047-0450 with the total exposure time equal to 14.48 Ms.
Input PIF data were calculated for 91 (
away from the pointing direction. This criterion provided 5599 science
windows from Revs. 0047-0450 with the total exposure time equal to 14.48 Ms.
Input PIF data were calculated for 91 (
![]() )
possible positions
corresponding to the hexagonal dithering pattern with a so-called ``wandering
centre of pattern'' (Kuulkers 2005). The hexagonal dithering pattern was chosen
because in this case the object is in the fully coded FOV all the time and there
is no need to correct the exposure time for incomplete detector illumination.
)
possible positions
corresponding to the hexagonal dithering pattern with a so-called ``wandering
centre of pattern'' (Kuulkers 2005). The hexagonal dithering pattern was chosen
because in this case the object is in the fully coded FOV all the time and there
is no need to correct the exposure time for incomplete detector illumination.
At the beginning of each test, the PIF was randomly selected for each input science window. The net source count rate was then extracted for each science window using the method described in the previous section. These results were merged for a subset of all science windows to obtain the mean count rate for a given assumed total exposure time. For shorter times, it was possible to select the subset several times because the entire sample was sufficiently large to avoid repetition. To ensure that the tail of the mean count-rate distributions could be determined to a good precision, approximately 1000 tests had to be performed. However, since computation of one test takes several hours on a 20-CPU grid network, it is impossible in practice to complete 1000 tests for times longer than 1 Ms.
Upper noise limits were calculated for probability values corresponding to the
commonly used ``n-sigma'' significance levels, where n was in the range 1-5. The
limit of 1-sigma significance level was determined as the mean
count rate value for which the sum of runs, starting from the minimal mean count
rate, reaches 68.3% of the total run number. A model function was then fitted
to the tail of the distribution, i.e. above a 1-sigma limit and the 2-5 sigma
limits are found via integration of that tail model. Because the true shape of
the distribution was unknown, three model distributions were tested for the 277-362 keV band, where the number of tests was much larger, reaching more than
11 000 runs for the shortest 10 ks exposure time. The Gaussian function was used
to model a rapid decline and the exponential function to model a slow decrease.
The third model included a gamma distribution, which reproduced an intermediate
decrease. For distributions analyzed with a large number of tests (>1000), the
best fit was always obtained with the Gaussian distribution. The fitted gamma
distribution was usually quite similar to that of the Gaussian, but the 3-sigma
upper limit was found to be slightly (1-5%) larger. The exponential model, in
turn, seems to underestimate the decrease in the tail, giving always the highest
![]() .
The uncertainty in the fitted 3-sigma upper limit was estimated to
be, in general, not larger than 10% and 20% for the exposure times below and
above 1 Ms, respectively. This estimate was based on tests with an increasing
number of runs using different tail models.
.
The uncertainty in the fitted 3-sigma upper limit was estimated to
be, in general, not larger than 10% and 20% for the exposure times below and
above 1 Ms, respectively. This estimate was based on tests with an increasing
number of runs using different tail models.
Figure 8 presents the example of noise limit estimate for the 277-362 keV band and exposure times of 10 ks and 1 Ms. The distributions of mean count rates extracted for empty fields are asymmetric and clearly peaked above zero. Comparison of the three fitted tail models is shown in the upper panel of the figure. For 1 Ms, three PDFs are presented with the highest mean count rate, which illustrate the typical shape of the probability density distribution at this count rate level. These PDFs are compared with two PDFs obtained for the microquasar GRS 1758-258 after observations lasting about 1.05 Ms. The GRS 1785-258 PDFs correspond roughly to 5 and 6-sigma detections.
![\begin{figure}
\par\includegraphics[width=8.5cm,clip]{0897fg08.eps}
\end{figure}](/articles/aa/full_html/2009/11/aa10897-08/img45.gif) |
Figure 8: Distributions of mean count rates in the 277-362 keV band extracted for fake sources in empty fields. Upper panel: total exposure time 10 ks, 11 000 tests. Solid, long-dashed and short-dashed lines show the Gaussian, gamma, and exponential models, respectively, fitted to the tail of the distribution, i.e. above the count rate corresponding to a 1-sigma upper limit. Vertical lines indicate the positions of the best-fit 2 and 3-sigma upper limits. Lower panel: total exposure time 1 Ms, 1000 tests. The solid line shows the Gaussian function fitted to the tail of the distribution. Vertical lines present the 1 to 5 sigma upper noise limits computed using the fitted Gaussian tail. Three extremely high-noise distributions for 1 Ms are shown with dotted lines, and two examples of count rate distributions obtained for GRS 1758-258 with a similar observing time are drawn with dashed lines. |
| Open with DEXTER | |
The results of the noise level studies for 3-sigma detection limits are collected
in Table 3. A wide range of effective exposure times should allow for
a relatively precise interpolation for a particular observation time. The last
row of the table shows the mean PICsIT fluxes measured for the Crab that can be
used to convert the limits into Crab units. PICsIT sensitivity limits for 1 and
10 Ms are compared in Fig. 9 with the 1 Ms sensitivity limits computed
in an analytical way for PICsIT, SPI, and OSSE. Sensitivity limits for PICsIT and
SPI were calculated using the on-line Observation Time Estimator (OTE)![]() . The formulae used by the OTE were described in
Bélanger (2008). OSSE sensitivity data are taken from Fig. 3 of
Winkler (1994).
. The formulae used by the OTE were described in
Bélanger (2008). OSSE sensitivity data are taken from Fig. 3 of
Winkler (1994).
Table 3: PICsIT 3-sigma sensitivity limits determined through the extraction of count rates for fake sources in the empty field observations. The last row presents mean fluxes determined for Crab.
Despite the different approach used in the computation, PICsIT sensitivities based on the noise level tests and given by the OTE tool are consistent for the first two energy bands. Above 460 keV, the OTE estimates are well below those determined experimentally. Since noise determination based on the empty field observations takes into account several effects not included in the OTE model (e.g. background non-uniformity, background level evolution with time, and a realistic PIF model) one can expect OTE to overestimate the PICsIT sensitivity. The same concern can possibly be raised for the SPI sensitivity estimates made in an analytical way. The PICsIT detector should be more sensitive to continuum observations because of its larger area and volume, the higher quantum efficiency of CsI compared with Ge crystals in terms of registering photons, and higher number of detector and mask pixels allowing for a more robust disentanglement between the signal and the noise. Nevertheless, a more reliable comparison of the SPI and PICsIT sensitivity is not possible unless a noise study similar to that completed for PICsIT is also completed for SPI. On the other hand, this comparison is probably more secure for the OSSE detector because of the rocking strategy of observations with that instrument. PICsIT appears to be much less sensitive than OSSE. As can be seen in Fig. 9, PICsIT needs about 10 times longer exposure time to reach the OSSE S/N ratio because its volume is three times smaller. This lower efficiency is partly compensated, however, by a larger fraction of observing time (because of a higher orbit).
![\begin{figure}
\par\includegraphics[width=8.5cm,clip]{0897fg09.eps}
\end{figure}](/articles/aa/full_html/2009/11/aa10897-08/img46.gif) |
Figure 9: PICsIT sensitivity limits for a 3-sigma detection for an exposure time of 1 Ms. The thick solid lines show the estimates based on the noise level test for 1 and 10 Ms effective exposure times. Dotted and dash-dotted lines correspond to the OTE tool results for 1 Ms observation with SPI and PICsIT, respectively. The dashed line shows the 1 Ms sensitivity limits for OSSE. Thin lines show the fluxes for 10 mCrab, 100 mCrab and 1 Crab sources with the spectral slope fixed to 2.2. |
| Open with DEXTER | |
6 PICsIT spectra
We now review the PICsIT spectra extracted for various objects. Some of these spectra are used to verify PICsIT calibration, by comparing them with the spectra obtained from two other high-energy INTEGRAL detectors, SPI, and ISGRI. Potential problems that might arise due to systematic effects are checked using Crab spectra. The results of the spectral extraction method based on the Poisson PDF (hereafter PPDF) technique described in Sect. 4 are compared with the results obtained with the standard OSA 7.0 software. Finally, examples of spectra derived for several detected objects are shown against the noise level expected for a given exposure time.
6.1 Calibration
Cross-calibration tests are one of the most important elements of the verification of a given detector performance. Due to the presence of three high-energy detectors onboard INTEGRAL observing the source at the same time, these tests are easier and more reliable than in the case of satellites hosting only a single instrument operating in a given energy range. Moreover, the SPI detector was carefully calibrated before the launch of INTEGRAL (Attié et al. 2003), which ensured that the calibration check was independent of the details of the particular model assumed for a calibration source such as the Crab. A lot of effort has been invested since the beginning of the mission to calibrate well the ISGRI and SPI instruments, resulting in a good performance in the energy range below 100 keV (Jourdain et al. 2008). Due to a limited ISGRI sensitivity above 100 keV, there is however still a spectral slope issue remaining for the high energy part of the spectra. On the other hand, PICsIT standard OSA spectral extraction was applied only to a limited number of sources. This enabled only a crude check of the calibration, suggesting that there was an overall agreement between PICsIT and ISGRI spectral results (Foschini et al. 2007).
The first PICsIT response files for single-event spectra were provided to the user community with the OSA 4.2 release in December 2004. The two response files currently used are the RMF pics_srmf_grp_0003.fits (or pics_srmf_grp_0005.fits rebinned to the default energy bins) and the ARF pics_sarf_rsp_0003.fits. Both files were used in the tests presented here, although both interpolation and smoothing were applied to them to correct for discontinuities caused by the too wide energy bands used in their Monte Carlo computation. These corrections were necessary for obtaining smooth background spectra without jumps, observable when the standard responses are used (see e.g. Fig. 6 in Bélanger 2008). The source spectra with finer binning are also smoother after this correction, although the overall calibration remains similar to the standard one. The final change that remains to be applied to the current response is the correction for the influence of the mask pattern. Preliminary tests showed that this correction affects mainly the high-energy part of the response, with the spectral fitting results below 1 MeV remaining virtually the same (Natalucci, private communication).
Another issue related to the INTEGRAL cross-calibration is the ISGRI spectral
slope above 100 keV. Due to superior sensitivity up to about 150 keV, ISGRI
spectra dominate the INTEGRAL spectral fitting. Therefore, even a small
discrepancy between the spectral slope of data from ISGRI and the two other
detectors, can change substantially the results of a broad-band fit, producing a
model with an incorrect spectral shape at high energy and incorrect relative
normalization between instruments. For a long time, the photon index ![]() of
the reference Crab model used in ISGRI calibration was set to be 2.225 for the
entire ISGRI energy range. In OSA 7.0, following the recommendation of the
INTEGRAL Users Group, it was changed to 2.1 below 100 keV and 2.34 above 100 keV,
to match the SPI Crab spectrum, as provided by the SPI team. However, the latter
value is clearly higher than
of
the reference Crab model used in ISGRI calibration was set to be 2.225 for the
entire ISGRI energy range. In OSA 7.0, following the recommendation of the
INTEGRAL Users Group, it was changed to 2.1 below 100 keV and 2.34 above 100 keV,
to match the SPI Crab spectrum, as provided by the SPI team. However, the latter
value is clearly higher than
![]() inferred from the Crab
spectral analysis with the standard OSA SPI software, provided in its version 7.0
and several earlier releases. The latest INTEGRAL cross-calibration report
(Jourdain et al. 2008) presented a new result for SPI: with the updated spectral
extraction software used by the SPI team, the Crab spectral slope above 100 keV
is now equal to 2.22, i.e. a value fully consistent with the OSA result. One can
thus expect the next OSA releases to provide revised ISGRI response files,
adjusted accordingly. To anticipate this inevitable result, the standard ISGRI
OSA 7.0 ARFs were corrected to match the value 2.22 above 100 keV for the purpose
of the testing described below.
inferred from the Crab
spectral analysis with the standard OSA SPI software, provided in its version 7.0
and several earlier releases. The latest INTEGRAL cross-calibration report
(Jourdain et al. 2008) presented a new result for SPI: with the updated spectral
extraction software used by the SPI team, the Crab spectral slope above 100 keV
is now equal to 2.22, i.e. a value fully consistent with the OSA result. One can
thus expect the next OSA releases to provide revised ISGRI response files,
adjusted accordingly. To anticipate this inevitable result, the standard ISGRI
OSA 7.0 ARFs were corrected to match the value 2.22 above 100 keV for the purpose
of the testing described below.
Calibration tests were made for two sources, Crab and Cen A, the latter to enable checks to be completed for a weaker object and with a different spectral shape. High energy spectra were produced with a large data set to achieve the highest possible precision. For Crab, all data from the standard dithering observations made in Revs. 0239, 0300, 0365, 0422, 0483, 0541, 0605, 0665, and 0666 were used. This choice takes into account the fact that before Rev. 0216 SPI had not yet lost two of its detectors and its response was thus different during earlier observations. In the case of Cen A, it was impossible to obtain acceptable SPI spectra for observations completed between January 2005 and February 2007. Unfortunately, in this period there were strong background variations caused by enhanced Sun activity. PICsIT spectra for that period were also clearly worse than those obtained for earlier observations. The Cen A calibration spectra comprise therefore only data from observations made before 15 February 2004 (up to Rev. 0163), for which the source was detected at energies up to about 460 keV. Calibration tests with ISGRI and SPI spectra of the Crab were limited to the energy band above 100 keV, to decrease the influence of the low energy part on the fit completed for the PICsIT spectral band.
Results of spectral fitting performed with the calibration spectra are presented in Table 4 and illustrated in Figs. 10 and 11. In agreement with the results of tests done with the standard OSA software, the PICSIT calibration appears to be reliable, validating the instrument model included in the Monte Carlo software used for the response simulations. Both the Crab and Cen A spectra measured by three INTEGRAL instruments are fully consistent, producing similar spectral slopes also when fitted separately. The cross-calibration factors measured with respect to SPI obtained for ISGRI and PICsIT are both below 1. The PICsIT cross-calibration factor is poorly constrained for the Cen A spectra, where the SPI and PICsIT useful bandwidths are rather narrow. The relative PICsIT/ISGRI normalization obtained for the Crab of 0.86 is well above the value of 0.52 quoted for PICsIT spectra extracted with the standard OSA software (Foschini et al. 2007). This issue is discussed further in Sect. 6.3.
Table 4:
Cross-calibration between the INTEGRAL high-energy instruments. A
power-law model was fitted to the Crab (three upper rows) and Cen A (three lower
rows) spectra. The best-fit parameters for Crab are: a photon index ![]() of
of
![]() and a normalization at 1 keV of
and a normalization at 1 keV of
![]() photons keV-1 cm-2 s-1 with a reduced
photons keV-1 cm-2 s-1 with a reduced ![]() of 1.71 for 49 degrees of freedom.
The best-fit parameters for Cen A: a photon index
of 1.71 for 49 degrees of freedom.
The best-fit parameters for Cen A: a photon index ![]() of
of
![]() and
a normalization at 1 keV of
and
a normalization at 1 keV of
![]() photons keV-1 cm-2 s-1
with a reduced
photons keV-1 cm-2 s-1
with a reduced ![]() of 1.16 for 61 degrees of freedom. No systematic
errors were added to the statistical ones.
of 1.16 for 61 degrees of freedom. No systematic
errors were added to the statistical ones.
![\begin{figure}
\par\includegraphics[width=8.5cm,clip]{0897fg10.eps}
\end{figure}](/articles/aa/full_html/2009/11/aa10897-08/img49.gif) |
Figure 10: Cross-calibration test completed for the INTEGRAL Crab spectra. ISGRI and SPI spectra were extracted with the standard OSA 7.0 software, and the PICSIT spectrum was extracted with the PPDF method. Results of a power-law fit are given in Table 4. |
| Open with DEXTER | |
![\begin{figure}
\par\includegraphics[width=8.5cm,clip]{0897fg11.eps}
\end{figure}](/articles/aa/full_html/2009/11/aa10897-08/img50.gif) |
Figure 11: Cross-calibration test for the INTEGRAL Cen A spectra. ISGRI and SPI spectra were extracted with the standard OSA 7.0 software, and the PICSIT spectrum was extracted with the PPDF method. Results of a power-law fit are given in Table 4. |
| Open with DEXTER | |
6.2 Other tests
Besides the verification of the PICsIT calibration, other tests were needed to
check the performance of the spectral extraction software related to the
instrument model. One of the main effects to be tested was the dependence of the
results on the off-axis angle at which the source was observed. Many possible
problems can arise from different orientations of the spacecraft with respect to
the object. It is impossible to account for all of them in the instrument model
included in the spectral extraction or in the response-simulation software.
Problems with the off-axis observation results were reported for the standard OSA
software and some corrections to the sky-image deconvolution code were introduced
starting from the OSA 6.0 release (Foschini 2007b). The PIF-based spectral
extraction presented in this paper accounts for some off-axis effects, as already mentioned in Sect. 2. The Crab spectra presented in Fig. 12 show that these corrections are sufficient to ensure stability of the
results. They were extracted for all data taken during and after Rev. 0170, and
for several subsets of those data, selected according to the off-axis angle. Both
large off-axis angle (above 10
![]() )
and small off-axis angle (in the
0.5
)
and small off-axis angle (in the
0.5
![]() range) spectra are fully consistent with the total spectrum.
However, it appears that the spectra produced from the on-axis data (off-axis
angle below
range) spectra are fully consistent with the total spectrum.
However, it appears that the spectra produced from the on-axis data (off-axis
angle below ![]() 0.3
0.3
![]() )
are quite different. They are found to exhibit
strong spectral hardening observed in this case, starting at an energy of
)
are quite different. They are found to exhibit
strong spectral hardening observed in this case, starting at an energy of ![]() 400 keV and resulting in a Crab spectral index
400 keV and resulting in a Crab spectral index ![]() of around 1.4. A similar effect is observed for on-axis spectra extracted with the
standard OSA 7.0 software.
of around 1.4. A similar effect is observed for on-axis spectra extracted with the
standard OSA 7.0 software.
Deeper studies of the on-axis phenomenon indicate that its amplitude in
single-revolution spectra is variable. The hardening is sometimes strong or very
strong, but sometimes it is quite weak or not present at all. In addition, the
hardening appears at different energies for individual spectra. A possible
explanation of at least part of this effect is discussed below, but a full
explanation will need more tests and additional data. For instance, a
micro-dithering observation could be useful. Nevertheless, in practice, sources
other than the Crab are typically observed with the standard
![]() or some
other dithering pattern, and this on-axis effect is not important for them. For
instance, there are only 19 science windows with Cyg X-1 observed at off-axis
angles below 0.3
or some
other dithering pattern, and this on-axis effect is not important for them. For
instance, there are only 19 science windows with Cyg X-1 observed at off-axis
angles below 0.3
![]() ,
among all of the 1726 publicly available pointings for
that source.
,
among all of the 1726 publicly available pointings for
that source.
![\begin{figure}
\par\includegraphics[width=8.5cm,clip]{0897fg12.eps}
\end{figure}](/articles/aa/full_html/2009/11/aa10897-08/img53.gif) |
Figure 12:
Test of the off-axis effect. The plots show the ratio between the data
and a power-law model for Crab observations from Revs. 0170-0636 with different
selections of off-axis angles. Model used for each plot was fitted to the
spectrum made with dithering data. Dithering data comprise all data except
on-axis data (<0.3
|
| Open with DEXTER | |
The correctness of the background model provided by the background map is crucial
for obtaining good PICsIT results. As already mentioned before, such a background
map cannot be prepared with the staring data because the PIF pattern
corresponding to the source emission is then included in the background pattern
and it is not possible to distinguish the signal from the background.
Tests performed with the maps based on the staring data show the Crab and
Cen A spectra with a low intensity, similar to the noise spectra derived for
empty-field observations. This does not mean that the staring data must always be
neglected. Usually only part of the revolution is consumed by these observations
and the background map can be prepared with the rest of the data,
corresponding to the dithering mode. Even when there is no dithering data for a
given revolution, it is still possible to prepare background maps using
data from observations carried out some time before or later. In the case of the
Crab, this solution was tried for Revs. 0039 and 0184. Unfortunately, the change
in the background pattern after passage through the Earth radiation belts appears
to be too large and the staring-data spectra obtained for these two observations
were unsatisfactory. The highest quality spectrum for Rev. 0039 was obtained with
the background map of Rev. 0044, showing a normal Crab spectral shape but with an
about 30% too high normalization. The maps from Revs. 0042, 0043, and 0045
produced lower quality results, of higher flux and a distorted spectral shape at
energies higher than ![]() 500 keV. This test indicates that the observation
closest in time was not necessarily the most suitable for preparing a background
map.
500 keV. This test indicates that the observation
closest in time was not necessarily the most suitable for preparing a background
map.
Other Crab staring data were collected together with the dithering data for the same revolution, allowing us to use the default background map. The spectra extracted for both on-axis and off-axis staring data show, in general, the same type of behaviour: the flux is too high, and the spectrum is distorted and too hard at higher energy. Because the staring observation is sometimes performed in different conditions from the dithering ones, e.g., at the beginning or end of the revolution, the dithering background map does not always model sufficiently well the background for the entire revolution. This can explain partly the observed effect, although an incorrect background map normally produces a spectrum that is consistent with the noise level. Therefore, the higher flux and harder staring spectra, especially those with the source observed on-axis, remain unexplained.
Figure 13 presents yet another spectral test made for Crab. As mentioned
in Sect. 2, the wall transparency of the IBIS telescope allows a
quite large fraction of high-energy photons from the source to reach the detector
when the object is observed at large (>15
![]() )
off-axis angles. If this
effect is modelled by the PIF in its extended version, one can in principle
extract spectra for these observations. However, the quality of the result
depends on the actual observing strategy because the source-PIF patterns for the
science windows used to prepare the background map should be sufficiently
different from each other to allow for disentanglement between the source and
the background. The far off-axis Crab spectrum shown in Fig. 13 proves
that it is possible to obtain a good result, at least in the energy range up to
)
off-axis angles. If this
effect is modelled by the PIF in its extended version, one can in principle
extract spectra for these observations. However, the quality of the result
depends on the actual observing strategy because the source-PIF patterns for the
science windows used to prepare the background map should be sufficiently
different from each other to allow for disentanglement between the source and
the background. The far off-axis Crab spectrum shown in Fig. 13 proves
that it is possible to obtain a good result, at least in the energy range up to
![]() 500 keV, where no more significantr departure from the normal spectrum
is seen. This also indicates that the standard response files can be used in such
a case. Taking into account the fact that for almost all objects observed with
INTEGRAL, there are more pointings with the off-axis angle in the
15
500 keV, where no more significantr departure from the normal spectrum
is seen. This also indicates that the standard response files can be used in such
a case. Taking into account the fact that for almost all objects observed with
INTEGRAL, there are more pointings with the off-axis angle in the
15
![]() range than in the standard dithering
range than in the standard dithering ![]() 15
15
![]() range,
plenty additional data can be used. This technique needs further studies to be
carried out together with the investigation aimed at finding the most reliable
method of verifying the applicability of the background map, mentioned at the end
of Sect. 3.4.
range,
plenty additional data can be used. This technique needs further studies to be
carried out together with the investigation aimed at finding the most reliable
method of verifying the applicability of the background map, mentioned at the end
of Sect. 3.4.
![\begin{figure}
\par\includegraphics[width=8.5cm,clip]{0897fg13.eps}
\end{figure}](/articles/aa/full_html/2009/11/aa10897-08/img56.gif) |
Figure 13: Spectra extracted for very large off-axis pointings with the use of the PIF including the IBIS walls and hopper model. Blue crosses show the total PICsIT Crab spectrum obtained with the standard PIF for the mask-coded part of the shadowgram. Red crosses are the PICsIT Crab spectrum extracted with the extended PIF using the data from the Algol observation in Rev. 0220, when the Crab was 31-39 degrees off-axis. |
| Open with DEXTER | |
6.3 Comparison with the OSA 7.0 results
The spectra extracted using the PPDF method have to be compared with the spectra extracted with the standard PICsIT analysis software distributed within the OSA package. Because the PIF-based spectral extraction software included in OSA 7.0 is still unreliable (Foschini et al. 2007), OSA spectra were prepared from the sky mosaic images. Both methods of creating mosaic images were tested: the first applies the OSA tool ip_skymosaic, the second utilizes the varmosaic tool distributed within the HEASOFT package. The data analysis performed using the OSA followed exactly the instructions given in the document ``PICsIT analysis made easy'' prepared by the IBIS Team (Foschini 2007a). Mosaic images based on the single-event data were created in the 8 default energy bins, corresponding to the channels of the rebinned response matrix pics_srmf_grp_0005.fits. All parameters were set to the default values, except for PICSIT_inCorVar, which was set to 1 to take into account an uncertainty in the background map. Crab spectra were extracted for the same sets of science windows as for the PPDF method, in order to test the software performance in various conditions.
Figure 14 and Table 5 present a comparison of the OSA and PPDF Crab count rates in a broad, low-energy band. For OSA this is the second default channel between 252 and 336 keV, i.e. the lowest energy channel unaffected by the track events. For the PPDF 22-bin spectra, channels 2-5 were merged, giving the count rate in the 255-340 keV band. The Crab light curve extracted with the PPDF method is remarkably stable and the results are much more precise than those obtained with the OSA software. The Crab count rates computed by the PPDF method are almost two times higher than those read from the OSA sky mosaic images. Since there are so many different elements in these two approaches, it is difficult to identify a main reason for such a large count-rate deviation. Possible explanation can be: a difference between the PIF model and IBIS mask model used in the image deconvolution, different background maps, and different approach used to calculate the net source-count rate. Moreover, the fact that the count rates extracted from mosaic images created using ip_skymosaic and varmosaic sometimes differ, shows that the mosaic results can be unstable. Although the PICSIT_inCorVar parameter was set to 1 in the sky image deconvolution, the uncertainty in the count rates extracted from the mosaic produced with the varmosaic tool are clearly too small compared to the scatter of results.
![\begin{figure}
\par\includegraphics[width=8.7cm,clip]{0897fg14.eps}
\end{figure}](/articles/aa/full_html/2009/11/aa10897-08/img57.gif) |
Figure 14: Comparison between the Crab results obtained with the PPDF method and with the standard OSA 7.0 software. The upper part shows the Crab light curve in the 255-340 keV band extracted with the PPDF method. In the lower part, Crab light curves in the 252-336 keV band made with OSA 7.0 are shown. OSA mosaic images were obtained with two alternative methods, one is the standard OSA tool ip_sky_mosaic and the second is the varmosaic tool distributed in the HEASOFT package. Dashed lines show the mean count rate level and dotted lines one standard deviation limits. Points showing the ip_sky_mosaic results are slightly shifted to the right for a better visibility. |
| Open with DEXTER | |
A detailed analysis of the standard OSA 7.0 PICsIT spectra is beyond the scope of this paper. Nevertheless, we completed spectral fitting for about 20 different Crab spectra extracted for different observing conditions, which were fitted separately first and then together, for both mosaicing tools. In addition, the long-exposure spectra from mosaics containing data from many revolutions were prepared to be compared with PPDF spectra extracted for the same data set. The default energy bins defined in the OSA software are too wide to allow a detailed spectral analysis. Therefore, only some basic tests were completed by fitting a power-law model to all 8 bins (203-6720 keV) or to the limited band with channels 1 and 8 excluded. Spectra of shorter exposure times, e.g. those corresponding to a single revolution, were fitted by retaining the relative normalization as a free parameter.
Table 5: Parameters of the Crab light curves obtained with the PPDF and OSA 7.0 (I - ip_skymosaic, V - varmosaic) methods.
In general, the Crab spectral-fitting results were consistent for all three
methods, i.e. the PPDF and both OSA-based mosaics. The relative normalization of
the short-exposure Crab spectra was similar for each method, confirming, for
example, the effect of higher count rates, as measured for on-axis spectra.
However, these numbers and the spectral indexes are affected by significantly
more scatter for the OSA results than for the PPDF results. The most extreme
cases are staring spectra from Rev. 0102, which have a ![]() value of 3.93,
and Rev. 0045 spectra with a
value of 3.93,
and Rev. 0045 spectra with a ![]() of 1.43. Both observations were performed
with a relatively small Sun off-axis angle and may have been affected by a higher
and more variable background than usual. For other spectra,
of 1.43. Both observations were performed
with a relatively small Sun off-axis angle and may have been affected by a higher
and more variable background than usual. For other spectra, ![]() values are
within the range 1.5-3.1 and the relative normalization parameters are within
the range 0.5-1.4. The results of the spectral fitting for all dithering spectra
together are presented in Table 6. All spectra fitted in the 300-1000 keV band had a slightly smaller spectral index than obtained for the SPI spectra.
This suggests that the steepness of the PICsIT ARF was overestimated in this
energy range. Fluxes obtained with the PPDF method are about a factor of two
higher than those of the OSA spectra, in agreement with the result for a narrower
band, presented in Table 5.
values are
within the range 1.5-3.1 and the relative normalization parameters are within
the range 0.5-1.4. The results of the spectral fitting for all dithering spectra
together are presented in Table 6. All spectra fitted in the 300-1000 keV band had a slightly smaller spectral index than obtained for the SPI spectra.
This suggests that the steepness of the PICsIT ARF was overestimated in this
energy range. Fluxes obtained with the PPDF method are about a factor of two
higher than those of the OSA spectra, in agreement with the result for a narrower
band, presented in Table 5.
Table 6: Parameters of the Crab spectral fitting obtained for dithering spectra extracted with the PPDF and OSA 7.0 (I - ip_skymosaic, V - varmosaic) methods. The PPDF spectrum was fitted in the 298-1938 keV range, OSA spectra in the 252-1848 keV range. Flux in the 300-1000 keV band is given in erg cm-2 s-1. Rows 2 and 3 show the OSA results obtained when single revolution spectra were fitted together with a free relative normalization, rows 4 and 5 correspond to the fit made for spectra extracted from all-data mosaics.
PPDF and OSA spectra were also compared for two other sources, and the results
are shown in Figs. 15 and 16. The Cyg X-1 observation
completed in September 2006 (Rev. 0482) was special because the source was then
brighter than the Crab. Unfortunately, this was a routine Galactic Plane Scan
observation and the object was always at least 9
![]() off-axis. Therefore, the
results were not optimal for studies of the physics of this Cyg X-1 brightening
but, on the other hand, provided a good opportunity to test the OSA performance
under special conditions. The model plotted in Fig. 15 is a cut-off
power-law fitted only to the SPI and PICsIT PPDF spectra, in the 100-600 keV
band. Because this observation took place well after the period covered by the
data used to prepare the default OSA PICsIT background maps, a revised map was
prepared for the default OSA energy bins with the data taken from
revolution 0482. However, both types of PICsIT OSA spectra extracted for this
observation, i.e. using either the default or new map, were of quite low quality.
There was no detection (negative count rate) in the first and second band of the
default-map and new-map spectra, respectively. The default-map spectrum exhibited
large deviations from the model, and both of the OSA spectra exhibit high
levels of flux, above that of the PPDF spectrum, whereas the Crab results showed
the opposite trends. Noise-level studies for an observation of similar exposure
time (see Sect. 5) indicated reliable source detection for energies of
up to 600 keV. Thus, the spectral hardening observed in the PPDF spectrum above
that energy was only the noise fluctuation. A detailed analysis and discussion of
the INTEGRAL results for the Cyg X-1 flare observed in September 2006 were
presented in Malzac et al. (2008).
off-axis. Therefore, the
results were not optimal for studies of the physics of this Cyg X-1 brightening
but, on the other hand, provided a good opportunity to test the OSA performance
under special conditions. The model plotted in Fig. 15 is a cut-off
power-law fitted only to the SPI and PICsIT PPDF spectra, in the 100-600 keV
band. Because this observation took place well after the period covered by the
data used to prepare the default OSA PICsIT background maps, a revised map was
prepared for the default OSA energy bins with the data taken from
revolution 0482. However, both types of PICsIT OSA spectra extracted for this
observation, i.e. using either the default or new map, were of quite low quality.
There was no detection (negative count rate) in the first and second band of the
default-map and new-map spectra, respectively. The default-map spectrum exhibited
large deviations from the model, and both of the OSA spectra exhibit high
levels of flux, above that of the PPDF spectrum, whereas the Crab results showed
the opposite trends. Noise-level studies for an observation of similar exposure
time (see Sect. 5) indicated reliable source detection for energies of
up to 600 keV. Thus, the spectral hardening observed in the PPDF spectrum above
that energy was only the noise fluctuation. A detailed analysis and discussion of
the INTEGRAL results for the Cyg X-1 flare observed in September 2006 were
presented in Malzac et al. (2008).
![\begin{figure}
\par\includegraphics[width=8.7cm,clip]{0897fg15.eps}
\end{figure}](/articles/aa/full_html/2009/11/aa10897-08/img63.gif) |
Figure 15: Comparison between the SPI and PICsIT spectra of Cyg X-1 during the September 2006 outburst. The model was fitted to the SPI and PICsIT PPDF spectra in the 100-600 keV band. |
| Open with DEXTER | |
The third object, for which the OSA PICsIT spectra were tested was Cen A, to check whether is was possible to study a source much weaker than Crab or Cyg X-1. The same data as in the case of the calibration studies were used, and the OSA mosaic was made with the varmosaic tool only. The first two channels of the OSA PICsIT spectrum are in agreement with the model, assuming a relative normalization similar to the Crab case. Nevertheless, the OSA spectrum is much less precise than that extracted with the PPDF method and provides no additional information to that derived using the SPI spectrum.
![\begin{figure}
\par\includegraphics[width=8.7cm,clip]{0897fg16.eps}
\end{figure}](/articles/aa/full_html/2009/11/aa10897-08/img64.gif) |
Figure 16: Comparison between the SPI and PICsIT spectra of Cen A observations in 2003-2004. The model was fitted to the SPI and PICsIT PPDF spectra. |
| Open with DEXTER | |
6.4 PICsIT detections
We review PICsIT spectra extracted for objects of various types. Although most of these results are only preliminary and were obtained without a careful analysis and data selection, they illustrate the type of information that PICsIT can provide. The number of objects with relatively strong emission within the PICsIT energy range between several hundreds of keV and several MeV is very small. The dominant class of sources are Galactic binary systems with a black hole candidate. Three other sources detected until now were the Crab and PSR B1509-58 pulsars and a single AGN, Cen A. Several objects were detected only during outbursts of several days or weeks because their persistent emission was too weak for PICsIT. Currently, there are 12 firmly detected sources (with >6-sigma detections in the 277-361 keV band) among about 30 tested.
Figure 17 illustrates the scale of the problem for a detection of
emission in the soft ![]() -ray domain. Cosmic-ray induced internal background
of the detector is usually orders of magnitude higher than the radiation
of the brightest sources. In the case of PICsIT, the background is a factor of
100 stronger than the Crab emission around 300 keV, and 1000 times stronger at
several MeV. Due to the coded-mask technique and dithering observation strategy,
it remains possible to model the background to a precision allowing objects many
times weaker than Crab to be detected, provided that there is sufficient exposure
time. Crab was observed only during one or two revolutions twice a year, and the
total exposure time of about 1 Ms provides a clear detection up to 2 MeV. Cyg X-1
was observed far more frequently but its steeper spectrum allowed us to detect
the source only up to about 700 keV. Because more data will become public from
the INTEGRAL Key Programme observations of the Cygnus region, future analysis
should yield a spectrum reaching at least 1 MeV, according to the noise limits
shown in Fig. 17.
-ray domain. Cosmic-ray induced internal background
of the detector is usually orders of magnitude higher than the radiation
of the brightest sources. In the case of PICsIT, the background is a factor of
100 stronger than the Crab emission around 300 keV, and 1000 times stronger at
several MeV. Due to the coded-mask technique and dithering observation strategy,
it remains possible to model the background to a precision allowing objects many
times weaker than Crab to be detected, provided that there is sufficient exposure
time. Crab was observed only during one or two revolutions twice a year, and the
total exposure time of about 1 Ms provides a clear detection up to 2 MeV. Cyg X-1
was observed far more frequently but its steeper spectrum allowed us to detect
the source only up to about 700 keV. Because more data will become public from
the INTEGRAL Key Programme observations of the Cygnus region, future analysis
should yield a spectrum reaching at least 1 MeV, according to the noise limits
shown in Fig. 17.
![\begin{figure}
\par\includegraphics[width=8.7cm,clip]{0897fg17.eps}
\end{figure}](/articles/aa/full_html/2009/11/aa10897-08/img65.gif) |
Figure 17: PICsIT spectra of the two brightest objects, Crab and Cyg X-1, compared to the PICsIT background spectrum and 3-sigma upper noise limits for 1, 2 and 14 Ms of effective exposure time. |
| Open with DEXTER | |
The spectra of three other persistent sources that can be well studied
with PICsIT are presented in Fig. 18. Due to a long exposure time, the
results obtained for the microquasar GRS 1758-258 were of overhelmingly
higher quality than any obtained for this object with any other, past, or
contemporaneous, instrument. As data continues to arrive in the next few years
for this Galactic Bulge source it will be possible to study the emission
properties up to about 600 keV, with the possibility of subdividing the data
according to the object state. The other bright microquasar,
GRS 1915+105, would need a more sophisticated analysis, but preliminary
results indicate rather unambiguously a harder spectrum in the soft ![]() -ray
band than for GRS 1758-258, and a cut-off at around 500 keV. The third object
with the spectrum shown in Fig. 18, 1E 1740.7-2942, exhibits
weaker emission in the PICsIT energy band, and more data and a more careful
analysis will be needed to obtain a high-quality spectrum. Nevertheless, the
final spectrum should not differ significantly from the current one, showing yet
another emission pattern with a hard spectral slope. The other spectrum of Fig. 18 was extracted for the position of the Galactic Centre radio-source
Sgr A*. Taking into account that no strong hard X-ray emission
originates in this point (ISGRI observations of IGR J17456-2901 reveal
a 7 mCrab source in the 60-150 keV band Kuulkers et al. 2007), it is unsurprising
that the PICsIT spectrum is fully consistent with the noise spectrum. The
expected exposure time of in excess of 20 Ms at the end of the INTEGRAL mission
will allow us to derive the most reliable ever upper limit to the emission from
the centre of our Galaxy. We emphasize that for both 1E 1740.7+2942 and Sgr A*
located in a region of strong diffuse emission observed in the 200-500 keV range
by SPI (Bouchet et al. 2008), PICsIT, due to its high angular resolution, is the only
instrument capable of resolving point sources without the ambiguity affecting SPI
and Suzaku/HXD results.
-ray
band than for GRS 1758-258, and a cut-off at around 500 keV. The third object
with the spectrum shown in Fig. 18, 1E 1740.7-2942, exhibits
weaker emission in the PICsIT energy band, and more data and a more careful
analysis will be needed to obtain a high-quality spectrum. Nevertheless, the
final spectrum should not differ significantly from the current one, showing yet
another emission pattern with a hard spectral slope. The other spectrum of Fig. 18 was extracted for the position of the Galactic Centre radio-source
Sgr A*. Taking into account that no strong hard X-ray emission
originates in this point (ISGRI observations of IGR J17456-2901 reveal
a 7 mCrab source in the 60-150 keV band Kuulkers et al. 2007), it is unsurprising
that the PICsIT spectrum is fully consistent with the noise spectrum. The
expected exposure time of in excess of 20 Ms at the end of the INTEGRAL mission
will allow us to derive the most reliable ever upper limit to the emission from
the centre of our Galaxy. We emphasize that for both 1E 1740.7+2942 and Sgr A*
located in a region of strong diffuse emission observed in the 200-500 keV range
by SPI (Bouchet et al. 2008), PICsIT, due to its high angular resolution, is the only
instrument capable of resolving point sources without the ambiguity affecting SPI
and Suzaku/HXD results.
![\begin{figure}
\par\includegraphics[width=8.7cm,clip]{0897fg18.eps}
\end{figure}](/articles/aa/full_html/2009/11/aa10897-08/img66.gif) |
Figure 18: Examples of PICsIT spectra extracted for several Galactic objects. Spectrum extracted for the position of Sgr A* presents situation, when there is no detection. Spectra in four upper panels are compared with the 3-sigma upper noise limits derived for an effective exposure time of 10 Ms. Spectrum of XTE J1550-564 measured during outburst is compared with the 3-sigma upper noise limits computed for an effective exposure time of 200 ks and the PSR B1509-58 spectrum with the 3-sigma upper noise limits for an effective exposure time of 2 Ms. |
| Open with DEXTER | |
Besides the bright persistent soft ![]() -ray emitters mentioned above, several
objects are too weak to be detected by PICsIT in the normal state but bright
enough during relatively long periods of outbursts. Five sources of this type
have been detected with PICsIT. Figure 18 presents the spectrum of one
of these sources, XTE J1550-564. The other four are black hole
candidates: GRO J1655-40, GX 339-4, IGR J17497-2821,
and SWIFT J1753.5-0127. The last spectrum shown in Fig. 18
illustrates detection of emission from the PSR B1509-58 pulsar system. This
source was detected by PICsIT with the standard OSA software (Kuiper 2005),
although no details were then given.
-ray emitters mentioned above, several
objects are too weak to be detected by PICsIT in the normal state but bright
enough during relatively long periods of outbursts. Five sources of this type
have been detected with PICsIT. Figure 18 presents the spectrum of one
of these sources, XTE J1550-564. The other four are black hole
candidates: GRO J1655-40, GX 339-4, IGR J17497-2821,
and SWIFT J1753.5-0127. The last spectrum shown in Fig. 18
illustrates detection of emission from the PSR B1509-58 pulsar system. This
source was detected by PICsIT with the standard OSA software (Kuiper 2005),
although no details were then given.
6.5 Future prospects
The spectral extraction method presented in this paper provides valuable and reliable results, as shown in the previous subsections. Notwithstanding, possible ways of improving the PICsIT spectra remain, which would increase the sensitivity of the instrument and the stability of the results. The first possibility is application of a spectral extraction also to the multiple events. Although several times fewer photons are registered in multiple than single events below 1 MeV, the instrumental background for multiple events is also several times lower. This can allow the sensitivity to be improved by about 20% above 300 keV. More careful modelling of the background and more careful selection of the data will produce more stable source count-rates, smoother spectra, and more precise light curves. This goal can be achieved by developing tools to verify the adequacy and stability of the background during a single revolution or a sequence of observations. Currently, a simple way of achieving a more accurate background model is to prepare two or three background maps for a given revolution.
Further improvements in sensitivity, of up to a factor 2, can be achieved with the development of an efficient tool to verify the background-map applicability to the data of other revolutions. This would allow us to extract the results for sources observed in staring mode or at very large off-axis angles, when the standard map produced for a given revolution does not allow us to distinguish between the source and the background. In this way, the total exposure time for many objects could be increased by a factor of 2-4, which would be important for extragalatic objects observed rarely with INTEGRAL.
7 Summary and conclusions
We have developed a comprehensive method for extracting PICsIT spectra from spectral-imaging single-event data, which enables us to derive information to the physical limitations of the instrument. This was achieved mainly by application of a correct description of the Poisson-distributed data and careful modelling of the detector background.
We adopted a technique that handles the Poisson probability density functions in
a Bayesian manner for the first time in extracting the count rates from a
![]() -ray detector. The effectiveness of this technique in the ``low number
of counts'' regime and its superiority over other methods was proven with
exhaustive tests.
-ray detector. The effectiveness of this technique in the ``low number
of counts'' regime and its superiority over other methods was proven with
exhaustive tests.
In our spectral extraction technique we employed a background model that was as close as possible to the data because it consisted of a map of the mean count rate measured for each pixel during a given object observation. This approach is justified for a coded-mask instrument operating in a dithering mode, especially when the background is orders of magnitude stronger than the source emission.
The detection reliability was verified by detailed studies of fake source spectra extracted from empty field observations. This approach provided the most reliable estimate of the noise level possible, which accounted for true background fluctuations and other systematic effects related to the instrument and spectral extraction method. We recommend similar tests for other instruments, because the standard analytical calculation of the detection limit can often underestimate the true noise limit.
We tested the performance of the new PICsIT spectral extraction method by comparing our results with those from other INTEGRAL instruments. Using the standard PICsIT response files, we found good agreement between the spectral fitting results for data from PICsIT and both SPI and ISGRI, obtained for the Crab, Cen A, and Cyg X-1. PICsIT appears to be well calibrated, although some tuning of the response files may be needed below 300 keV and above 1 MeV.
Confronted with the standard OSA software results, count rates computed with the new method are far more stable and about a factor of two higher, in close agreement with results derived for data from other INTEGRAL instruments. Crab spectra extracted with both OSA and the new method are described well by a model of the same spectral slope. However, for weaker objects and for observations made at large off-axis angles, we were unable to obtain high quality spectra with the standard software.
The new spectral extraction method was applied to date for about 30 objects observed with INTEGRAL. Eight new sources were added to the four already reported, which were detected with the standard PICsIT software. A refined analysis and an expanding data set should provide at least several detections more. Due to a very long exposure time, the spectrum obtained for the microquasar GRS 1758-258 reached an unprecedented quality and could be extended to higher energies up to about 700 keV. Preliminary spectra extracted for several other sources, in particular those observed during outbursts, also provide information unachievable for any other instrument currently operating.
Despite its unique advantages, PICsIT has a limited sensitivity when compared to
the OSSE or BATSE detectors. The main reason for this is the smaller thickness
of the detector layer, 3 cm for PICsIT, compared to 17.8 cm for OSSE and 7.6 cm
for BATSE. In addition, the PICsIT ability to detect photons is decreased by the
pixellated structure of the detector and the logic discriminating single and
multiple events. Nevertheless, it seems that a coded-mask instrument is the most
appropriate solution for soft ![]() -ray astronomy, because this technique
offers at the same time a large field of view, good angular resolution and direct
measurement of the background when dithering observations are used.
-ray astronomy, because this technique
offers at the same time a large field of view, good angular resolution and direct
measurement of the background when dithering observations are used.
Acknowledgements
This work was supported by the Polish MNiSW grants 1P03D01128 and NN203065933. The author would like to thank Marc Türler for reading the manuscript and valuable comments. The comments by the anonymous referee improved the manuscript substantially.
Appendix A: Tests of spectral extraction methods applied to the ISGRI detector
The main aim of the tests presented here was an examination of the behaviour of
different spectral extraction techniques in a situation when the source emission
is very weak. The standard OSA software for ISGRI spectral extraction is the
PIF-based ii_spectra_extract tool, using the maximum likelihood
technique with Poissonian distribution (Goldwurm et al. 2003). A detailed description
of this technique will be published soon (Goldwurm and Gros, in
preparation). Besides the OSA 7.0 standard method and the PPDF method applied
to the ISGRI spectral extraction, five alternative methods were checked. Two of
them also represent a Bayesian approach with the direct handling of probability
density functions, where the Poisson distribution is replaced by the Gaussian PDF
(hereafter GPDF). The first one holds the Gaussian width parameter ![]() equal
to the square root of the number of counts given by the model, whereas the second
uses instead a
equal
to the square root of the number of counts given by the model, whereas the second
uses instead a ![]() equalling the square root of the simulated number of
counts. As in the case of the PPDF method, the final outcome of these two
techniques is the probability density distribution for the source net count rate.
Then, two standard statistics methods were controlled, where the test
statistic was either a
equalling the square root of the simulated number of
counts. As in the case of the PPDF method, the final outcome of these two
techniques is the probability density distribution for the source net count rate.
Then, two standard statistics methods were controlled, where the test
statistic was either a ![]() (Gaussian likelihood) or C statistic
(Poisson likelihood). For these two techniques the result collected for a single
science window consisted of only two numbers: the source count rate minimizing
the
(Gaussian likelihood) or C statistic
(Poisson likelihood). For these two techniques the result collected for a single
science window consisted of only two numbers: the source count rate minimizing
the ![]() (or C) and its uncertainty corresponding to a change of the
statistic by a certain value. In the case of the
(or C) and its uncertainty corresponding to a change of the
statistic by a certain value. In the case of the ![]() statistic, both
variants of the Gaussian width parameter (from the model or from data) were
checked. When the number of counts simulated for a given pixel was zero, the
``data variant''
statistic, both
variants of the Gaussian width parameter (from the model or from data) were
checked. When the number of counts simulated for a given pixel was zero, the
``data variant'' ![]() was set to be 1.
was set to be 1.
Final results for the methods producing probability density distributions were
computed using the product of all individual PDFs obtained for single science
windows constituting a given data set (simulation run). OSA spectra were summed
with a dedicated tool spe_pick (included in the OSA software). In the case of
methods based on ![]() and C statistic, the results for a single science
window were computed over a grid of the source count rate and background
normalization values. This was more time demanding, but allowed us to avoid
potential problems with the convergence of the fitting procedure when a global
minimum (maximum) is searched for. Uncertainties in a single science window
result were determined by finding the width of the confidence region projected
onto the source count-rate axis, for which the
and C statistic, the results for a single science
window were computed over a grid of the source count rate and background
normalization values. This was more time demanding, but allowed us to avoid
potential problems with the convergence of the fitting procedure when a global
minimum (maximum) is searched for. Uncertainties in a single science window
result were determined by finding the width of the confidence region projected
onto the source count-rate axis, for which the ![]() or C statistic value
changed by 1.0, i.e. 1-sigma confidence level for one interesting parameter
(Cash 1979). Then, the count rates for larger data sets (e.g. one or all
simulation runs) were calculated as a mean weighted by these uncertainties.
This approach is, of course, not justified for the C statistic because the
likelihood obtained for a single science window is still not well approximated by
the Gaussian distribution. In consequence, the standard weighted mean is
inadequate for an asymmetric Poisson distribution characterizing ``low count rate''
data, where the position of the density maximum is usually far from the position
of the mean. Because the maximum likelihood is often peaked at zero and the
lower and upper limits are located at quite different distances from the maximum,
the standard deviation error used for computing the weighted mean was set to the
arithmetic mean of the lower and upper errors.
or C statistic value
changed by 1.0, i.e. 1-sigma confidence level for one interesting parameter
(Cash 1979). Then, the count rates for larger data sets (e.g. one or all
simulation runs) were calculated as a mean weighted by these uncertainties.
This approach is, of course, not justified for the C statistic because the
likelihood obtained for a single science window is still not well approximated by
the Gaussian distribution. In consequence, the standard weighted mean is
inadequate for an asymmetric Poisson distribution characterizing ``low count rate''
data, where the position of the density maximum is usually far from the position
of the mean. Because the maximum likelihood is often peaked at zero and the
lower and upper limits are located at quite different distances from the maximum,
the standard deviation error used for computing the weighted mean was set to the
arithmetic mean of the lower and upper errors.
Table A.1: Initial conditions of tests done with the simulated ISGRI data. The signal to noise ratio, S/N, was calculated for a 1 Ms effective exposure time.
Simulations were performed for the ISGRI detector with the aim of comparing the PPDF method with the standard OSA ISGRI results and because the method presented here was planned to be used with the high-energy ISGRI data. The observations of the Cassiopeia field made in Revs. 0384-0395 served as a simulation template. They included 428 science windows with about 880 ks total exposure time. A fake source of 1 mCrab strength was assumed to be at the Cas A position. The standard OSA 7.0 PIFs computed for Cas A and background maps were used to simulate the shadowgrams in thirteen energy bands listed in Table A.1. The simulated source and background count rates are also presented, together with the signal-to-noise ratios (S/N) for 1 Ms exposure time. The noise was estimated simply to be the ratio of the square root of background counts to the exposure time.
Because the simulated count rates were too low to achieve a 3-sigma detection in the higher energy bands, simulations were repeated 20 times, resulting in 17.6 Ms of total simulated exposure time. In addition, to check the case with conditions more relevant to PICsIT, another set of simulations with the background count rates assumed to be 10 times higher than those of ISGRI was performed.
Figure A.1 presents the main result of the tests. For the standard background level, both PPDF and OSA 7.0 methods reproduce correctly the source count rates with at least a 3-sigma significance for energy bands below 166 keV. The PPDF method performs more reliably, producing results very close to the assumed values in all bands below 40 keV. Above that energy, PPDF count rates are, on average, closer to the true value than the OSA 7.0 count rates. In the case of a test made with a background level higher by a factor of 10, the differences between the PPDF and OSA 7.0 results are small in the 18-55 keV energy range, although, at higher energies the PPDF method appears to estimate the count rate more reliably (note that there is still insufficient data to obtain a detection at higher energy).
![\begin{figure}
\par\includegraphics[width=8.7cm,clip]{0897fg19.eps}
\end{figure}](/articles/aa/full_html/2009/11/aa10897-08/img67.gif) |
Figure A.1: Results of tests (all 20 simulation runs merged together) for the two best spectral extraction methods: the new PPDF technique and the standard ISGRI spectral extraction software released in OSA 7.0. Upper panel: ratios between the extracted and assumed count rates for the normal ISGRI background level. Lower panel: ratios obtained for a background 10 times higher. The energy bands of OSA results are shifted slightly to the left for a better visibility. |
| Open with DEXTER | |
Since alternative methods were not expected to produce good results at low count
rates, their behaviour was tested first for a wider range of simulated count
rates. Figure A.2 shows the results of this test for the second energy
band (17.8-21.6 keV) with the count rates decreasing from 10 to 0.02 cps. The
GPDF and ![]() statistic methods using the model
statistic methods using the model ![]() parameter diverge
from the true result by a factor of 2 or more starting from 0.2 cps, producing
too high count rates. When the data
parameter diverge
from the true result by a factor of 2 or more starting from 0.2 cps, producing
too high count rates. When the data ![]() parameter is used instead in these
two approaches, the reproduced count rates are too small by a factor of
parameter is used instead in these
two approaches, the reproduced count rates are too small by a factor of ![]() 2 already at 0.5 cps. The C statistic performs much better than the methods
based on the Gaussian distribution: deviations from the true value are
observed below 0.5 cps but they remain small (<20%), except for the lowest
tested count rate (0.02 cps). Below 0.05 cps, the count rates reproduced by the
GPDF, the
2 already at 0.5 cps. The C statistic performs much better than the methods
based on the Gaussian distribution: deviations from the true value are
observed below 0.5 cps but they remain small (<20%), except for the lowest
tested count rate (0.02 cps). Below 0.05 cps, the count rates reproduced by the
GPDF, the ![]() statistic (both with the model
statistic (both with the model ![]() )
and the C statistic
all saturate at different levels. We checked with an additional test that these
levels are proportional to the background level: for a 10 times higher background
they are about 3 times higher, in accordance with the expected increase in the
standard deviation, equal to the square root of the total count number.
)
and the C statistic
all saturate at different levels. We checked with an additional test that these
levels are proportional to the background level: for a 10 times higher background
they are about 3 times higher, in accordance with the expected increase in the
standard deviation, equal to the square root of the total count number.
Figure A.3 presents again the comparison between the PPDF and other
methods, this time for all tested energy bands and for the count rates
corresponding to the 1 mCrab source observed with ISGRI. At this count rate
level, only the PPDF technique provides the correct results. The deviations
observed for the other methods are correlated with the increasing background
level (see Table A.1). At low energy (below 20 keV), when the number
of counts simulated for a given pixel is often equal to zero (due to the low
energy thresholds set for the pixels), both methods using the Gaussian
approximation (GPDF and ![]() )
fail completely.
)
fail completely.
![\begin{figure}
\par\includegraphics[width=8.7cm,clip]{0897fg20.eps}
\end{figure}](/articles/aa/full_html/2009/11/aa10897-08/img69.gif) |
Figure A.2: Comparison between the results of the best method (PPDF) and the results obtained with the use of several alternative methods. Tests were done for the 17.8-21.6 keV energy band and the standard ISGRI background. One simulation run (428 science windows) was done for the count rates above 0.2 cps. For 0.2, 0.1, 0.05 and 0.02 cps there were 2, 5, 10 and 10 simulation runs merged together, respectively. |
| Open with DEXTER | |
![\begin{figure}
\par\includegraphics[width=8.7cm,clip]{0897fg21.eps}
\end{figure}](/articles/aa/full_html/2009/11/aa10897-08/img70.gif) |
Figure A.3: Comparison between the results of the best method (PPDF) and the results obtained with the use of several alternative methods. Tests were done for the standard ISGRI background. |
| Open with DEXTER | |
Figure A.4 compares the results of the PPDF and C statistic methods applied to single science windows and merged later in the way described above, and the results obtained when all the data from the entire simulation run (428 science windows) were extracted at once with these methods. Merging the data is possible because simulations are always performed with the same background level assumed and all 428 data sets can be treated as one set, corresponding to the detector with 428 times more pixels. Contrary to the standard procedure, the background normalization was found once for all science windows. For both higher and lower S/N bands (low and high energy, respectively), both PPDF approaches give similar results, completely consistent, on average, with the assumed count rate. Direct application of the PPDF count rate extraction to the data of all science windows at once leads to slightly larger final errors, because of a broader two-dimensional PDF associated with a broader background count rate distribution in a larger simulation set. It seems more reliable to integrate the two-dimensional PDF over the background normalization factor for each science window separately because it allows a more careful control of background fluctuations. Since in a real situation the instrumental background varies quickly, this strategy should be followed and one has to work on possibly short-time data sets before merging the results from a longer observation period.
![\begin{figure}
\par\includegraphics[width=8.7cm,clip]{0897fg22.eps}
\end{figure}](/articles/aa/full_html/2009/11/aa10897-08/img71.gif) |
Figure A.4: Results of two variants of the C statistic method compared to the corresponding results for the PPDF method. The comparison is made for two energy bands representing high (at low energy) and low (at high energy) S/N ratios. In each panel the points shifted to the right illustrate the results of a given method applied to each science window separately and then merged by multiplying all PDFs (PPDF) or by computing the weighted mean (C statistic). Points shifted to the left represent the variant of applying either method to the total data set at once. Open diamonds indicate the position of the maximum of the PPDF distribution. Dashed lines show the count rate assumed in simulations. |
| Open with DEXTER | |
On the other hand, the C statistic technique produces the correct results only when applied to a larger data set. In this case, the maximum likelihood method of course finds a correct position of the PDF maximum, as shown in Fig. A.4, where the PPDF maxima are marked for comparison. Nevertheless, it appears to be rather inefficient for low S/N data, as shown in the lowest panel of Fig. A.4. This is a consequence of using the maximum, which is quite often located far from the gravity centre of the asymmetric Poisson PDF. In principle, when the count rates are not too small, the C statistic applied to all data at once can be used, provided that there is no need to update the result when a new data set arrives. For such an update, the PDF methods storing all distributions derived for single science windows are faster because in this case one has only to extract the PDFs for the new data and then merge them with the older results. Also any change in the data selection, e.g. for the source variability studies, makes the method based on C statistic rather impractical.
Besides the performance tests described already, the two most reliable methods
were in addition checked with respect to the scatter in the results and
the correctness of the derived uncertainties. These tests were done using the
results of 20 simulation runs and merging them in a random way to obtain a new
simulation run, again with 428 science windows. For each new run, each science
window was selected randomly from one of 20 runs, to preserve the original
science-window content of the simulation set. This procedure was repeated 500 times, to calculate ![]() ,
arithmetic mean of the standard deviations
,
arithmetic mean of the standard deviations
![]() ,
and the fraction of results containing the true count-rate value
within the uncertainty limits. The complete results of these tests are listed in
Table A.2, for the first 11 energy bins and for three energy bins
(4, 7, and 10), for the default and 10 times higher background, respectively.
,
and the fraction of results containing the true count-rate value
within the uncertainty limits. The complete results of these tests are listed in
Table A.2, for the first 11 energy bins and for three energy bins
(4, 7, and 10), for the default and 10 times higher background, respectively.
Both methods were examined with the so-called ``frequentist coverage''
test, where the fraction of results covering the true count rate value by error
bars was computed. In case of the PPDF method, there are many ways to determine
the uncertainty, so-called ``credible intervals'' in Bayesian nomenclature, because
the PDF associated with the result is asymmetric. Here, three variants were
tested. The first one was a standard deviation defined as the square root of the
variance determined by integrating
![]() (where s is the source
count rate) weighted by the PDF, i.e. the second central moment of the PDF. The
second variant was the shortest interval containing the desired fraction
of the PDF integral, 68.3% for 1-
(where s is the source
count rate) weighted by the PDF, i.e. the second central moment of the PDF. The
second variant was the shortest interval containing the desired fraction
of the PDF integral, 68.3% for 1-![]() error. The third option was the
central credible interval, found as limits above and below which the PDF
integrals were equal to (1-0.683)/2.
error. The third option was the
central credible interval, found as limits above and below which the PDF
integrals were equal to (1-0.683)/2.
The standard deviation and central credible interval approaches gave almost
identical results and thus only the former is shown in Table A.2. They
tend to overestimate slightly the uncertainty, whereas the shortest interval
approach seems to underestimate the uncertainty. Nevertheless, all of these
variants produce errors that are, in general, in agreement with the 0.683 coverage probability taking into account about 5% deviation expected for 500 simulations performed. The OSA 7.0 uncertainties appear to pass the coverage test
more successfully than those obtained with the PPDF technique. However, this
happens at the cost of much larger error values (measured by
![]() )
and
a larger scatter in the results. Plainly the PPDF method is more precise than the
method implemented in the OSA software.
)
and
a larger scatter in the results. Plainly the PPDF method is more precise than the
method implemented in the OSA software.
Table A.2:
Uncertainty tests done for the OSA 7.0 and PPDF spectral extraction
methods. ![]() is summed over all 500 shots,
is summed over all 500 shots,
![]() is an
arithmetic mean of the standard deviation errors,
is an
arithmetic mean of the standard deviation errors,
![]() is a fraction
of shots covering the true count rate value inside the error limits and
is a fraction
of shots covering the true count rate value inside the error limits and ![]() is a similar fraction of shots computed for the shortest credible interval errors
for the PPDF method. Three rows at the bottom present the results of the same
test made for the background assumed to be 10 times higher than the default one.
is a similar fraction of shots computed for the shortest credible interval errors
for the PPDF method. Three rows at the bottom present the results of the same
test made for the background assumed to be 10 times higher than the default one.
![\begin{figure}
\par\includegraphics[width=8.7cm,clip]{0897fg23.eps}
\end{figure}](/articles/aa/full_html/2009/11/aa10897-08/img74.gif) |
Figure A.5: Results of tests for the two best spectral extraction methods, PPDF and OSA 7.0. Progress in the accuracy of the extracted count rates with the increasing number of simulated science windows is presented for several energy bands. |
| Open with DEXTER | |
Extensive tests performed with simulated data showed that only two count-rate extraction methods work correctly for data of very low signal-to-noise ratio. The method handling the Poisson probability functions can be treated as a reference, because it allows us to obtain the most precise and quickly converging results. The only limitation of this method is a long computation time when many parameters have to be treated at once. However, in the case of high energy astrophysics the number of sources in the field of view is always small and this limitation poses no serious problem. The technique implemented in the OSA software also produces very good results and can be recommended for general use whenever computation speed and robustness is needed. Among the other methods tested, only that based on the C statistic performs relatively well when the signal is not extremely weak. Because it can produce systematically underestimated results, its performance in a given application should be tested with simulated data.
References
- Arnaud, K. A. 1996, in Astronomical Data Analysis Software and Systems V, ed. G. H. Jacoby, & J. Barnes, ASP Conf. Ser., 101, 17 (In the text)
- Attié, D., Cordier, B., Gros, M., et al. 2003, A&A, 411, L71 [NASA ADS] [CrossRef] [EDP Sciences] (In the text)
- Bélanger, G. 2008, IBIS Observer's Manual, http://integral.esac.esa.int/AO6/AO6_IBIS_om.pdf (In the text)
- Bird, A. J., Bazzano, A., Ferguson, C., et al. 2003, A&A, 411, L197 [NASA ADS] [CrossRef] [EDP Sciences] (In the text)
- Bouchet, L., Jourdain, E., Roques, J.-P., et al. 2008, ApJ, 679, 1315 [NASA ADS] [CrossRef] (In the text)
- Cadolle Bel, M., Sizun, P., Goldwurm, A., et al. 2006, A&A, 446, 591 [NASA ADS] [CrossRef] [EDP Sciences] (In the text)
- Cash, W. 1979, ApJ, 228, 939 [NASA ADS] [CrossRef] (In the text)
- Churazov, E., Sunyaev, R., Revnivtsev, M., et al. 2007, A&A, 467, 529 [NASA ADS] [CrossRef] [EDP Sciences] (In the text)
- Courvoisier, T. J.-L., Walter, R., Beckmann, V., et al. 2003, A&A, 411, L53 [NASA ADS] [CrossRef] [EDP Sciences] (In the text)
- Di Cocco, G., Caroli, E., Celesti, E., et al. 2003, A&A, 411, L189 [NASA ADS] [CrossRef] [EDP Sciences] (In the text)
- Foschini, L. 2004, OSA 4.0 Improvements for PICsIT, ISDC Newsletter No. 15, http://isdc.unige.ch/Newsletter/N15 (In the text)
- Foschini, L. 2005, The outburst of XTE J1550-564 in 2003 as seen by IBIS, ISDC Newsletter No. 17, http://isdc.unige.ch/Newsletter/N17 (In the text)
- Foschini, L. 2007a, PICSIT Data Analysis made easy, http://www.iasf-bologna.inaf.it/~foschini/OSAP/picsit_data_analysis.html (In the text)
- Foschini, L. 2007b, IBIS/PICsIT Novelties in OSA 6.0, ISDC Newsletter No. 20, http://isdc.unige.ch/Newsletter/N20 (In the text)
- Foschini, L., Bianchin, V., Goldwurm, A., et al. 2007, IBIS/PICsIT Instrument Specific Software, Scientific Validation Report, http://isdc.unige.ch/Soft/download/osa/osa_doc/prod/osa_sci_val_picsit-6.0.pdf (In the text)
- Frontera, F., Costa, E., dal Fiume, D., et al. 1997, A&AS, 122, 357 [NASA ADS] [CrossRef] [EDP Sciences] (In the text)
- Gehrels, N., Chincarini, G., Giommi, P., et al. 2004, ApJ, 611, 1005 [NASA ADS] [CrossRef] (In the text)
- Goldwurm, A., David, P., Foschini, L., et al. 2003, A&A, 411, L223 [NASA ADS] [CrossRef] [EDP Sciences] (In the text)
- Hubbell, J. H., & Seltzer, S. M. 1996, Tables of X-ray Mass Attenuation coefficients, avalaible at http://physics.nist.gov/PhysRefData/XrayMassCoef/cover.html (In the text)
- Johnson, W. N., Kurfess, J. D., Purcell, W. R., et al. 1993, A&AS, 97, 21 [NASA ADS] (In the text)
- Jourdain, E., Gotz, D., Westergaard, N., Natalucci, L., & Roques, J. 2008 [arXiv:0810.0646v1] (In the text)
- Kuiper, L. 2005, in the IBIS/PICsIT Source Catalog web page, http://www.iasfbo.inaf.it/extras/Research/INTEGRAL/Catalogue/picsit_soucat.html (In the text)
- Kuulkers, E. 2005, http://integral.esa.int/newsletters/ISOC_newsletter_15.pdf (In the text)
- Kuulkers, E. 2006, IBIS Observer's Manual, avalaible at the ESA INTEGRAL documentation web page, http://integral.esa.int/AO4/documentation.html (In the text)
- Kuulkers, E., Shaw, S. E., Paizis, A., et al. 2007, A&A, 466, 595 [NASA ADS] [CrossRef] [EDP Sciences] (In the text)
- Labanti, C., Di Cocco, G., Ferro, G., et al. 2003, A&A, 411, L149 [NASA ADS] [CrossRef] [EDP Sciences] (In the text)
- Lampton, M., Margon, B., & Bowyer, S. 1976, ApJ, 208, 177 [NASA ADS] [CrossRef] (In the text)
- Lebrun, F., Leray, J. P., Lavocat, P., et al. 2003, A&A, 411, L141 [NASA ADS] [CrossRef] [EDP Sciences] (In the text)
- Loredo, T. J. 1990, in Maximum Entropy and Bayesian Methods, ed. P. F. Fougere, 81 (In the text)
- Lubinski, P. 2004, MNRAS, 350, 596 [NASA ADS] [CrossRef] (In the text)
- Lubinski, P. 2007, The new IBIS off-axis correction in OSA 6.0, ISDC Newsletter No. 20, http://isdc.unige.ch/Newsletter/N20 (In the text)
- Makishima, K., Takahashi, H., Yamada, S., et al. 2008, PASJ, 60, 585 [NASA ADS] (In the text)
- Malaguti, G., Bazzano, A., Beckmann, V., et al. 2003a, A&A, 411, L307 [NASA ADS] [CrossRef] [EDP Sciences] (In the text)
- Malaguti, G., Bazzano, A., Bird, A. J., et al. 2003b, A&A, 411, L173 [NASA ADS] [CrossRef] [EDP Sciences] (In the text)
- Malzac, J., Lubinski, P., Zdziarski, A., et al. 2008, A&A, 492, 527 [NASA ADS] [CrossRef] [EDP Sciences] (In the text)
- Marcinkowski, R., Denis, M., Bulik, T., et al. 2006, A&A, 452, 113 [NASA ADS] [CrossRef] [EDP Sciences] (In the text)
- Paul, J., Ballet, J., Cantin, M., et al. 1991, Ad. Space Res., 11, 289 [NASA ADS] [CrossRef] (In the text)
- Roques, J.-P., & Jourdain, E. 2005, How to analyse compact sources with SPI in complex cases, http://sigma-2.cesr.fr/spi/analysis/IUG.pdf (In the text)
- Rothschild, R. E., Blanco, P. R., Gruber, D. E., et al. 1998, ApJ, 496, 538 [NASA ADS] [CrossRef] (In the text)
- Ruiz, J. A., Porras, E., Ferrero, J. L., et al. 1994, ApJS, 92, 683 [NASA ADS] [CrossRef] (In the text)
- Segreto, A., Labanti, C., Bazzano, A., et al. 2003, A&A, 411, L215 [NASA ADS] [CrossRef] [EDP Sciences] (In the text)
- Share, G. H., & Murphy, R. J. 2001, J. Geophys. Res., 106, 77 [NASA ADS] [CrossRef] (In the text)
- Skinner, G. K. 2008, Appl. Opt., 47, 2739 [NASA ADS] [CrossRef] (In the text)
- SpaceWeather.com. 2007, http://www.spaceweather.com/solarflares/topflares.html (In the text)
- Takahashi, T., Abe, K., Endo, M., et al. 2007, PASJ, 59, 35 (In the text)
- Ubertini, P., Lebrun, F., Di Cocco, G., et al. 2003, A&A, 411, L131 [NASA ADS] [CrossRef] [EDP Sciences] (In the text)
- Vedrenne, G., Roques, J.-P., Schönfelder, V., et al. 2003, A&A, 411, L63 [NASA ADS] [CrossRef] [EDP Sciences] (In the text)
- Weidenspointner, G., Kiener, J., Gros, M., et al. 2003, A&A, 411, L113 [NASA ADS] [CrossRef] [EDP Sciences] (In the text)
- Winkler, C. 1994, ApJS, 92, 327 [NASA ADS] [CrossRef] (In the text)
- Winkler, C., Courvoisier, T. J.-L., Di Cocco, G., et al. 2003, A&A, 411, L1 [NASA ADS] [CrossRef] [EDP Sciences] (In the text)
Footnotes
All Tables
Table 1: Strongest PICsIT background lines seen in the spectra collected during non-flaring Sun periods. The most probable line origin is listed first. T1/2 is the half-life decay time of a given isotope. Lines around 670 and 690 keV form the 680 keV complex (see text).
Table 2:
Typical source (![]() )
and background (
)
and background (![]() )
count rates observed
with PICsIT (upper part, Rev. 0301) and ISGRI (lower part, Rev. 0079) for sources
of 50 mCrab and 2 mCrab strength, respectively. Corresponding numbers of counts,
)
count rates observed
with PICsIT (upper part, Rev. 0301) and ISGRI (lower part, Rev. 0079) for sources
of 50 mCrab and 2 mCrab strength, respectively. Corresponding numbers of counts,
![]() and
and ![]() ,
were calculated for science windows with a 2 ks exposure
time. S/N is the signal-to-noise ratio, and
,
were calculated for science windows with a 2 ks exposure
time. S/N is the signal-to-noise ratio, and
![]() is the number of
science windows with the 2 ks exposure time needed to obtain a 3-sigma detection.
is the number of
science windows with the 2 ks exposure time needed to obtain a 3-sigma detection.
Table 3: PICsIT 3-sigma sensitivity limits determined through the extraction of count rates for fake sources in the empty field observations. The last row presents mean fluxes determined for Crab.
Table 4:
Cross-calibration between the INTEGRAL high-energy instruments. A
power-law model was fitted to the Crab (three upper rows) and Cen A (three lower
rows) spectra. The best-fit parameters for Crab are: a photon index ![]() of
of
![]() and a normalization at 1 keV of
and a normalization at 1 keV of
![]() photons keV-1 cm-2 s-1 with a reduced
photons keV-1 cm-2 s-1 with a reduced ![]() of 1.71 for 49 degrees of freedom.
The best-fit parameters for Cen A: a photon index
of 1.71 for 49 degrees of freedom.
The best-fit parameters for Cen A: a photon index ![]() of
of
![]() and
a normalization at 1 keV of
and
a normalization at 1 keV of
![]() photons keV-1 cm-2 s-1
with a reduced
photons keV-1 cm-2 s-1
with a reduced ![]() of 1.16 for 61 degrees of freedom. No systematic
errors were added to the statistical ones.
of 1.16 for 61 degrees of freedom. No systematic
errors were added to the statistical ones.
Table 5: Parameters of the Crab light curves obtained with the PPDF and OSA 7.0 (I - ip_skymosaic, V - varmosaic) methods.
Table 6: Parameters of the Crab spectral fitting obtained for dithering spectra extracted with the PPDF and OSA 7.0 (I - ip_skymosaic, V - varmosaic) methods. The PPDF spectrum was fitted in the 298-1938 keV range, OSA spectra in the 252-1848 keV range. Flux in the 300-1000 keV band is given in erg cm-2 s-1. Rows 2 and 3 show the OSA results obtained when single revolution spectra were fitted together with a free relative normalization, rows 4 and 5 correspond to the fit made for spectra extracted from all-data mosaics.
Table A.1: Initial conditions of tests done with the simulated ISGRI data. The signal to noise ratio, S/N, was calculated for a 1 Ms effective exposure time.
Table A.2:
Uncertainty tests done for the OSA 7.0 and PPDF spectral extraction
methods. ![]() is summed over all 500 shots,
is summed over all 500 shots,
![]() is an
arithmetic mean of the standard deviation errors,
is an
arithmetic mean of the standard deviation errors,
![]() is a fraction
of shots covering the true count rate value inside the error limits and
is a fraction
of shots covering the true count rate value inside the error limits and ![]() is a similar fraction of shots computed for the shortest credible interval errors
for the PPDF method. Three rows at the bottom present the results of the same
test made for the background assumed to be 10 times higher than the default one.
is a similar fraction of shots computed for the shortest credible interval errors
for the PPDF method. Three rows at the bottom present the results of the same
test made for the background assumed to be 10 times higher than the default one.
All Figures
| |
Figure 1:
ISGRI ( left, 50 keV) and PICsIT ( right, 450 keV) PIF models for science
window 007900330010 calculated for Cyg X-1 seen at 3.9
|
| Open with DEXTER | |
| In the text | |
| |
Figure 2:
PICsIT extended PIF model for science window 022000970010 calculated for
Crab seen at 36
|
| Open with DEXTER | |
| In the text | |
| |
Figure 3:
PICsIT background spectra from Revs. 0052, 0130, 0356, and 0541. Data are
divided by the power-law model with a spectral index |
| Open with DEXTER | |
| In the text | |
| |
Figure 4: Variation in the PICsIT background count rate during the mission. Error bars correspond to the standard deviation of the mean for a given revolution and are much larger during solar flaring periods. |
| Open with DEXTER | |
| In the text | |
| |
Figure 5: Total PICsIT count rate measured in eight energy bands during Rev. 0159. IJD is the INTEGRAL Julian Date (IJD = MJD-51 544.0). |
| Open with DEXTER | |
| In the text | |
| |
Figure 6: Distributions of differences between 336-448 keV shadowgram from Rev. 0079 and corresponding shadowgrams from Revs. 0070 to 0078 and 0080 to 0090 (starting from the upper left, row by row). Warmer colours (yellow, red) correspond to the higher count rates. The smallest differences (flattest images) are observed for Revs. 0072, 0075, 0078, 0080 and 0081. There was a small solar flare in Rev. 0076 that changed also the background distribution in the following revolution. |
| Open with DEXTER | |
| In the text | |
| |
Figure 7: Examples of Poisson PDFs obtained for GRS 1758-258 in the 298-319 keV band. Left: broad distributions obtained for several single science windows from Rev. 0105 (dashed lines) and a narrower PDF from all Rev. 0105 data merged (solid line). Right: the same total PDF from Rev. 0105 (dashed line) compared to that of Rev. 0103 (dot-dashed line), and the final result for all data of August-October 2003 period (solid line), with an exposure time of 1.95 Ms. |
| Open with DEXTER | |
| In the text | |
| |
Figure 8: Distributions of mean count rates in the 277-362 keV band extracted for fake sources in empty fields. Upper panel: total exposure time 10 ks, 11 000 tests. Solid, long-dashed and short-dashed lines show the Gaussian, gamma, and exponential models, respectively, fitted to the tail of the distribution, i.e. above the count rate corresponding to a 1-sigma upper limit. Vertical lines indicate the positions of the best-fit 2 and 3-sigma upper limits. Lower panel: total exposure time 1 Ms, 1000 tests. The solid line shows the Gaussian function fitted to the tail of the distribution. Vertical lines present the 1 to 5 sigma upper noise limits computed using the fitted Gaussian tail. Three extremely high-noise distributions for 1 Ms are shown with dotted lines, and two examples of count rate distributions obtained for GRS 1758-258 with a similar observing time are drawn with dashed lines. |
| Open with DEXTER | |
| In the text | |
| |
Figure 9: PICsIT sensitivity limits for a 3-sigma detection for an exposure time of 1 Ms. The thick solid lines show the estimates based on the noise level test for 1 and 10 Ms effective exposure times. Dotted and dash-dotted lines correspond to the OTE tool results for 1 Ms observation with SPI and PICsIT, respectively. The dashed line shows the 1 Ms sensitivity limits for OSSE. Thin lines show the fluxes for 10 mCrab, 100 mCrab and 1 Crab sources with the spectral slope fixed to 2.2. |
| Open with DEXTER | |
| In the text | |
| |
Figure 10: Cross-calibration test completed for the INTEGRAL Crab spectra. ISGRI and SPI spectra were extracted with the standard OSA 7.0 software, and the PICSIT spectrum was extracted with the PPDF method. Results of a power-law fit are given in Table 4. |
| Open with DEXTER | |
| In the text | |
| |
Figure 11: Cross-calibration test for the INTEGRAL Cen A spectra. ISGRI and SPI spectra were extracted with the standard OSA 7.0 software, and the PICSIT spectrum was extracted with the PPDF method. Results of a power-law fit are given in Table 4. |
| Open with DEXTER | |
| In the text | |
| |
Figure 12:
Test of the off-axis effect. The plots show the ratio between the data
and a power-law model for Crab observations from Revs. 0170-0636 with different
selections of off-axis angles. Model used for each plot was fitted to the
spectrum made with dithering data. Dithering data comprise all data except
on-axis data (<0.3
|
| Open with DEXTER | |
| In the text | |
| |
Figure 13: Spectra extracted for very large off-axis pointings with the use of the PIF including the IBIS walls and hopper model. Blue crosses show the total PICsIT Crab spectrum obtained with the standard PIF for the mask-coded part of the shadowgram. Red crosses are the PICsIT Crab spectrum extracted with the extended PIF using the data from the Algol observation in Rev. 0220, when the Crab was 31-39 degrees off-axis. |
| Open with DEXTER | |
| In the text | |
| |
Figure 14: Comparison between the Crab results obtained with the PPDF method and with the standard OSA 7.0 software. The upper part shows the Crab light curve in the 255-340 keV band extracted with the PPDF method. In the lower part, Crab light curves in the 252-336 keV band made with OSA 7.0 are shown. OSA mosaic images were obtained with two alternative methods, one is the standard OSA tool ip_sky_mosaic and the second is the varmosaic tool distributed in the HEASOFT package. Dashed lines show the mean count rate level and dotted lines one standard deviation limits. Points showing the ip_sky_mosaic results are slightly shifted to the right for a better visibility. |
| Open with DEXTER | |
| In the text | |
| |
Figure 15: Comparison between the SPI and PICsIT spectra of Cyg X-1 during the September 2006 outburst. The model was fitted to the SPI and PICsIT PPDF spectra in the 100-600 keV band. |
| Open with DEXTER | |
| In the text | |
| |
Figure 16: Comparison between the SPI and PICsIT spectra of Cen A observations in 2003-2004. The model was fitted to the SPI and PICsIT PPDF spectra. |
| Open with DEXTER | |
| In the text | |
| |
Figure 17: PICsIT spectra of the two brightest objects, Crab and Cyg X-1, compared to the PICsIT background spectrum and 3-sigma upper noise limits for 1, 2 and 14 Ms of effective exposure time. |
| Open with DEXTER | |
| In the text | |
| |
Figure 18: Examples of PICsIT spectra extracted for several Galactic objects. Spectrum extracted for the position of Sgr A* presents situation, when there is no detection. Spectra in four upper panels are compared with the 3-sigma upper noise limits derived for an effective exposure time of 10 Ms. Spectrum of XTE J1550-564 measured during outburst is compared with the 3-sigma upper noise limits computed for an effective exposure time of 200 ks and the PSR B1509-58 spectrum with the 3-sigma upper noise limits for an effective exposure time of 2 Ms. |
| Open with DEXTER | |
| In the text | |
| |
Figure A.1: Results of tests (all 20 simulation runs merged together) for the two best spectral extraction methods: the new PPDF technique and the standard ISGRI spectral extraction software released in OSA 7.0. Upper panel: ratios between the extracted and assumed count rates for the normal ISGRI background level. Lower panel: ratios obtained for a background 10 times higher. The energy bands of OSA results are shifted slightly to the left for a better visibility. |
| Open with DEXTER | |
| In the text | |
| |
Figure A.2: Comparison between the results of the best method (PPDF) and the results obtained with the use of several alternative methods. Tests were done for the 17.8-21.6 keV energy band and the standard ISGRI background. One simulation run (428 science windows) was done for the count rates above 0.2 cps. For 0.2, 0.1, 0.05 and 0.02 cps there were 2, 5, 10 and 10 simulation runs merged together, respectively. |
| Open with DEXTER | |
| In the text | |
| |
Figure A.3: Comparison between the results of the best method (PPDF) and the results obtained with the use of several alternative methods. Tests were done for the standard ISGRI background. |
| Open with DEXTER | |
| In the text | |
| |
Figure A.4: Results of two variants of the C statistic method compared to the corresponding results for the PPDF method. The comparison is made for two energy bands representing high (at low energy) and low (at high energy) S/N ratios. In each panel the points shifted to the right illustrate the results of a given method applied to each science window separately and then merged by multiplying all PDFs (PPDF) or by computing the weighted mean (C statistic). Points shifted to the left represent the variant of applying either method to the total data set at once. Open diamonds indicate the position of the maximum of the PPDF distribution. Dashed lines show the count rate assumed in simulations. |
| Open with DEXTER | |
| In the text | |
| |
Figure A.5: Results of tests for the two best spectral extraction methods, PPDF and OSA 7.0. Progress in the accuracy of the extracted count rates with the increasing number of simulated science windows is presented for several energy bands. |
| Open with DEXTER | |
| In the text | |
Copyright ESO 2009
Current usage metrics show cumulative count of Article Views (full-text article views including HTML views, PDF and ePub downloads, according to the available data) and Abstracts Views on Vision4Press platform.
Data correspond to usage on the plateform after 2015. The current usage metrics is available 48-96 hours after online publication and is updated daily on week days.
Initial download of the metrics may take a while.