| Issue |
A&A
Volume 496, Number 1, March II 2009
|
|
|---|---|---|
| Page(s) | 235 - 247 | |
| Section | Planets and planetary systems | |
| DOI | https://doi.org/10.1051/0004-6361/200811206 | |
| Published online | 30 January 2009 | |
Activity evolution, outbursts, and splitting events of comet 73P/Schwassmann-Wachmann 3
I. Bertini1 - L. M. Lara1 - J.-B. Vincent2 - H. Boehnhardt2 - M. Küppers3 - R. Rodrigo1
1 - Instituto de Astrofísica de Andalucía, CSIC, Camino Bajo de Huétor 50, 18008 Granada, Spain
2 -
Max-Planck-Institut für Sonnensystemforschung, Max-Planck-Strasse 2, 37191 Katlenburg-Lindau, Germany
3 -
European Space Astronomy Center (ESAC), PO Box 78,
28691 Villanueva de la Cañada - Madrid, Spain
Received 22 October 2008 / Accepted 19 November 2008
Abstract
Context. The split Jupiter family comet 73P/Schwassmann-Wachmann 3 was monitored between January 21 and May 25 2006, for 24 nights.
Aims. The goals of the campaign were to characterize the two principal comet components (C and B) and the smaller component G during their approach to perihelion, and study differences and commonalities in their evolution to obtain insight into the nature of the nuclei (gas and dust). We aimed to assess the chemical homogeneity/heterogeneity of the different components, the presence of jets and other coma structures, the rotation axis, the long-term activity evolution, and the detection of new fragmentation events.
Methods. Long-slit spectra and optical broadband images were acquired using the CAFOS instrument at the 2.2-m telescope at Calar Alto Observatory (CSIC-MPG). Data obtained in service mode consisted of spectra and Johnson R filter images. By observing for four nights close to perigee, the comet could be imaged in the Johnson UBVRI filters. When possible, we analyzed the radial profile of the dust brightness and we derived the dust and gas production rates, the dust reddening, and the N-S profiles of the CN, C2, and C3 column densities. The analysis of the morphological evolution of coma structures and the determination of the rotation axis is performed in a separate paper.
Results. We found that components C and B behave differently during most of our observations. While component C did not show any sudden increase in dust productivity, as measured by Af![]() ,
component B was characterized by a higher activity variation, exhibiting two outburst peaks and fragmentation events. Excluding outburst dates, component B always had lower dust productivity than component C. We also found differences in the behavior of the dust brightness radial profiles and in the dust colors. Differences in the dust colors are found also with respect to component G. In the spectral analysis, we found that both C and B components seem to be carbon-chain depleted, their compositions being almost the same. This indicates that the pre-split original intact nucleus probably had a homogenous composition. A two-dimensional color map of component B on May 13 shows relative color variations in the inner coma that can be interpreted qualitatively in terms of Mie theory as fragmentation of silicate dust particles emanating from the nucleus.
,
component B was characterized by a higher activity variation, exhibiting two outburst peaks and fragmentation events. Excluding outburst dates, component B always had lower dust productivity than component C. We also found differences in the behavior of the dust brightness radial profiles and in the dust colors. Differences in the dust colors are found also with respect to component G. In the spectral analysis, we found that both C and B components seem to be carbon-chain depleted, their compositions being almost the same. This indicates that the pre-split original intact nucleus probably had a homogenous composition. A two-dimensional color map of component B on May 13 shows relative color variations in the inner coma that can be interpreted qualitatively in terms of Mie theory as fragmentation of silicate dust particles emanating from the nucleus.
Key words: comets: individual: 73P/Schwassmann-Wachmann 3
1 Introduction
Comet 73P/Schwassmann-Wachmann 3 (hereafter 73P) is a Jupiter family (JF) comet with an orbital period of 5.34 years. It broke up into at least three pieces, or components, during its perihelion passage in Autumn 1995 (Boehnhardt et al. 1995). The nucleus radius was measured to be 1.2 km before break-up (Boehnhardt et al. 1999). Component C was found to represent the main fragment (Scotti et al. 1996). Components C and B were observed several years after the splitting event, including during the 2001 perihelion passage: there are ground-based observations of both components (Kadota et al. 2000) and Hubble Space Telescope observations of component C (Toth et al. 2005). In May 2006, 73P passed close to Earth, reaching a minimum geocentric distance of 0.079 AU (May 12) and 0.067 AU (May 14), for component C and B, respectively, close to its perihelion in early June 2006. This close approach gave us the opportunity to investigate with high spatial resolution and high signal-to-noise data the behavior of the split comet.
We monitored 73P between January 21 and May 25, 2006, during perihelion approach. The goal of this campaign was to characterize the two main components, C and B, and assess the chemical homogeneity/heterogeneity (gas and dust), the presence of jets and other coma structures, the rotation axis, the long-term activity evolution, and the detection of new fragmentation events. During a few nights, we also acquired data for the smaller component G.
Optical broadband images and long-slit spectra were acquired with the CAFOS instrument mounted at the 2.2 m telescope at the Calar Alto Observatory (CSIC-MPG) in Almería (Spain). In this paper,
we present for each of the principal components, C and B, our results about the evolution in the dust production rate (by means of the Af![]() parameter), the dust reddening, the radial profiles of the dust coma azimuthally averaged, and the gas production rates whenever they could be measured, while for the smaller component G, we derived the dust reddening and gas production rate from the spectral analysis. Differences and commonalities in the evolution, behavior, and nature of the C and B components are described. A detailed analysis of the morphological evolution of the dust
structures in the coma of 73P components (including the presence of jets, fragmentation, and outburst events) and the determination of the rotation axis is performed in a separate paper
(Vincent et al. 2009).
parameter), the dust reddening, the radial profiles of the dust coma azimuthally averaged, and the gas production rates whenever they could be measured, while for the smaller component G, we derived the dust reddening and gas production rate from the spectral analysis. Differences and commonalities in the evolution, behavior, and nature of the C and B components are described. A detailed analysis of the morphological evolution of the dust
structures in the coma of 73P components (including the presence of jets, fragmentation, and outburst events) and the determination of the rotation axis is performed in a separate paper
(Vincent et al. 2009).
2 Observations and data reduction
The comet was monitored from the Calar Alto Observatory (CSIC-MPG, near Almería, Spain) between January 21 and May 25, 2006, for a total of 24 observing nights, in which broad-band and narrow-band images, and spectroscopic measurements were acquired.
Spectroscopy:
the spectroscopic measurements of the 73P components, C, B, and G, were originally supposed to be completed once every 2 weeks, if photometric conditions prevailed during the night. During the entire monitoring, there were only a few photometric and partially photometric nights in which spectra were acquired. These dates were March 4, April 26, and 29, and May 2. We used CAFOS with grism B400For absolute calibration, observations of appropriate spectrophotometric standard stars were acquired. All comet observations were completed with telescope tracking at the comet's proper motion. During the 4-night run close to perigee in May (11-14), it was impossible to acquire any spectra because the comet moved too rapidly across the sky and, consequently, the optocenter slowly drifted outside the field of view of the slit. Details of the spectroscopic data reduction and calibration can be found in Lara et al. (2004b,a,2001) and are not repeated here. Since the gas emission of 73P does not cover the entire length of the slit, apart from CN on the spectra obtained in May 2, it is possible to measure the sky contamination by extracting spectra directly from the edges of the frame.
Imaging:
imaging data were acquired by the central 1k
![\begin{figure}
\par\includegraphics[width=8cm,clip]{1206fig1.eps}
\end{figure}](/articles/aa/full_html/2009/10/aa11206-08/img24.gif) |
Figure 1:
Flux calibrated image of the B component on May 2 acquired with R Johnson filter. The look-up table is linear with cuts 0 and 8 |
| Open with DEXTER | |
![\begin{figure}
\par\includegraphics[height=5.4cm,width=5.5cm,clip]{1206f2a.ps}\h...
...0.3cm}
\includegraphics[height=5.4cm,width=5.5cm,clip]{1206f2c.ps}
\end{figure}](/articles/aa/full_html/2009/10/aa11206-08/img25.gif) |
Figure 2: Wavelength-averaged spectra of the C, B, and G components for March 4, May 2, and April 29, respectively. Optocenters are placed at pixel number 0. Other peaks relate to stars falling into the slit width. Note that for the C component a well defined peak is clearly visible, for the B component both peaks are well defined as the slit covers the gas emission and continuum from the main component and a fragment, and for the G component a wider peak is seen. Positive x-axis refers to the South direction, whereas negative x-axis is the North direction. |
| Open with DEXTER | |
For most of the non-photometric nights (see Tables 1 and 2), data were cross-calibrated by comparing images of the same fields of view containing the comet with images taken at the same airmass in a photometric night on June 26, 2006. This allowed us to derive the correction factors for the non-photometric nights and achieve absolute flux calibration. Series of calibrated images from the same night were median-combined to increase the signal-to-noise ratio and reduce as much as possible the flux of background stars.
The geometric and photometric data of component C, B, and G are listed in Tables 1-3, respectively.
Table 1: Component C: observations log and results in the broadband red filter.
Table 2: Component B: observations log and results in the broadband red filter.
Table 3: Component G: observations log.
3 Data analysis and results
In this section we present the analysis of our data, and the results we obtained for the dust and gas of comet 73P.
3.1 Dust
The properties of dust in 73P were investigated by measuring the dust production rate (by means of the Af![]() parameter), the radial profiles of the dust coma azimuthally averaged, and the dust color.
parameter), the radial profiles of the dust coma azimuthally averaged, and the dust color.
3.1.1 Af
The release of dust from the comet was measured with optical measurements of the parameter Af![]() as a function of the projected cometocentric distance
as a function of the projected cometocentric distance ![]() ,
measured in cm (A'Hearn et al. 1984):
,
measured in cm (A'Hearn et al. 1984):
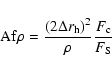
where
![\begin{figure}
\par\includegraphics[width=7.8cm,clip]{1206fig3.ps}
\par\end{figure}](/articles/aa/full_html/2009/10/aa11206-08/img33.gif) |
Figure 3:
Correction factor curves,
|
| Open with DEXTER | |
Equation (1) does not properly take into account the dependence of the scattering efficiency of the dust grains on the phase angle ![]() (the so-called phase effect). Our measured
Af
(the so-called phase effect). Our measured
Af![]() data are certainly affected by phase changes because the comet was observed at phase angles between
data are certainly affected by phase changes because the comet was observed at phase angles between
![]() and
and
![]() (component C), and between
(component C), and between
![]() and
and
![]() (component B). To properly compare all the data and separate phase effects from those of temporal changes in the comet's activity, we tried to retrieve the phase angle dependency from our measurements. Observations suggest that a typical cometary dust phase function averaged over the entire coma,
(component B). To properly compare all the data and separate phase effects from those of temporal changes in the comet's activity, we tried to retrieve the phase angle dependency from our measurements. Observations suggest that a typical cometary dust phase function averaged over the entire coma,
![]() ,
possesses a distinct forward scattering surge, a quite gentle backscattering peak, and a flat shape at medium phase angles (Kolokolova et al. 2004).
,
possesses a distinct forward scattering surge, a quite gentle backscattering peak, and a flat shape at medium phase angles (Kolokolova et al. 2004).
![]() depends on the nature (i.e. morphology, composition, and particle size) of the scattering dust, and its size distribution. In our calculations we used a theoretical model of cometary dust described by Bertini et al. (2007). We considered the average scattering behavior of the entire coma, without taking into account eventual dust-parameter variations as a function of distance from the nucleus. The dust model considers irregular particles, modeled as fractal aggregates of spherical constituents (or monomers). Since compact particles comparable in size with the incident wavelength
provide the most accurate description of the observed dust-scattering properties (Bertini et al. 2007), we used compact Ballistic Particle-Cluster Aggregates (BPCA), characterized by a fractal mass dimension (exponent of the relationship between the mass and the size of the aggregate, describing the morphology of the aggregate)
depends on the nature (i.e. morphology, composition, and particle size) of the scattering dust, and its size distribution. In our calculations we used a theoretical model of cometary dust described by Bertini et al. (2007). We considered the average scattering behavior of the entire coma, without taking into account eventual dust-parameter variations as a function of distance from the nucleus. The dust model considers irregular particles, modeled as fractal aggregates of spherical constituents (or monomers). Since compact particles comparable in size with the incident wavelength
provide the most accurate description of the observed dust-scattering properties (Bertini et al. 2007), we used compact Ballistic Particle-Cluster Aggregates (BPCA), characterized by a fractal mass dimension (exponent of the relationship between the mass and the size of the aggregate, describing the morphology of the aggregate)
![]() ,
a size parameter X (the size of the aggregate divided by the incident wavelength and multiplied by the factor 2
,
a size parameter X (the size of the aggregate divided by the incident wavelength and multiplied by the factor 2![]() )
up to
)
up to ![]() 8, and a monomer radius of 0.15
8, and a monomer radius of 0.15 ![]() m. For the grain-size distribution, we used a power-law relationship,
m. For the grain-size distribution, we used a power-law relationship,
![]() ,
with exponent a=2.6, obtained from a reanalysis of the 1P/Halley Giotto data by Fulle et al. (2000). An exponent of
,
with exponent a=2.6, obtained from a reanalysis of the 1P/Halley Giotto data by Fulle et al. (2000). An exponent of ![]() 3 was also found by using inverse modeling of the dust tails
of comet Hyakutake 1996 B2 (Fulle et al. 1997), JF comets 46P/Wirtanen and 103P/Hartley 2 (Epifani et al. 2001; Fulle 2000), and comet 2P/Encke (Epifani et al. 2001), and in the ejecta dust cloud caused by the Deep Impact experiment on the JF comet 9P/Tempel 1 (Keller et al. 2007). Since the composition influences the final shape of the phase function, we corrected the observed flux
according to three possible compositions: pure silicates made by four components (amorphous and crystalline pyroxene, and amorphous and crystalline olivine), pure organic refractories, and a 1:1 in mass mixture of organics and silicates. These three compositions were found to be present in the dust of comet 1P/Halley from the analysis of in-situ data (Jessberger 1999). The laboratory analysis of the cometary samples obtained by the Stardust mission also revealed that comet 81P/Wild 2 dust consists of a mixture of minerals, mainly silicates and organics (Brownlee et al. 2006), confirming that these materials are present in cometary dust. For comet 73P, infrared spectroscopic observations showed the presence of strong silicate emission bands in the spectra of both components C and B (Russell et al. 2006; Sitko et al. 2006; Harker et al. 2006). For a detailed description of the compositions used in our study, including bulk densities and refractive indices of the dust
particles, the reader is referred to Bertini et al. (2007). Using the Discrete-Dipole Approximation (DDA) scattering method and the public code DDSCAT.5a10 by Draine & Flatau (2000), theoretical phase functions,
3 was also found by using inverse modeling of the dust tails
of comet Hyakutake 1996 B2 (Fulle et al. 1997), JF comets 46P/Wirtanen and 103P/Hartley 2 (Epifani et al. 2001; Fulle 2000), and comet 2P/Encke (Epifani et al. 2001), and in the ejecta dust cloud caused by the Deep Impact experiment on the JF comet 9P/Tempel 1 (Keller et al. 2007). Since the composition influences the final shape of the phase function, we corrected the observed flux
according to three possible compositions: pure silicates made by four components (amorphous and crystalline pyroxene, and amorphous and crystalline olivine), pure organic refractories, and a 1:1 in mass mixture of organics and silicates. These three compositions were found to be present in the dust of comet 1P/Halley from the analysis of in-situ data (Jessberger 1999). The laboratory analysis of the cometary samples obtained by the Stardust mission also revealed that comet 81P/Wild 2 dust consists of a mixture of minerals, mainly silicates and organics (Brownlee et al. 2006), confirming that these materials are present in cometary dust. For comet 73P, infrared spectroscopic observations showed the presence of strong silicate emission bands in the spectra of both components C and B (Russell et al. 2006; Sitko et al. 2006; Harker et al. 2006). For a detailed description of the compositions used in our study, including bulk densities and refractive indices of the dust
particles, the reader is referred to Bertini et al. (2007). Using the Discrete-Dipole Approximation (DDA) scattering method and the public code DDSCAT.5a10 by Draine & Flatau (2000), theoretical phase functions,
![]() ,
were derived for every composition considered. By using
these curves, we were able to calculate the correction factors,
,
were derived for every composition considered. By using
these curves, we were able to calculate the correction factors,
![]() ,
and derive the value Af
,
and derive the value Af![]() at phase angle 0, Af
at phase angle 0, Af![]() (0). In Fig. 3, we show the correction factors calculated with the cometary dust model described in Bertini et al. (2007). The vertical lines in the figure indicate the interval in phase angle of our observations of components C and B. The effects of reducing Af
(0). In Fig. 3, we show the correction factors calculated with the cometary dust model described in Bertini et al. (2007). The vertical lines in the figure indicate the interval in phase angle of our observations of components C and B. The effects of reducing Af
![]() to the value corresponding to a phase angle zero are:
to the value corresponding to a phase angle zero are:
- a modest increase (
 = [1-1.6]) in the measured Af
 values at phase angles lower than
 ,
if a pure silicate composition for the dust is taken into account, or lower than
,
if a pure silicate composition for the dust is taken into account, or lower than
 ,
if we consider pure organics and mixed silicates and organics;
,
if we consider pure organics and mixed silicates and organics;
- almost no variation around either
 (pure silicates) or
 (pure organics and mixed silicates and organics);
- a decrease in the measured Af
values for
 (pure silicates) or
 (pure organics and mixed silicates and organics).
In the following part, we describe the general trends observed in the Af![]() parameter versus
parameter versus ![]() for the two components C and B.
for the two components C and B.
![\begin{figure}
\par\includegraphics[width=7cm,clip]{1206f4a.ps}\hspace*{0.7cm}
\...
...ps}\hspace*{0.7cm}
\includegraphics[width=7cm,clip]{1206f4d.ps}
\par\end{figure}](/articles/aa/full_html/2009/10/aa11206-08/img50.gif) |
Figure 4:
Af |
| Open with DEXTER | |
![\begin{figure}
\par\includegraphics[width=7cm,clip]{1206f5a.ps}\hspace*{0.7cm}
\...
...ps}\hspace*{0.7cm}
\includegraphics[width=7cm,clip]{1206f5d.ps}
\par\end{figure}](/articles/aa/full_html/2009/10/aa11206-08/img51.gif) |
Figure 5:
Af |
| Open with DEXTER | |
Component C:
by analyzing Af
Once the cometary dust model is applied and Af![]() is reduced to phase angle zero, we can calculate the exponent a for the assumed dust compositions when
is reduced to phase angle zero, we can calculate the exponent a for the assumed dust compositions when
![]() .
The a values for Af
.
The a values for Af![]() and the three dust compositions and photometric apertures used are shown in Table 4. The maximum difference between a values obtained with Af
and the three dust compositions and photometric apertures used are shown in Table 4. The maximum difference between a values obtained with Af
![]() and Af
and Af![]() ,
is around 2% and occurs when a pure silicate composition is considered. Mixed silicates and organics, and pure organic compositions provide differences of
,
is around 2% and occurs when a pure silicate composition is considered. Mixed silicates and organics, and pure organic compositions provide differences of ![]() 1%. These small differences are expected since the interval in phase angle of the
points used in the calculation of a is small (
1%. These small differences are expected since the interval in phase angle of the
points used in the calculation of a is small (
![]() )
and the correction factor
)
and the correction factor
![]() is almost the same at every point, once the composition of the dust has been fixed. This implies that the log-log fit of Af
is almost the same at every point, once the composition of the dust has been fixed. This implies that the log-log fit of Af![]() versus
versus
![]() changes its slope (i.e. the a exponent) only by a small percentage.
changes its slope (i.e. the a exponent) only by a small percentage.
Component B:
the strong variation in the activity of component B compared to the component C is clearly reflected in the measured Af
The general described behavior of Af![]() versus
versus ![]() remains unaltered if we consider the phase effect corrected Af
remains unaltered if we consider the phase effect corrected Af![]() values. The values of the a exponent obtained using Af
values. The values of the a exponent obtained using Af![]() are listed in Table 4. The maximum discrepancy with a derived from measured Af
are listed in Table 4. The maximum discrepancy with a derived from measured Af
![]() values is as high as 27% for a mixed silicate and organic dust composition. Pure
silicates and organics provide differences of 3% and 16%, respectively. These differences are due to variations in the correction factor
values is as high as 27% for a mixed silicate and organic dust composition. Pure
silicates and organics provide differences of 3% and 16%, respectively. These differences are due to variations in the correction factor
![]() for phase angles
corresponding to the observations in March (three data points) and during the period April 26-May 2 (two data points). These variations had different magnitudes for each of the three different dust compositions used.
for phase angles
corresponding to the observations in March (three data points) and during the period April 26-May 2 (two data points). These variations had different magnitudes for each of the three different dust compositions used.
3.1.2 Spatial profiles
By making use of the broadband images in R, the azimuthally averaged profiles of the continuum intensity of the comet's components, B, versus ![]() can be described by a straight line if expressed in a log-log representation. We performed these least-square fits by discarding the
first three pixels around the comet optocenter to obtain a lower limit to
can be described by a straight line if expressed in a log-log representation. We performed these least-square fits by discarding the
first three pixels around the comet optocenter to obtain a lower limit to ![]() .
This corresponds to discarding an area of about the twice the size of the mean seeing disk in our observations (seeing
.
This corresponds to discarding an area of about the twice the size of the mean seeing disk in our observations (seeing ![]() 1.6
1.6
![]() ). The upper limits were determined by the maximum coma extension
visible in the different images. In the case of saturated images, the saturated inner part (5 pixels radius in the worst case) close to the comet's optocenter was discarded. The values of the slopes
of these fits, m, are listed in Tables 1 (component C) and 2 (component B). The determination of m was characterized by rms errors that were always lower than 1%.
). The upper limits were determined by the maximum coma extension
visible in the different images. In the case of saturated images, the saturated inner part (5 pixels radius in the worst case) close to the comet's optocenter was discarded. The values of the slopes
of these fits, m, are listed in Tables 1 (component C) and 2 (component B). The determination of m was characterized by rms errors that were always lower than 1%.
Table 4:
Exponent a, together with its rms error, ![]() ,
of
the relation Af
,
of
the relation Af
![]() for components C and B.
for components C and B.
| |
Figure 6:
Values of the |
| Open with DEXTER | |
![\begin{figure}
\par\includegraphics[width=7cm,clip]{1206f7a.ps}\hspace*{0.8cm}
\includegraphics[width=7cm,clip]{1206f7b.ps}
\par\end{figure}](/articles/aa/full_html/2009/10/aa11206-08/img70.gif) |
Figure 7:
Observed (crosses) and best linear fits (solid lines) of the dust brightness profiles |
| Open with DEXTER | |
Component C:
the gradient m of the relation between the dust coma intensity and the heliocentric distance, is plotted in Fig. 6a. The log B versus log
![\begin{figure}
\par\includegraphics[width=5cm,clip]{1206f8a.ps}\hspace*{0.6cm}
\...
....ps}\hspace*{0.6cm}
\includegraphics[width=5.2cm,clip]{1206f8c.ps}
\end{figure}](/articles/aa/full_html/2009/10/aa11206-08/img72.gif) |
Figure 8:
Observed (crosses) and best linear fits (solid lines) of the dust brightness profiles |
| Open with DEXTER | |
Component B:
the plot of m versus
3.1.3 Dust colors
The long-slit spectra of the comet were used to measure the dust reddening as a function of projected cometocentric distance, ![]() ,
along the N-S direction as the slit was oriented. We selected two continuum regions, which were known to be free of gas emission and relatively well separated in wavelength, i.e. 439-450 nm and 638-645 nm.
,
along the N-S direction as the slit was oriented. We selected two continuum regions, which were known to be free of gas emission and relatively well separated in wavelength, i.e. 439-450 nm and 638-645 nm.
Often referred to as the dust color or reddening, the normalized color,
![]() ,
measured in %/100 nm, was calculated with the formula:
,
measured in %/100 nm, was calculated with the formula:
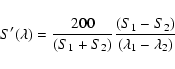
where S is the cometary flux measured in the continuum regions divided by the solar flux in the same spectral region, and indices 1 and 2 refer to the long (central wavelength in the 638-645 nm range) and short (central wavelength in the 439-450 nm range) wavelength, respectively.
It was possible to derive the dust color in N-S direction for various values of ![]() (see Table 5) in the C component on March 4, the B component on April 26 and May 2, and the G component on April 29. The results are shown in Fig. 9 and in Table 5. We note that for component C,
(see Table 5) in the C component on March 4, the B component on April 26 and May 2, and the G component on April 29. The results are shown in Fig. 9 and in Table 5. We note that for component C, ![]() %/100 nm in the N-S direction, whereas the component B clearly shows noticeable variations in S' in both directions. Interpretation of the features visible in Fig. 9 on April 26 and May 2 for the B component is rather complex because small pieces were detected in the coma of the
comet (see Fig. 10). Although these pieces were not aligned exactly in the N-S direction, the dust emitted by these pieces contributed to the reddening slope measurements derived from data acquired through the slit. Whereas on April 26, the dust color was bluer at
%/100 nm in the N-S direction, whereas the component B clearly shows noticeable variations in S' in both directions. Interpretation of the features visible in Fig. 9 on April 26 and May 2 for the B component is rather complex because small pieces were detected in the coma of the
comet (see Fig. 10). Although these pieces were not aligned exactly in the N-S direction, the dust emitted by these pieces contributed to the reddening slope measurements derived from data acquired through the slit. Whereas on April 26, the dust color was bluer at
![]() km in the south direction, on May 2 this situation had been reversed. Bearing in mind that the explanation of these features is complex, it is clearly evident in Fig. 10 that the morphology of the dust coma of the B component differs significantly for these two days: on
April 26, the remains of a fragmentation event might have given rise to an overpopulation of ``blue'' dust in the south direction, whereas on May 2 this dust had been already pushed away into the tail by solar-radiation pressure to produce a ``normal'' dust reddening of
km in the south direction, on May 2 this situation had been reversed. Bearing in mind that the explanation of these features is complex, it is clearly evident in Fig. 10 that the morphology of the dust coma of the B component differs significantly for these two days: on
April 26, the remains of a fragmentation event might have given rise to an overpopulation of ``blue'' dust in the south direction, whereas on May 2 this dust had been already pushed away into the tail by solar-radiation pressure to produce a ``normal'' dust reddening of ![]() 20%/nm.
20%/nm.
Data, and thus results, for component G are of lower quality in terms of S/N. By averaging the reddening at
![]() km, mean values of 11.2
km, mean values of 11.2 ![]() 2.3%/100 nm in the south direction and 14.5
2.3%/100 nm in the south direction and 14.5 ![]() 3.5%/100 nm in the north direction were found.
3.5%/100 nm in the north direction were found.
![\begin{figure}
\par\includegraphics[angle=270,width=8cm,clip]{1206fig9.ps}
\end{figure}](/articles/aa/full_html/2009/10/aa11206-08/img79.gif) |
Figure 9:
Reddening,
|
| Open with DEXTER | |
Table 5:
Normalized color of dust,
![]() ,
in components C, B
and G as acquired from the spectroscopic measurements in N-S direction.
,
in components C, B
and G as acquired from the spectroscopic measurements in N-S direction.
![\begin{figure}
\par\includegraphics[width=8.8cm,clip]{1206fig10.eps}
\end{figure}](/articles/aa/full_html/2009/10/aa11206-08/img88.gif) |
Figure 10:
Images of comet 73P-B, enhanced by Laplace filtering, on April 26 and May 2 showing the presence of several fragments. The orientation is given in the figure. The field of view for every image is 136
|
| Open with DEXTER | |
During four nights close to perigee (the night between May 10 and 11, and the nights of May 12-14), we also acquired broadband Johnson UBVRI images of components C and B. Since the light received in the R and I filters is due mainly to sunlight scattered by the cometary dust (with small contributions from gas emission), we used the images in these two filters to derive information about the dust. Due to partially photometric conditions and problems with the
absolute calibration of I images, it was impossible to derive the absolute value of dust reddening with R and I filters. Nevertheless, some images could be obtained combining the R and I frames of a single night, through Eq. (2). It was then possible to search for relative two-dimensional (2D) color variations inside single images, i.e. for features having different color
values in a single image. The most interesting 2D color structure was found in component B on May 13 and is shown in Fig. 11. We observe an arc structure, bluer than the surrounding coma, covering an angular size of ![]()
![]() centered on the north direction axis and of width
centered on the north direction axis and of width ![]() 60 km. The arc appears to emanate from the nucleus approximately at the beginning of
another structure, which can be identified as a jet. This jet was clearly detected by Vincent et al. (2009) using image enhancement techniques. A likely explanation of this feature is that it could be due to a bluer component of the dust in the jet emanating from the nucleus. The bluer color close to the nucleus becomes gradually redder when the dust, pushed by the solar radiation in the anti-solar direction, forms, or merges with, the elongated coma. We found that
60 km. The arc appears to emanate from the nucleus approximately at the beginning of
another structure, which can be identified as a jet. This jet was clearly detected by Vincent et al. (2009) using image enhancement techniques. A likely explanation of this feature is that it could be due to a bluer component of the dust in the jet emanating from the nucleus. The bluer color close to the nucleus becomes gradually redder when the dust, pushed by the solar radiation in the anti-solar direction, forms, or merges with, the elongated coma. We found that
![]() ,
while the jet has a color comparable with that of the coma. The difference in color between the arc and the surrounding coma implies that the scattering properties (i.e. the intimate nature), of the dust particles vary after being emitted from the nucleus. This effect resembles the properties of the dust plume created by the Deep Impact experiment
on comet 9P/Tempel 1. This plume was characterized by
,
while the jet has a color comparable with that of the coma. The difference in color between the arc and the surrounding coma implies that the scattering properties (i.e. the intimate nature), of the dust particles vary after being emitted from the nucleus. This effect resembles the properties of the dust plume created by the Deep Impact experiment
on comet 9P/Tempel 1. This plume was characterized by
![]() ,
meaning that either there was in the plume an overpopulation of sub-micrometer to micrometer grains or the grains were more refractive in the blue than in the red range (Lara et al. 2007). A similar explanation can be applied to the B component of 73P. Another explanation may be the scattering
properties of the emitted dust. To derive information about its nature, we completed sample Mie calculations with spherical particles of radius 0.1-10
,
meaning that either there was in the plume an overpopulation of sub-micrometer to micrometer grains or the grains were more refractive in the blue than in the red range (Lara et al. 2007). A similar explanation can be applied to the B component of 73P. Another explanation may be the scattering
properties of the emitted dust. To derive information about its nature, we completed sample Mie calculations with spherical particles of radius 0.1-10 ![]() m and the three dust compositions used in Bertini et al. (2007): pure silicates, mixed silicates and organics, and pure organics. Although we are aware that cometary dust particles are probably morphologically more complex than single spheres, we note that Mie calculations can approximate well the dust scattering properties. With Mie theory, it is also easier to investigate the scattering behavior of dust particles far larger
than the incident wavelength, while DDA is most useful for particles of size comparable to the incident wavelength (Draine & Flatau 2000). Using Mie calculations, the bluer color of the arc close to the nucleus can be interpreted qualitatively as being a fragmentation of pure silicate
particles. Assuming this dust composition, particles of radius 10
m and the three dust compositions used in Bertini et al. (2007): pure silicates, mixed silicates and organics, and pure organics. Although we are aware that cometary dust particles are probably morphologically more complex than single spheres, we note that Mie calculations can approximate well the dust scattering properties. With Mie theory, it is also easier to investigate the scattering behavior of dust particles far larger
than the incident wavelength, while DDA is most useful for particles of size comparable to the incident wavelength (Draine & Flatau 2000). Using Mie calculations, the bluer color of the arc close to the nucleus can be interpreted qualitatively as being a fragmentation of pure silicate
particles. Assuming this dust composition, particles of radius 10 ![]() m are, for example, bluer than particles of radius 1.5
m are, for example, bluer than particles of radius 1.5 ![]() m, at the phase angle of our image. Moreover, grain aggregates break-up and fragmentation were found to reproduce well the observed brightness radial profiles perpendicular to the Sun-comet axis of component B on May 11-13 by Jones et al. (2008),
who analyzed optical and near-IR data in the H, I filters. This perpendicular direction gives a cross-cut of the arc feature we detected in the same date. Further modeling is necessary to better constrain the nature of the emitted dust.
m, at the phase angle of our image. Moreover, grain aggregates break-up and fragmentation were found to reproduce well the observed brightness radial profiles perpendicular to the Sun-comet axis of component B on May 11-13 by Jones et al. (2008),
who analyzed optical and near-IR data in the H, I filters. This perpendicular direction gives a cross-cut of the arc feature we detected in the same date. Further modeling is necessary to better constrain the nature of the emitted dust.
![\begin{figure}
\par\includegraphics[width=8cm,clip]{1206fig11.eps}
\end{figure}](/articles/aa/full_html/2009/10/aa11206-08/img92.gif) |
Figure 11:
Relative two-dimensional color map of component B obtained with R and I images on May 13. The field of view is 53
|
| Open with DEXTER | |
3.2 Gas
The properties of the gas in comet 73P were investigated through the spectral analysis.
3.2.1 Spatial profiles
The spectra of the comet were used to investigate the CN, ![]() ,
and
,
and ![]() ,
and dust continuum profiles in the north-south direction. In the original proposal, we intended to obtain spectra of as many components as possible during the same night to characterize their similarities and differences. However, only one component (either C, B or G) was observed each time spectroscopically. Several spectra were not obtained in fully photometric, although mostly clear sky conditions. The spectroscopic data obtained in these mostly clear nights can be used
to analyze the ratios of band intensities, since non-photometry conditions affect equally the intensity of the CN and the C2 band (we note that clouds are neutral absorbers in the visible). These ratios, while not inferring gas production rates, will provide us with measurements of the ratios of pairs of the true production rates.
,
and dust continuum profiles in the north-south direction. In the original proposal, we intended to obtain spectra of as many components as possible during the same night to characterize their similarities and differences. However, only one component (either C, B or G) was observed each time spectroscopically. Several spectra were not obtained in fully photometric, although mostly clear sky conditions. The spectroscopic data obtained in these mostly clear nights can be used
to analyze the ratios of band intensities, since non-photometry conditions affect equally the intensity of the CN and the C2 band (we note that clouds are neutral absorbers in the visible). These ratios, while not inferring gas production rates, will provide us with measurements of the ratios of pairs of the true production rates.
Table 6: Gas production rates for components C, B and G.
Thus, we have spectroscopic measurements for the C component on March 4, for the B component on April 26 and May 2, and for the G component on April 29.
The G component spectrum clearly shows evidence of gas emission and its underlying continuum. It has been reported that component G underwent a splitting event before April 28![]() . Furthermore, our images of the component G acquired on April 26 clearly show the presence of several fragments. Although the S/N is too low for an indepth analysis to be possible, it is enough to detect at least 4 clearly differentiated fragments (see Fig. 12). Hence, it seems that the slit (oriented in the N-S direction and positioned at the optocenter) did observe emission from more than one fragment producing double-peaked profiles when the continuum cometary bands were extracted. This happens similarly with the spectrum of
component B on May 2. The slit-width covers the gas emission and continuum produced by the main component (or parent B) on which the slit was centered, and a big fragment close to the nucleus (see Fig. 1). Examples of the wavelength averaged spectra are shown in Fig. 2.
. Furthermore, our images of the component G acquired on April 26 clearly show the presence of several fragments. Although the S/N is too low for an indepth analysis to be possible, it is enough to detect at least 4 clearly differentiated fragments (see Fig. 12). Hence, it seems that the slit (oriented in the N-S direction and positioned at the optocenter) did observe emission from more than one fragment producing double-peaked profiles when the continuum cometary bands were extracted. This happens similarly with the spectrum of
component B on May 2. The slit-width covers the gas emission and continuum produced by the main component (or parent B) on which the slit was centered, and a big fragment close to the nucleus (see Fig. 1). Examples of the wavelength averaged spectra are shown in Fig. 2.
![\begin{figure}
\par\includegraphics[width=8cm,clip]{1206fig12.eps}
\end{figure}](/articles/aa/full_html/2009/10/aa11206-08/img111.gif) |
Figure 12:
Sum of the available images of component G on April 26. The orientation is given in the figure. The field of view is 135
|
| Open with DEXTER | |
The spectral region determination and subtraction of the underlying continuum in the gas emission bands was completed as described by Lara et al. (2001). The conversion of the emission band fluxes into
column densities makes use of constant g-factors for ![]() and C3 (A'Hearn et al. 1995), whereas the g-factor of the CN molecule is calculated for the heliocentric distance and velocity of C and B components of 73P on every date from the set of values given by Schleicher (1983). The gas production rates were obtained by means of Haser modeling (Haser 1957) with parent velocity
and C3 (A'Hearn et al. 1995), whereas the g-factor of the CN molecule is calculated for the heliocentric distance and velocity of C and B components of 73P on every date from the set of values given by Schleicher (1983). The gas production rates were obtained by means of Haser modeling (Haser 1957) with parent velocity ![]() related to
related to ![]() (
(
![]() ), a customary daughter velocity of
), a customary daughter velocity of
![]()
![]() and scale lengths given in A'Hearn et al. (1995).
and scale lengths given in A'Hearn et al. (1995).
The production rates obtained and log [Q(C2)/Q(CN)], log [Q(C3)/Q(CN)], and log [
![]() ]
are listed in Table 6. The production rates obtained for partially photometric nights are rather reliable, whereas those obtained in mostly clear (non-photometric) conditions must be regarded with caution and only the quotients log [Q(C2)/Q(CN)], log [Q(C3)/Q(CN)] are meaningful when classifying the comet according to the taxonomic classification introduced by A'Hearn et al. (1995). Therefore, results
in Table 6 indicate that component B seems to be carbon-chain depleted, while the C component could also be C-depleted if Q(C3)/Q(CN) can be considered as indicative
of this depletion. The carbon-chain depletion of components C and B was also found by Schleicher et al. (2006) using narrowband photometric observations from the end of April to mid May 2006 and by Villanueva et al. (2006) investigating IR spectra in early April 2006. Additionally, components C and B were found to be depleted in most forms of volatile carbon by analyzing infrared spectra by
Villanueva et al. (2006) (components C and B, early April 2006), DiSanti et al. (2007) (component C, late May 2006), and Kobayashi et al. (2007) (component B, mid May 2006). The gas production rates in Table 6 also point to the fact that the composition of both C and B components is much the same. This conclusion was also reached by Villanueva et al. (2006), Kobayashi et al. (2007), and Russo et al. (2007). Since by analyzing the C and B components we sample the interior of an original intact comet, the fact that both 73P-C and 73P-B have similar volatile composition suggests that the pre-split intact nucleus of 73-P is chemically homogeneous and that its composition reflects primarily formative conditions and not evolutionary processing, as already pointed out by Russo et al. (2007).
]
are listed in Table 6. The production rates obtained for partially photometric nights are rather reliable, whereas those obtained in mostly clear (non-photometric) conditions must be regarded with caution and only the quotients log [Q(C2)/Q(CN)], log [Q(C3)/Q(CN)] are meaningful when classifying the comet according to the taxonomic classification introduced by A'Hearn et al. (1995). Therefore, results
in Table 6 indicate that component B seems to be carbon-chain depleted, while the C component could also be C-depleted if Q(C3)/Q(CN) can be considered as indicative
of this depletion. The carbon-chain depletion of components C and B was also found by Schleicher et al. (2006) using narrowband photometric observations from the end of April to mid May 2006 and by Villanueva et al. (2006) investigating IR spectra in early April 2006. Additionally, components C and B were found to be depleted in most forms of volatile carbon by analyzing infrared spectra by
Villanueva et al. (2006) (components C and B, early April 2006), DiSanti et al. (2007) (component C, late May 2006), and Kobayashi et al. (2007) (component B, mid May 2006). The gas production rates in Table 6 also point to the fact that the composition of both C and B components is much the same. This conclusion was also reached by Villanueva et al. (2006), Kobayashi et al. (2007), and Russo et al. (2007). Since by analyzing the C and B components we sample the interior of an original intact comet, the fact that both 73P-C and 73P-B have similar volatile composition suggests that the pre-split intact nucleus of 73-P is chemically homogeneous and that its composition reflects primarily formative conditions and not evolutionary processing, as already pointed out by Russo et al. (2007).
Given the exceptional behavior of the B component, it has been spectroscopically observed on more occasions than the C component (see Table 6) under partially photometric and clear sky conditions. On March 25, only CN emission was clearly detectable in the spectrum, whose production rate is listed in Table 6. Besides the generally increased gas activity on April 11 and 13, the CN, C2, and C3 column density profiles are slightly asymmetric in the north-south direction, these species being more abundant in the celestial southern hemisphere than in the northern one. The higher abundance in the south direction is consistent with spectroscopic maps of HCN showing a kind of jet only in the SE direction (Paganini 2008).
Results for May 2 deserve some further explanation: a quick look at the spectrum indicates that the slit (placed onto the optocenter, assumed to be the parent B component) covers gas emission and
sunlight reflected by dust originating in more than one fragment. Two clear maximum intensity peaks are visible in continuum regions, and a broad maximum in gas emission bands. Hence, given this shortcoming in computing the clean, i.e. without contamination by dust sunlight scattering,
gas emissions, we independently centered the spatial spectra of the gas+continuum emission band, and both the left and the right continua on the center provided by a Gaussian fit to the
profiles. In the case of the continuum profiles, the Gaussian fit was completed for the maximum of the two peaks. We then subtracted the underlying continuum from the gas emission measured
in the corresponding band, such that clear gas emission remained. The resulting intensity or column density profile should portray any asymmetries due to the nucleus outgassing itself, or due to the gas emission by the parent B component and the nearby fragment. Figure 13 shows the derived CN column density profile along the N(![]() )-S(
)-S(![]() ) direction. We note that at
) direction. We note that at
![]() km, there is a clear asymmetry between the north and south hemisphere, the CN in the north direction being more abundant than in the south by a factor of
km, there is a clear asymmetry between the north and south hemisphere, the CN in the north direction being more abundant than in the south by a factor of ![]() 1.6. At larger cometocentric distances, the CN column density is about the same in both directions. This behavior cannot be easily explained because Fig. 1 shows a fragment southwest of the parent B component. Thus, as CN expands isotropically in every direction, the CN should be slightly more abundant in the south direction, and not in the north direction as Fig. 13 displays. We believe this asymmetry could be an artifact of the subtraction of the underlying continuum, since in the south direction the contribution from the main B component and its nearby related fragment is larger than in the north direction, and there is a dip in the CN pure emission band in the
south. We note that when extracting the emission in the range 381.0-390.5 nm, the profile does not show two clearly defined peaks, but a broad one of
1.6. At larger cometocentric distances, the CN column density is about the same in both directions. This behavior cannot be easily explained because Fig. 1 shows a fragment southwest of the parent B component. Thus, as CN expands isotropically in every direction, the CN should be slightly more abundant in the south direction, and not in the north direction as Fig. 13 displays. We believe this asymmetry could be an artifact of the subtraction of the underlying continuum, since in the south direction the contribution from the main B component and its nearby related fragment is larger than in the north direction, and there is a dip in the CN pure emission band in the
south. We note that when extracting the emission in the range 381.0-390.5 nm, the profile does not show two clearly defined peaks, but a broad one of ![]() 24
24
![]() .
The peaks do appear in the CN pure emission because it is undoubtedly due to the subtraction of a double-peaked underlying continuum profile. Hence, given this explanation, the
.
The peaks do appear in the CN pure emission because it is undoubtedly due to the subtraction of a double-peaked underlying continuum profile. Hence, given this explanation, the
![]() derived by Haser model
(see Table 6) can be regarded with caution and indeed can be considered to be a lower limit.
derived by Haser model
(see Table 6) can be regarded with caution and indeed can be considered to be a lower limit.
![\begin{figure}
\par\includegraphics[width=8.8cm,clip]{1206fig13.ps}
\par\end{figure}](/articles/aa/full_html/2009/10/aa11206-08/img120.gif) |
Figure 13:
CN column density profile (in cm-2) as a function of projected cometocentric distance |
| Open with DEXTER | |
4 Summary
From the analysis of data for comet 73P in its pre-perihelion phase, we have identified differences and commonalities in the evolution of the two main components (C and B) during 24 nights between January 21 and May 25, 2006. We have also analyzed few data of the smaller component G. We have found that:

- Component C dust production, measured in terms of the Af
 parameter, increases from
 AU to
AU to
 AU and then drops at smaller heliocentric distances. The peak in the dust production before reaching the perihelion may be due to a seasonal effect connected with the inclination of the rotation axis of component C with respect to its orbital plane. No sudden increase in dust productivity is detected. We measured
Af
AU and then drops at smaller heliocentric distances. The peak in the dust production before reaching the perihelion may be due to a seasonal effect connected with the inclination of the rotation axis of component C with respect to its orbital plane. No sudden increase in dust productivity is detected. We measured
Af
 for
for
 AU (from January 21 to April 16), if a photometric radius of 10 000 km was considered. For
 AU (from May 8 on and with
 )
observations, when Af drops, the fit Af
)
observations, when Af drops, the fit Af
 was meaningless since the data points were distributed over a limited range of heliocentric distances (
 = 1.03-0.96 AU). The correction, with compositional and morphological cometary dust modeling, of the phase effect suffered by Af data affects the
Af
= 1.03-0.96 AU). The correction, with compositional and morphological cometary dust modeling, of the phase effect suffered by Af data affects the
Af
 relation by at most 2%, while the phase angle was found to be in the range [
 ]. Component B exhibited more significant variability in terms of dust production. We detected two strong peaks in Af
:
on April 5 and on May 8-9. The two outbursts were followed by a sudden decrease in the dust productivity. Excluding
these high activity events, component B was characterized by lower Af
values with respect to the main component C. We found that Af
]. Component B exhibited more significant variability in terms of dust production. We detected two strong peaks in Af
:
on April 5 and on May 8-9. The two outbursts were followed by a sudden decrease in the dust productivity. Excluding
these high activity events, component B was characterized by lower Af
values with respect to the main component C. We found that Af
 (during March and from April 26 to May 2), using a photometric aperture of radius 10 000 km. Once
correction for the phase effect had been applied, we found that the exponent a can differ from the one derived from uncorrected data by up to 27%. The larger differences in a with respect to those for component C are due to the larger variations in the correction factor in the phase angle range corresponding to the observations used to determine a (
(during March and from April 26 to May 2), using a photometric aperture of radius 10 000 km. Once
correction for the phase effect had been applied, we found that the exponent a can differ from the one derived from uncorrected data by up to 27%. The larger differences in a with respect to those for component C are due to the larger variations in the correction factor in the phase angle range corresponding to the observations used to determine a (
 ).
).
-
- The slope m of the radial profiles of the brightness B (log B = m log )
versus
for component C increased (i.e. it became flatter) from the beginning until the end of our observations. The overall
 trend can be fitted
by a straight line of slope -0.724 and standard deviation 7%. Such a pre-perihelion trend has already been observed in another Jupiter family comet: 9P/Tempel 1. From about the middle of April m reached values -1. For the B component m versus relation a clear trend was not found. From March 4 until the end of our observations, m was found to have values of
between -1.2 and -0.8, with two lower values corresponding to the outbursts on April 5 (m=-1.63) and May 8 (m=-1.96). The presence of several fragments is clearly reflected in the radial profiles, causing noticeable deviations in the observed profile from a linear fit, depicted at several bumps along the profiles.
trend can be fitted
by a straight line of slope -0.724 and standard deviation 7%. Such a pre-perihelion trend has already been observed in another Jupiter family comet: 9P/Tempel 1. From about the middle of April m reached values -1. For the B component m versus relation a clear trend was not found. From March 4 until the end of our observations, m was found to have values of
between -1.2 and -0.8, with two lower values corresponding to the outbursts on April 5 (m=-1.63) and May 8 (m=-1.96). The presence of several fragments is clearly reflected in the radial profiles, causing noticeable deviations in the observed profile from a linear fit, depicted at several bumps along the profiles.
-
- No simultaneous and continuous spectra were acquired for components C and B, preventing us from making a direct comparison during the same observing nights. Although the long-slit spectra only contain spatial information for a selected direction (N-S in the
case of CAFOS), it can be concluded that the dust color, measured as the normalized reflectivity in %/100 nm, shows variations in the inner dust coma
 km) of the B component, whereas
it is rather stable (
km) of the B component, whereas
it is rather stable (
 nm) in the dust coma of 73P-C. The measured variations in S' for 73P-B are difficult to interpret because small pieces (i.e. mini-comets) were detected in the coma of the comet on April 26 and May 2. Although these pieces were not placed exactly in the N-S direction, the dust emitted by these pieces contributes to the measurements obtained through the slit in the aforementioned direction. Data for component G are poorer in terms of S/N. By averaging the reddening at
 km, mean values of 11.2
  2.3%/100 nm in the south direction and 14.5
3.5%/100 nm in the north direction were found.
2.3%/100 nm in the south direction and 14.5
3.5%/100 nm in the north direction were found.
-
- Relative two-dimensional color map of component B on May 13 showed variations in the inner coma, indicative of dust particles emanating from the nucleus that become redder while
forming the surrounding coma. Using Mie calculations, this can be explained qualitatively by fragmentation of dust particles of a pure silicate composition.
-
- On the few days for which we have information on the gas production rate from spectra, the B component shows steady values of
 and a slight increase in
 on May 2 (we note that between April 26 and May 2, the comet moved only 0.04 AU closer to the Sun). The CN production rate of the component G on April 29
 AU was of the same order as that for the C component at 1.59 AU from the Sun. Component C and B appear to be carbon-chain depleted, their composition being much the same. This indicates that the pre-split
73P original intact nucleus probably has a homogeneous composition.
AU was of the same order as that for the C component at 1.59 AU from the Sun. Component C and B appear to be carbon-chain depleted, their composition being much the same. This indicates that the pre-split
73P original intact nucleus probably has a homogeneous composition.
Acknowledgements
The paper is based on observations collected at the Centro Astronómico Hispano Alemán (CAHA) at Calar Alto, operated jointly by the Max-Planck Institut für Astronomie (MPG) and the Istituto de Astrofisica de Andalucia (CSIC). We are grateful to the service observers Aceituno J., Aguirre A., Alises M., Galadi D., Guijarro A., Hoyo F., Montoya L., Pedraz S., and Thiele U. Without their engagement and dedication this program would not have been successful. The research carried out has been partially supported by the Spanish Ministerio de Educación y Ciencia under contract ESP2006-02934. I. Bertini acknowledges a grant by the Junta de Andalucia under contract JA2007-TIC2744. Authors are grateful to the Referee who helped improving the quality of the paper.
References
- A'Hearn, M. F., Schleicher, D. G., Millis, R. L., Feldman, P. D., & Thompson, D. T. 1984, AJ, 89, 579 [NASA ADS] [CrossRef] (In the text)
- A'Hearn, M. F., Millis, R. L., Schleicher, D. G., Osip, D. J., & Birch, P. V. 1995, Icarus, 118, 223 [NASA ADS] [CrossRef] (In the text)
- Bertini, I., Thomas, N., & Barbieri, C. 2007, A&A, 461, 351 [NASA ADS] [CrossRef] [EDP Sciences] (In the text)
- Boehnhardt, H., Kaufl, H. U., Keen, R., et al. 1995, IAU Circ., 6274, 1 (In the text)
- Boehnhardt, H., Rainer, N., Birkle, K., & Schwehm, G. 1999, A&A, 341, 912 [NASA ADS] (In the text)
- Bonev, T., Boehnhardt, H., & Borisov, G. 2008, A&A, 480, 277 [NASA ADS] [CrossRef] [EDP Sciences] (In the text)
- Brownlee, D., Tsou, P., Aléon, J., et al. 2006, Science, 314, 1711 [NASA ADS] [CrossRef] (In the text)
- DiSanti, M. A., Anderson, W. M., Villanueva, G. L., et al. 2007, ApJ, 661, L101 [NASA ADS] [CrossRef] (In the text)
- Draine, B. T., & Flatau, P. J. 2000, User Guide for the Discrete Dipole Approximation Code DDSCAT, Version 5a10 (In the text)
- Epifani, E., Colangeli, L., Fulle, M., et al. 2001, Icarus, 149, 339 [NASA ADS] [CrossRef]
- Fulle, M. 2000, Icarus, 145, 239 [NASA ADS] [CrossRef]
- Fulle, M., Mikuz, H., & Bosio, S. 1997, A&A, 324, 1197 [NASA ADS] (In the text)
- Fulle, M., Levasseur-Regourd, A. C., McBride, N., & Hadamcik, E. 2000, AJ, 119, 1968 [NASA ADS] [CrossRef] (In the text)
- Harker, D. E., Woodward, C. E., Sitko, M. L., et al. 2006, in BAAS, 38, 503
- Haser, L. 1957, Bulletin de la Societe Royale des Sciences de Liege, 43, 740 [NASA ADS] (In the text)
- Jessberger, E. K. 1999, Space Sci. Rev., 90, 91 [NASA ADS] [CrossRef] (In the text)
- Jones, T. J., Stark, D., Woodward, C. E., et al. 2008, AJ, 135, 1318 [NASA ADS] [CrossRef] (In the text)
- Kadota, K., Jaeger, M., Galad, A., et al. 2000, IAU Circ., 7534, 1 (In the text)
- Keller, H. U., Küppers, M., Fornasier, S., et al. 2007, Icarus, 187, 87 [NASA ADS] [CrossRef] (In the text)
- Kobayashi, H., Kawakita, H., Mumma, M. J., et al. 2007, ApJ, 668, L75 [NASA ADS] [CrossRef] (In the text)
- Kolokolova, L., Hanner, M. S., Levasseur-Regourd, A.-C., & Gustafson, B. Å. S. 2004, Comets II, 577 [NASA ADS] (In the text)
- Lara, L. M., Schulz, R., Stüwe, J. A., & Tozzi, G. P. 2001, Icarus, 150, 124 [NASA ADS] [CrossRef]
- Lara, L.-M., Rodrigo, R., Tozzi, G. P., Boehnhardt, H., & Leisy, P. 2004a, A&A, 420, 371 [NASA ADS] [CrossRef] [EDP Sciences]
- Lara, L.-M., Tozzi, G. P., Boehnhardt, H., DiMartino, M., & Schulz, R. 2004b, A&A, 422, 717 [NASA ADS] [CrossRef] [EDP Sciences]
- Lara, L. M., Boehnhardt, H., Gredel, R., et al. 2006a, A&A, 445, 1151 [NASA ADS] [CrossRef] [EDP Sciences] (In the text)
- Lara, L. M., Gutiérrez, P. J., Rodrigues, P., et al. 2006b, IAU Circ., 8708, 1 (In the text)
- Lara, L. M., Boehnhardt, H., Gredel, R., et al. 2007, A&A, 465, 1061 [NASA ADS] [CrossRef] [EDP Sciences] (In the text)
- Paganini, L. 2008, Ph.D. Thesis, International Max Planck Research School on Physical Processes in the Solar System and Beyond at the University of Braunschweig and Gottingen (In the text)
- Russell, R. W., Lynch, D. K., Sitko, M. L., et al. 2006, in BAAS, 38, 504
- Russo, N. D., Vervack, R. J., Weaver, H. A., et al. 2007, Nature, 448, 172 [NASA ADS] [CrossRef] (In the text)
- Schleicher, D. G. 1983, Ph.D. Thesis, AA, Maryland Univ., College Park (In the text)
- Schleicher, D. G., Birch, P. V., & Bair, A. N. 2006, in BAAS, 38, 485 (In the text)
- Scotti, J. V., Galad, A., Bohnhardt, H., et al. 1996, IAU Circ., 6301, 1 (In the text)
- Sitko, M. L., Whitney, B. A., Wolff, M. J., et al. 2006, in BAAS, 38, 490
- Toth, I., Lamy, P., & Weaver, H. A. 2005, Icarus, 178, 235 [NASA ADS] [CrossRef] (In the text)
- Toth, I., Lamy, P. L., Weaver, H. A., Noll, K. S., & Mutchler, M. J. 2008, in AAS/Division for Planetary Sciences Meeting Abstracts, Vol. 40, AAS/Division for Planetary Sciences Meeting Abstracts, #05.08 (In the text)
- Villanueva, G. L., Bonev, B. P., Mumma, M. J., et al. 2006, ApJ, 650, L87 [NASA ADS] [CrossRef] (In the text)
- Vincent, J.-B., Bohnhardt, H., Bertini, I., et al. 2009, Earth, Moon, and Planets, submitted (In the text)
Footnotes
- ... grism B400
![[*]](/icons/foot_motif.gif)
- See http://www.caha.es/alises/cafos/cafos22.pdf
for more details; observable spectral range between 2800 Å and 1.0
 m with a wavelength scale of 9.7 Å per pixel.
- ... April 28
- See image in http://www.lpl.arizona.edu/chergen/73P-G.0427.2.gif and accompanying explanation in http://www.skyhound.com/sh/73P.html
All Tables
Table 1: Component C: observations log and results in the broadband red filter.
Table 2: Component B: observations log and results in the broadband red filter.
Table 3: Component G: observations log.
Table 4:
Exponent a, together with its rms error, ![]() ,
of
the relation Af
,
of
the relation Af
![]() for components C and B.
for components C and B.
Table 5:
Normalized color of dust,
![]() ,
in components C, B
and G as acquired from the spectroscopic measurements in N-S direction.
,
in components C, B
and G as acquired from the spectroscopic measurements in N-S direction.
Table 6: Gas production rates for components C, B and G.
All Figures
| |
Figure 1:
Flux calibrated image of the B component on May 2 acquired with R Johnson filter. The look-up table is linear with cuts 0 and 8 |
| Open with DEXTER | |
| In the text | |
| |
Figure 2: Wavelength-averaged spectra of the C, B, and G components for March 4, May 2, and April 29, respectively. Optocenters are placed at pixel number 0. Other peaks relate to stars falling into the slit width. Note that for the C component a well defined peak is clearly visible, for the B component both peaks are well defined as the slit covers the gas emission and continuum from the main component and a fragment, and for the G component a wider peak is seen. Positive x-axis refers to the South direction, whereas negative x-axis is the North direction. |
| Open with DEXTER | |
| In the text | |
| |
Figure 3:
Correction factor curves,
|
| Open with DEXTER | |
| In the text | |
| |
Figure 4:
Af |
| Open with DEXTER | |
| In the text | |
| |
Figure 5:
Af |
| Open with DEXTER | |
| In the text | |
| |
Figure 6:
Values of the |
| Open with DEXTER | |
| In the text | |
| |
Figure 7:
Observed (crosses) and best linear fits (solid lines) of the dust brightness profiles |
| Open with DEXTER | |
| In the text | |
| |
Figure 8:
Observed (crosses) and best linear fits (solid lines) of the dust brightness profiles |
| Open with DEXTER | |
| In the text | |
| |
Figure 9:
Reddening,
|
| Open with DEXTER | |
| In the text | |
| |
Figure 10:
Images of comet 73P-B, enhanced by Laplace filtering, on April 26 and May 2 showing the presence of several fragments. The orientation is given in the figure. The field of view for every image is 136
|
| Open with DEXTER | |
| In the text | |
| |
Figure 11:
Relative two-dimensional color map of component B obtained with R and I images on May 13. The field of view is 53
|
| Open with DEXTER | |
| In the text | |
| |
Figure 12:
Sum of the available images of component G on April 26. The orientation is given in the figure. The field of view is 135
|
| Open with DEXTER | |
| In the text | |
| |
Figure 13:
CN column density profile (in cm-2) as a function of projected cometocentric distance |
| Open with DEXTER | |
| In the text | |
Copyright ESO 2009
Current usage metrics show cumulative count of Article Views (full-text article views including HTML views, PDF and ePub downloads, according to the available data) and Abstracts Views on Vision4Press platform.
Data correspond to usage on the plateform after 2015. The current usage metrics is available 48-96 hours after online publication and is updated daily on week days.
Initial download of the metrics may take a while.