| Issue |
A&A
Volume 494, Number 3, February II 2009
|
|
|---|---|---|
| Page(s) | 977 - 985 | |
| Section | Interstellar and circumstellar matter | |
| DOI | https://doi.org/10.1051/0004-6361:200810933 | |
| Published online | 22 December 2008 | |
HCO mapping of the Horsehead:
tracing the illuminated dense molecular cloud surfaces![[*]](/icons/foot_motif.gif) ,
,
M. Gerin1 - J. R. Goicoechea1,![]() - J. Pety2,1 - P. Hily-Blant3
- J. Pety2,1 - P. Hily-Blant3
1 - LERMA-LRA, UMR 8112, CNRS, Observatoire de Paris and École Normale
Supérieure, 24 Rue Lhomond, 75231 Paris, France
2 - IRAM, 300 rue de la Piscine, 38406 Grenoble cedex, France
3 -
Laboratoire d'Astrophysique, Observatoire de Grenoble, BP 53, 38041 Grenoble
Cedex 09, France
Received 8 September 2008 / Accepted 14 November 2008
Abstract
Context. Far-UV photons (FUV) strongly affect the physical and chemical state of molecular gas in the vicinity of young massive stars.
Aims. Finding molecular tracers of the presence of FUV radiation fields in the millimeter wavelength domain is desirable because IR diagnostics (for instance PAHs) are not easily accessible along high extinction line-of-sights. Furthermore, gas phase diagnostics provide information on the velocity fields.
Methods. We have obtained maps of the HCO and H13CO+ ground state lines towards the Horsehead edge at 5'' angular resolution with a combination of Plateau de Bure Interferometer (PdBI) and the IRAM-30 m telescope observations. These maps have been complemented with IRAM-30 m observations of several excited transitions at two different positions.
Results. Bright formyl radical emission delineates the illuminated edge of the nebula, with a faint emission remaining towards the shielded molecular core. Viewed from the illuminated star, the HCO emission almost coincides with the PAH and CCH emission. HCO reaches a similar abundance to HCO+ in the photon dissociation region (PDR), ![]() 1-
1-
![]() with respect to H2. To our knowledge, this is the highest HCO abundance ever measured. Pure gas-phase chemistry models fail to reproduce the observed HCO abundance by
with respect to H2. To our knowledge, this is the highest HCO abundance ever measured. Pure gas-phase chemistry models fail to reproduce the observed HCO abundance by ![]() 2 orders of magnitude, except if reactions of atomic oxygen with carbon radicals abundant in the PDR (i.e., CH2) play a significant role in the HCO formation. Alternatively, HCO could be produced in the PDR by non-thermal processes such as photo-processing of ice mantles and subsequent photo-desorption of either HCO or H2CO, and further gas phase photodissociation.
2 orders of magnitude, except if reactions of atomic oxygen with carbon radicals abundant in the PDR (i.e., CH2) play a significant role in the HCO formation. Alternatively, HCO could be produced in the PDR by non-thermal processes such as photo-processing of ice mantles and subsequent photo-desorption of either HCO or H2CO, and further gas phase photodissociation.
Conclusions. The measured HCO/H13CO+ abundance ratio is large towards the PDR (![]() 50), and much lower toward the gas shielded from FUV radiation (
50), and much lower toward the gas shielded from FUV radiation (![]() 1). We propose that high HCO abundances (
1). We propose that high HCO abundances (![]() 10-10) together with large HCO/H13CO+ abundance ratios (
10-10) together with large HCO/H13CO+ abundance ratios (![]() 1) are sensitive diagnostics of the presence of active photochemistry induced by FUV radiation.
1) are sensitive diagnostics of the presence of active photochemistry induced by FUV radiation.
Key words: astrochemistry - ISM: clouds - ISM: molecules - ISM: individual objects: Horsehead nebula - radiative transfer - radio lines: ISM
1 Introduction
Photodissociation region (PDR) models are used to understand the evolution
of far-UV (FUV;
![]() eV) illuminated matter both in our Galaxy
and in external galaxies. These sophisticated models have been benchmarked
Röllig et al. (2007) and are continuously upgraded
(e.g., Goicoechea & Le Bourlot 2007; González-García et al. 2008). Given the large number of physical and
chemical processes included in such models, it is necessary to build
reference data sets that can be used to test the predictive
accuracy of models.
Our team has contributed to this goal by providing a series of
high resolution interferometric observations of the Horsehead nebula
(see Pety et al. 2007b, for a summary).
Indeed, this source is particularly well suited
because of its favorable orientation and geometry, and its moderate
distance (
eV) illuminated matter both in our Galaxy
and in external galaxies. These sophisticated models have been benchmarked
Röllig et al. (2007) and are continuously upgraded
(e.g., Goicoechea & Le Bourlot 2007; González-García et al. 2008). Given the large number of physical and
chemical processes included in such models, it is necessary to build
reference data sets that can be used to test the predictive
accuracy of models.
Our team has contributed to this goal by providing a series of
high resolution interferometric observations of the Horsehead nebula
(see Pety et al. 2007b, for a summary).
Indeed, this source is particularly well suited
because of its favorable orientation and geometry, and its moderate
distance (![]() 400 pc; Habart et al. 2005). We have previously studied the
carbon (Pety et al. 2005; Teyssier et al. 2004) and sulfur chemistry (Goicoechea et al. 2006) of the nebula,
and detected the presence of a cold dense core, with active deuterium
fractionation (Pety et al. 2007a).
400 pc; Habart et al. 2005). We have previously studied the
carbon (Pety et al. 2005; Teyssier et al. 2004) and sulfur chemistry (Goicoechea et al. 2006) of the nebula,
and detected the presence of a cold dense core, with active deuterium
fractionation (Pety et al. 2007a).
The formyl radical, HCO, is known to be present in the interstellar medium since the late 1970's Snyder et al. (1976). Snyder et al. (1985) give a detailed description of the HCO structure and discuss the energy diagram for the lowest energy levels. HCO is a bent triatomic asymmetric top with an unpaired electron. a-type and b-type transitions are allowed, with a stronger dipole moment (1.36 Debye) for the a-type transitions Landsberg et al. (1977), which are therefore more easily detectable. The strongest HCO ground state transitions lie at 86.670, 86.708, 86.777 and 86.805 GHz, very close to the ground state transition of H13CO+ and to the first rotationally excited SiO line. Therefore HCO can be observed simultaneously with SiO and H13CO+. HCO ground state lines have been detected in the Orion Bar as well as in the dense PDRs NGC 2023, NGC 7023 and S 140 Schilke et al. (2001). From limited mapping, they have shown that HCO is sharply peaked in the Orion Bar PDR, confirming earlier suggestions that HCO is a tracer of the cloud illuminated interfaces de Jong et al. (1980). García-Burillo et al. (2002) have mapped HCO and H13CO+ in the nearby galaxy M 82. HCO, CO and the ionized gas present a nested ring morphology, with the HCO peaks being located further out compared to CO and the ring of H II regions. The chemistry of HCO is not well understood. Schilke et al. (2001) concluded that it is extremely difficult to understand the observed HCO abundance in PDRs with gas phase chemistry alone. As a possible way out, they tested the production of HCO by the photodissociation of formaldehyde. In this model, H2CO is produced in grain mantles, and released by non-thermal photo-desorption in the gas phase in the PDR. However, even with this favorable hypothesis, the model cannot reproduce the abundance and spatial distribution of HCO because the photo-production is most efficient at an optical depth of a few magnitudes where the photodissociation becomes less effective.
Table 1:
Observation parameters for the maps shown in Figs. 1
and 5. The projection center of all the maps is
![]() ,
,
![]() .
.
Table 2:
Observation parameters for the HCO deep integrations shown in
Fig. 1. Associated transitions can be found in
Table 3. The RA and Dec offsets are computed with
reference to
![]() ,
,
![]() .
The positions are also given in the coordinate
system used to display the maps in Figs. 1
and 5. In this coordinate system, maps are
rotated by 14
.
The positions are also given in the coordinate
system used to display the maps in Figs. 1
and 5. In this coordinate system, maps are
rotated by 14![]() counter-clockwise around the projection center,
located at
counter-clockwise around the projection center,
located at
![]() =
(20'',0''), to bring the
illuminated star direction in the horizontal direction and the
horizontal zero has been set at the PDR edge.
=
(20'',0''), to bring the
illuminated star direction in the horizontal direction and the
horizontal zero has been set at the PDR edge.
In this paper, we present maps of the formyl radical ground state lines at high angular resolution towards the Horsehead nebula, and the detection of higher energy level transitions towards two particular lines of sights, one in the PDR region and the other in the associated dense core. These observations enable us to accurately study the HCO spatial distribution and abundance. We present the observations and data reduction in Sect. 2, while the results and HCO abundance are given in Sect. 3, and the discussion of HCO chemistry and PDR modeling is given in Sect. 4.
![\begin{figure}
\includegraphics[angle=270,width=17.7cm,clip]{0933fig1} %\end{figure}](/articles/aa/full_html/2009/06/aa10933-08/img48.gif) |
Figure 1:
High angular resolution maps of the integrated intensity of
H13CO+, HCO, CCH and vibrationally excited H2 emission.
H13CO+ and HCO have been observed
simultaneously, both with the IRAM-30 m and IRAM-PdBI. Maps have been
rotated by 14 |
| Open with DEXTER | |
2 Observations and data reduction
Tables 1 and 2 summarize the
observation parameters for the data obtained with the IRAM PdBI and
30 m telescopes. The HCO ground state lines were observed simultaneously
with H13CO+ and SiO. Frequency-switched, on-the-fly maps of the
H13CO+ J = 1-0 and HCO ground state lines
(see Fig. 5), obtained at the IRAM-30 m
using the A100 and B100 3 mm receivers (
![]() mm of water vapor) were used
to produce the short-spacings needed to complement a 7-field mosaic acquired
with the 6 PdBI antennae in the CD configuration (baseline lengths from 24 to 176 m). The whole PdBI data set will be comprehensively described
in a forthcoming paper studying the fractional ionization across the
Horsehead edge (Goicoechea et al. 2009). The CCH data
shown in Fig. 1 have been extensively
described in Pety et al. (2005).
The high resolution HCO
10,1-00,0 data are complemented by
observations of the
20,2-10,1 and
30,3-20,2 multiplets with
the IRAM 30 m telescope centered on the PDR and the dense core. To obtain
those deep integration spectra, we used the position switching observing mode.
The on-off cycle duration was 1 min and the off-position offsets were
mm of water vapor) were used
to produce the short-spacings needed to complement a 7-field mosaic acquired
with the 6 PdBI antennae in the CD configuration (baseline lengths from 24 to 176 m). The whole PdBI data set will be comprehensively described
in a forthcoming paper studying the fractional ionization across the
Horsehead edge (Goicoechea et al. 2009). The CCH data
shown in Fig. 1 have been extensively
described in Pety et al. (2005).
The high resolution HCO
10,1-00,0 data are complemented by
observations of the
20,2-10,1 and
30,3-20,2 multiplets with
the IRAM 30 m telescope centered on the PDR and the dense core. To obtain
those deep integration spectra, we used the position switching observing mode.
The on-off cycle duration was 1 min and the off-position offsets were
![]() ,
i.e. the H II region
ionized by
,
i.e. the H II region
ionized by ![]() Ori and free of molecular emission.
Position accuracy is estimated to be about 3'' for the
30 m data and less than 0.5'' for the PdBI data.
Ori and free of molecular emission.
Position accuracy is estimated to be about 3'' for the
30 m data and less than 0.5'' for the PdBI data.
The data processing was done with the GILDAS![]() softwares (Pety 2005b). The IRAM-30 m data were
first calibrated to the
softwares (Pety 2005b). The IRAM-30 m data were
first calibrated to the
![]() scale using the chopper wheel
method (Penzias & Burrus 1973), and finally converted to main beam temperatures
(
scale using the chopper wheel
method (Penzias & Burrus 1973), and finally converted to main beam temperatures
(
![]() )
using the forward and main beam efficiencies (
)
using the forward and main beam efficiencies (
![]() &
&
![]() )
displayed in Table 2. The resulting amplitude accuracy
is
)
displayed in Table 2. The resulting amplitude accuracy
is ![]() 10%. Frequency-switched spectra were folded using the
standard shift-and-add method, after baseline subtraction. The resulting
spectra were finally gridded through convolution by a Gaussian.
Position-switched spectra were co-added before baseline subtraction.
Interferometric data and short-spacing data were merged before imaging and
deconvolution of the mosaic, using standard techniques of
GILDAS (see e.g. Pety et al. 2005, for details).
10%. Frequency-switched spectra were folded using the
standard shift-and-add method, after baseline subtraction. The resulting
spectra were finally gridded through convolution by a Gaussian.
Position-switched spectra were co-added before baseline subtraction.
Interferometric data and short-spacing data were merged before imaging and
deconvolution of the mosaic, using standard techniques of
GILDAS (see e.g. Pety et al. 2005, for details).
![\begin{figure}
\includegraphics[angle=270,width=17cm,clip]{0933fig2} %\end{figure}](/articles/aa/full_html/2009/06/aa10933-08/img55.gif) |
Figure 2:
IRAM-30 m observations (histograms) of several HCO hyperfine components
of the 101-000, 202-101 and 303-202 rotational transitions towards the PDR (``HCO peak'') and towards the
dense core (``DCO+ peak'') Pety et al. (2007a). Solid lines are
single-
|
| Open with DEXTER | |
3 Results and discussion
3.1 Spatial distribution
Figure 1 shows a map of the integrated intensity of the strongest HCO line at 86.671 GHz, of the H13CO+ J = 1-0 line and of the strongest CCH line at 87.317 GHz. Figure 2 displays high signal-to-noise ratio spectra of several hyperfine components of three HCO rotational transitions towards the HCO and the DCO+ emission peaks.
Most of the formyl radical emission is concentrated in a narrow
structure, delineating the edge of the Horsehead nebula. Low level
emission is however detected throughout the nebula, including towards the
dense core identified by its strong DCO+ and H13CO+ emission
Pety et al. (2007a). The HCO emission is resolved by our PdBI observations.
From 2-dimensional Gaussian fits of the image, we estimate that the
emission width is
![]()
![]() in the plane of the sky.
The H13CO+ emission
shows a different pattern: most of the signal is associated
with the dense core behind the photodissociation front, and faint
H13CO+ emission detected in the illuminated edge.
The CCH emission pattern is less extreme than HCO, but
shows a similar enhancement in the PDR.
in the plane of the sky.
The H13CO+ emission
shows a different pattern: most of the signal is associated
with the dense core behind the photodissociation front, and faint
H13CO+ emission detected in the illuminated edge.
The CCH emission pattern is less extreme than HCO, but
shows a similar enhancement in the PDR.
In summary, the morphology of the HCO emission is reminiscent of the emission of the PDR tracers, either the PAH emission (Abergel et al. 2002) or the emission of small hydrocarbons, which is strongly enhanced towards the PDR (Pety et al. 2005; Teyssier et al. 2004). In contrast, the HCO emission becomes very faint where the gas is dense and shielded from FUV radiation. These regions are associated with bright DCO+ and H13CO+ emission (Pety et al. 2007a). Our maps therefore confirm that HCO is a PDR species.
Table 3: Einstein coefficients and upper level energies.
3.2 Column densities and abundances
3.2.1 Radiative transfer models of HCO and H13CO+
Einstein coefficients and upper level energies of the studied
HCO and H13CO+ lines are given in Table 3.
As no collisional cross-sections with H2 nor He have been
calculated for HCO so far, we have computed the HCO column densities
assuming a single excitation temperature
![]() for all transitions.
Nevertheless our calculation takes into account
thermal, turbulent and opacity broadening as well as the cosmic microwave
background and line opacity Goicoechea et al. (2006).
For H13CO+, detailed non-local and non-LTE excitation and
radiative transfer calculations have
been performed using the same approach as in our previous PdBI CS and
C18O line analysis (see Appendix in Goicoechea et al. 2006).
H13CO+-H2 collisional rate coefficients were adapted from those of
Flower (1999) for HCO+, and specific H13CO+-electron rates where
kindly provided by Faure & Tennyson (in prep.).
for all transitions.
Nevertheless our calculation takes into account
thermal, turbulent and opacity broadening as well as the cosmic microwave
background and line opacity Goicoechea et al. (2006).
For H13CO+, detailed non-local and non-LTE excitation and
radiative transfer calculations have
been performed using the same approach as in our previous PdBI CS and
C18O line analysis (see Appendix in Goicoechea et al. 2006).
H13CO+-H2 collisional rate coefficients were adapted from those of
Flower (1999) for HCO+, and specific H13CO+-electron rates where
kindly provided by Faure & Tennyson (in prep.).
![\begin{figure}
\includegraphics[angle=270,width=9cm,clip]{0933fig3.eps} %\end{figure}](/articles/aa/full_html/2009/06/aa10933-08/img73.gif) |
Figure 3:
Observations along a horizontal cut through ``the HCO peak'' (histograms).
The H13CO+ J = 1-0 and HCO
101-000 lines were mapped with
the PdBI at an angular resolution of 6.8'', whereas the H13CO+
J = 3-2 line was mapped with HERA-30 m (and smoothed to a spatial
resolution of 13.5''). Radiative transfer models of an edge-on
cloud with a line of sight extinction of
|
| Open with DEXTER | |
3.2.2 Structure of the PDR in HCO and H13CO+
For more insight into the spatial variation of the HCO and H13CO+
column densities and abundances, we have analyzed a cut
through the PDR, centered on the ``HCO peak''
at
![]() (see Fig. 3).
The cut clearly shows that HCO is brighter than
H13CO+ in the PDR and vice-versa in the dense core.
Taking into account the different level degeneracies of both
transitions (a factor of 2.4) and the fact that the associated Einstein
coefficients Aij differ by a factor
(see Fig. 3).
The cut clearly shows that HCO is brighter than
H13CO+ in the PDR and vice-versa in the dense core.
Taking into account the different level degeneracies of both
transitions (a factor of 2.4) and the fact that the associated Einstein
coefficients Aij differ by a factor ![]() 8 (due to the different
permanent dipole moments, see Table 3), N(H13CO+) must be
significantly lower than N(HCO) towards the PDR.
8 (due to the different
permanent dipole moments, see Table 3), N(H13CO+) must be
significantly lower than N(HCO) towards the PDR.
We modeled the PDR as an edge-on cloud inclined by ![]() 5
5
![]() relative to the line-of-sight. We have chosen a cloud depth of
relative to the line-of-sight. We have chosen a cloud depth of ![]() 0.1 pc,
which implies an extinction of
0.1 pc,
which implies an extinction of
![]() mag for the considered
densities towards the ``HCO peak''. These parameters are the best
geometrical description of the Horsehead PDR-edge (e.g., Habart et al. 2005) and
also reproduce the observed 1.2 mm continuum emission intensity.
The details of this modeling will be presented in Goicoechea et al. (2009).
In the following, we describe in detail
the determination of the column densities and abundances for two
particular positions, namely the ``HCO peak'' and the ``DCO+ peak''
(offsets relative to the map center can be found in
Table 2).
mag for the considered
densities towards the ``HCO peak''. These parameters are the best
geometrical description of the Horsehead PDR-edge (e.g., Habart et al. 2005) and
also reproduce the observed 1.2 mm continuum emission intensity.
The details of this modeling will be presented in Goicoechea et al. (2009).
In the following, we describe in detail
the determination of the column densities and abundances for two
particular positions, namely the ``HCO peak'' and the ``DCO+ peak''
(offsets relative to the map center can be found in
Table 2).
3.2.3 HCO column densities
We used the three detected rotational transitions of HCO (each with
several hyperfine components, see Fig. 2) to
estimate the HCO column densities in the direction of the ``HCO'' peak.
We have taken into account the
varying beam dilution factors of the HCO emission at
the ``HCO peak'' by modeling the HCO
emission as a Gaussian filament of ![]() 12'' width in the
12'' width in the
![]() direction, and infinite in the
direction, and infinite in the ![]() direction. The filling factors at 260, 173 and 87 GHz are thus
direction. The filling factors at 260, 173 and 87 GHz are thus ![]() 0.8,
0.6 and 0.4, respectively.
0.8,
0.6 and 0.4, respectively.
A satisfactory fit of the IRAM-30 m data
towards the ``HCO peak'' is obtained for
![]()
![]() 5 K and a turbulent
velocity dispersion of
5 K and a turbulent
velocity dispersion of
![]() (
(
![]() ).
Line profiles are reproduced for N(HCO) =
).
Line profiles are reproduced for N(HCO) =
![]() cm-2 (see red solid curves in Fig. 2). The
most intense HCO lines at 86.67 and 173.38 GHz become marginally optically
thick at this column density (
cm-2 (see red solid curves in Fig. 2). The
most intense HCO lines at 86.67 and 173.38 GHz become marginally optically
thick at this column density (
![]() ). Therefore, opacity
corrections need to be taken into account. We checked that the low value
of
). Therefore, opacity
corrections need to be taken into account. We checked that the low value
of
![]() (subthermal excitation as
(subthermal excitation as
![]() K) is consistent
with detailed excitation calculations carried out for H13CO+ in the PDR
which are described below.
K) is consistent
with detailed excitation calculations carried out for H13CO+ in the PDR
which are described below.
Because the HCO signals are weaker towards the ``DCO+peak'', we only detected
2 hyperfine components of the
101-000 transition. Assuming extended
emission and the same excitation temperature as for the ``HCO peak'', 5 K, we
fit the observed lines with a column density of
![]() cm-2
(blue solid lines in Fig. 2).
Both HCO lines are optically thin at this position.
This simple analysis shows that the HCO column density is
cm-2
(blue solid lines in Fig. 2).
Both HCO lines are optically thin at this position.
This simple analysis shows that the HCO column density is ![]() 7 times
larger at the ``HCO peak'' in the PDR, than towards the dense cold core.
7 times
larger at the ``HCO peak'' in the PDR, than towards the dense cold core.
3.2.4 H13CO+ column densities
Both the H13CO+ J = 3-2 and 1-0 line profiles at the ``HCO
peak'' are fitted with
![]() cm-3,
cm-3,
![]()
![]() 60 K
and e-/
60 K
and e-/
![]() (as predicted by the PDR
models below). The required column density is N(H13CO+) =
(as predicted by the PDR
models below). The required column density is N(H13CO+) =
![]() cm-2. For those conditions, the excitation
temperature,
cm-2. For those conditions, the excitation
temperature,
![]() ,
of the J = 3-2 transition varies
from
,
of the J = 3-2 transition varies
from ![]() 4 to 6 K, which supports the
single-
4 to 6 K, which supports the
single-
![]() models of HCO. Both H13CO+ lines are optically thin
towards the ``HCO peak''.
models of HCO. Both H13CO+ lines are optically thin
towards the ``HCO peak''.
The H13CO+ line emission towards the ``DCO+ peak'' has been studied
by Pety et al. (2007a). Both H13CO+ lines are moderately optically thick
towards the core, and the H13CO+ column density
is N(H13CO+) ![]()
![]() cm-2, which
represents an enhancement of nearly one
order of magnitude relative to the PDR. According to our 1.2 mm continuum
map, the extinction towards the core is
cm-2, which
represents an enhancement of nearly one
order of magnitude relative to the PDR. According to our 1.2 mm continuum
map, the extinction towards the core is
![]() mag
compared to 20 mag in the PDR. The H13CO+ column density
enhancement therefore corresponds to a true abundance enhancement.
mag
compared to 20 mag in the PDR. The H13CO+ column density
enhancement therefore corresponds to a true abundance enhancement.
Table 4:
Inferred column densities and abundances with respect to
molecular hydrogen, e.g.
![]() .
.
3.2.5 Comparison of HCO and H13CO+ abundances
Table 4 summarizes the inferred HCO and H13CO+ column
densities and abundances towards the 2 selected positions:
the ``HCO peak'' in the PDR and
the ``DCO+ peak'' in the FUV-shielded core. Both species exhibit
strong variations of their column densities and abundances relative to H2between the PDR and the shielded region.
In the PDR, we found that both the HCO abundance relative to H2(![]() (HCO)
(HCO) ![]() 1-
1-
![]() )
and the HCO/H13CO+ column
density ratio (
)
and the HCO/H13CO+ column
density ratio (![]() 50) are high. These figures are higher than all
previously published measurements (at
lower angular resolution). Besides,
the formyl radical and HCO+ reach similar abundances in the PDR.
50) are high. These figures are higher than all
previously published measurements (at
lower angular resolution). Besides,
the formyl radical and HCO+ reach similar abundances in the PDR.
![\begin{figure}
\includegraphics[angle=270,width=13.5cm,clip]{0933fig4}
\end{figure}](/articles/aa/full_html/2009/06/aa10933-08/img101.gif) |
Figure 4:
Photochemical models of a unidimensional PDR.
Upper panels show the density gradient (
|
| Open with DEXTER | |
The situation is reversed towards the ``DCO+ peak'', i.e. the
observed HCO/H13CO+ column density ratio is lower (![]() 1)
than towards the ``HCO peak''. Nevertheless, while the bulk of
the observed H13CO+ emission arises from
cold and shielded gas, the origin of HCO emission is less clear.
HCO could either (i) coexist with H13CO+ or (ii)
arise predominantly from the line-of-sight cloud surface. In the former
case, our observations show that the HCO abundance drops by one order of
magnitude between the PDR and the dense core environment.
However, it is possible that the abundance variation is
even more pronounced, if the detected HCO emission arises
from the line of sight cloud surface. We have estimated the
depth of the cloud layer, assuming that HCO keeps the
``PDR abundance'' in this foreground layer: a cloud surface
layer of
1)
than towards the ``HCO peak''. Nevertheless, while the bulk of
the observed H13CO+ emission arises from
cold and shielded gas, the origin of HCO emission is less clear.
HCO could either (i) coexist with H13CO+ or (ii)
arise predominantly from the line-of-sight cloud surface. In the former
case, our observations show that the HCO abundance drops by one order of
magnitude between the PDR and the dense core environment.
However, it is possible that the abundance variation is
even more pronounced, if the detected HCO emission arises
from the line of sight cloud surface. We have estimated the
depth of the cloud layer, assuming that HCO keeps the
``PDR abundance'' in this foreground layer: a cloud surface
layer of
![]() (illuminated
by the mean FUV radiation field around the region) also reproduces the
observed HCO lines towards the cold and dense core (blue solid lines in
Fig. 2).
(illuminated
by the mean FUV radiation field around the region) also reproduces the
observed HCO lines towards the cold and dense core (blue solid lines in
Fig. 2).
![\begin{figure}
\par\includegraphics[origin=rb,angle=270,width=12cm,clip]{0933fig5} %\end{figure}](/articles/aa/full_html/2009/06/aa10933-08/img102.gif) |
Figure 5:
Medium angular resolution maps of the integrated intensity of
the 4 hyperfine components of the fundamental transition of HCO.
These lines have been
observed simultaneously at IRAM-30 m. Maps have been rotated by 14 |
| Open with DEXTER | |
In this case, both the HCO abundance and the HCO/H13CO+ abundance ratio in the dense core
itself will be even lower than listed in Table 4.
We have tried to discriminate between the scenarios by
comparing the HCO
101-000 (J = 3/2-1/2, F = 2-1) and H13CO+J = 1-0 line profiles towards this position. Both lines have been observed
simultaneously with the IRAM-30 m telescope. Because of their very similar
frequencies (![]() 86.7 GHz), the beam profile and angular resolution is
effectively the same. In this situation, any difference in the measured
linewidths reflects real differences in the gas kinematics and turbulence
of the regions where the line profiles are formed. Gaussian
fits of the HCO and H13CO+ lines towards ``the DCO+ peak'' provides
line widths of
86.7 GHz), the beam profile and angular resolution is
effectively the same. In this situation, any difference in the measured
linewidths reflects real differences in the gas kinematics and turbulence
of the regions where the line profiles are formed. Gaussian
fits of the HCO and H13CO+ lines towards ``the DCO+ peak'' provides
line widths of
![]() (HCO) =
(HCO) =
![]() km s-1 and
km s-1 and
![]() (H13CO+) =
(H13CO+) =
![]() km s-1.
Therefore, even if the H13CO+ J = 1-0 lines are
slightly broadened by opacity and do not represent the
true line of sight velocity dispersion, HCO lines are broader at
the 3
km s-1.
Therefore, even if the H13CO+ J = 1-0 lines are
slightly broadened by opacity and do not represent the
true line of sight velocity dispersion, HCO lines are broader at
the 3![]() level of confidence.
This remarkable difference supports the scenario (ii)
where the H13CO+line emission towards the ``the DCO+ peak'' arises from the quiescent,
cold and dense core, whereas HCO, in the same line of sight, arises
predominantly from the warmer and more turbulent outer cloud layers.
We note that the presence of a foreground layer of more diffuse
material (
level of confidence.
This remarkable difference supports the scenario (ii)
where the H13CO+line emission towards the ``the DCO+ peak'' arises from the quiescent,
cold and dense core, whereas HCO, in the same line of sight, arises
predominantly from the warmer and more turbulent outer cloud layers.
We note that the presence of a foreground layer of more diffuse
material (
![]() mag) was already introduced by
Goicoechea et al. (2006) to fit the
CS J = 2-1 scattered line emission.
The analysis of CO J = 4-3 and C I
3P1 - 3P0 maps led
Philipp et al. (2006) to propose the presence of a diffuse envelope,
with
mag) was already introduced by
Goicoechea et al. (2006) to fit the
CS J = 2-1 scattered line emission.
The analysis of CO J = 4-3 and C I
3P1 - 3P0 maps led
Philipp et al. (2006) to propose the presence of a diffuse envelope,
with
![]() mag, and which contributes to about
half the mass of the dense filament traced by C18O and
the dust continuum emission.
The hypothesis of a surface layer of
HCO is therefore consistent with previous modeling of molecular
emission of the Horsehead.
mag, and which contributes to about
half the mass of the dense filament traced by C18O and
the dust continuum emission.
The hypothesis of a surface layer of
HCO is therefore consistent with previous modeling of molecular
emission of the Horsehead.
We conclude 1) that HCO and HCO+ have similar abundances in the PDR; and 2) that the HCO abundance drops by at least one order of magnitude between the dense and warm PDR region and the cold and shielded DCO+ core.
4 HCO chemistry
4.1 Gas-phase formation: PDR models
In order to understand the HCO and H13CO+ abundances and HCO/H13CO+
column density ratio inferred from observations, we have modeled the steady
state gas phase chemistry at the Horsehead edge. The density distribution
in the PDR is well represented by a density gradient
![]() ,
where
,
where ![]() is the distance from the
edge towards the cloud interior and
is the distance from the
edge towards the cloud interior and
![]() (see the top
panels of Fig. 4). The density
reaches a constant
(see the top
panels of Fig. 4). The density
reaches a constant ![]() value of
value of
![]() cm-3 in an
equivalent length of
cm-3 in an
equivalent length of ![]() 10'' Habart et al. (2005); Goicoechea et al. (2006). The cloud edge is
illuminated by a FUV field 60 times the mean interstellar radiation field
(G0 = 60 in Draine units).
We used the Meudon PDR code
10'' Habart et al. (2005); Goicoechea et al. (2006). The cloud edge is
illuminated by a FUV field 60 times the mean interstellar radiation field
(G0 = 60 in Draine units).
We used the Meudon PDR code![]() , a photochemical
model of a unidimensional PDR (see Goicoechea & Le Bourlot 2007; Le Petit et al. 2006; Le Bourlot et al. 1993, for a detailed
description). Our standard chemical network is based on
a modified version of the Ohio State University (osu) gas-phase
network, updated for photochemical studies (see Goicoechea et al. 2006). It also
includes 13C fractionation reactions Graedel et al. (1982) and specific
computation of the 13CO photodissociation rate as a function of depth.
The ionization rate due to cosmic rays in the models is
, a photochemical
model of a unidimensional PDR (see Goicoechea & Le Bourlot 2007; Le Petit et al. 2006; Le Bourlot et al. 1993, for a detailed
description). Our standard chemical network is based on
a modified version of the Ohio State University (osu) gas-phase
network, updated for photochemical studies (see Goicoechea et al. 2006). It also
includes 13C fractionation reactions Graedel et al. (1982) and specific
computation of the 13CO photodissociation rate as a function of depth.
The ionization rate due to cosmic rays in the models is
![]() s-1. Following our previous work, we
chose the following elemental gas phase abundances: He/H = 0.1,
O/H =
s-1. Following our previous work, we
chose the following elemental gas phase abundances: He/H = 0.1,
O/H =
![]() ,
C/H =
,
C/H =
![]() ,
N/H =
,
N/H =
![]() ,
S/H =
,
S/H =
![]() ,
13C/H =
,
13C/H =
![]() ,
Si/H =
,
Si/H =
![]() and Fe/H =
and Fe/H =
![]() .
.
In Fig. 4, we investigate the main gas-phase formation
routes for HCO in a series of models ``testing'' different pathways leading to
the formation of HCO. HCO and H13CO+ predictions are shown in
Fig. 4 (middle panels). In
all models the HCO abundance peaks near the cloud surface at
![]() (
(
![]() )
where the ionization
fraction is high (e-/
)
where the ionization
fraction is high (e-/
![]() ). Due to the low
abundance of metals in the model (as represented by the low
abundance of Fe), the ionization fraction in the shielded regions is low
(e-/
). Due to the low
abundance of metals in the model (as represented by the low
abundance of Fe), the ionization fraction in the shielded regions is low
(e-/
![]() ), and therefore the H13CO+ predictions
matches the observed values (Goicoechea et al. 2009). Besides, a low
metalicity reduces the efficiency of charge exchange reactions of HCO+with metals, e.g.,
), and therefore the H13CO+ predictions
matches the observed values (Goicoechea et al. 2009). Besides, a low
metalicity reduces the efficiency of charge exchange reactions of HCO+with metals, e.g.,
which are the main gas-phase formation route of HCO in the FUV-shielded gas in our models. Hence, the HCO abundance remains low inside the core. Nevertheless, even though such models do reproduce the observed HCO distribution, which clearly peaks at the PDR position, the predicted absolute HCO abundances can vary by orders of magnitude depending of the dominant formation route.
In our standard model (left-side models: dashed curves),
the formation of HCO in the PDR is dominated
by the dissociative recombination of H2CO+, while its destruction is
dominated by photodissociation.
Even if the predicted HCO/H13CO+ abundance ratio
satisfactorily reproduces the value inferred
from observations, the predicted HCO abundance peak is
![]() 3 orders of magnitude lower than observed.
In order to increase the gas-phase formation of the HCO in the PDR we have
added a new channel in the
photodissociation of formaldehyde, the production HCO,
in addition to the normal channel producing CO:
3 orders of magnitude lower than observed.
In order to increase the gas-phase formation of the HCO in the PDR we have
added a new channel in the
photodissociation of formaldehyde, the production HCO,
in addition to the normal channel producing CO:
This channel is generally not included in standard chemical networks but very likely exists Yin et al. (2007); Troe (2007). We included this process with an unattenuated photodissociation rate of
Another plausible possibility to increase the HCO abundance in the PDR
by pure gas-phase processes is to include additional reactions of
atomic oxygen with carbon radicals that reach high
abundances only in the PDR. Among the investigated reactions,
the most critical one,
is known to proceed with a relatively fast rate at high temperatures (
The validity of the rate of Reaction 3 used in our PDR model remains, of course, to be confirmed theoretically or experimentally at the typical ISM temperatures (10 to 200 K).
4.2 Other routes for HCO formation: Grain photodesorption
If Reaction 3 is not included in the chemical network,
the predicted HCO abundance
is ![]() 2 orders of magnitude below the observed value towards the PDR.
As a consequence, the presence of HCO in the gas-phase should be linked to
grain mantle formation routes, and subsequent desorption processes
(not taken into account in our modeling).
In particular, Schilke et al. (2001) proposed that HCO could result from
H2CO photodissociation, if large quantities of formaldehyde are formed
on grain mantles and then released in the gas phase. Even with this
assumption, their model could not reproduce the observed HCO abundance
in highly illuminated PDRs such as the Orion Bar.
The weaker FUV-radiation field in the Horsehead, but high density,
prevent dust grains from acquiring high temperatures over large
spatial scales.
In fact, both gas and grains cool down below
2 orders of magnitude below the observed value towards the PDR.
As a consequence, the presence of HCO in the gas-phase should be linked to
grain mantle formation routes, and subsequent desorption processes
(not taken into account in our modeling).
In particular, Schilke et al. (2001) proposed that HCO could result from
H2CO photodissociation, if large quantities of formaldehyde are formed
on grain mantles and then released in the gas phase. Even with this
assumption, their model could not reproduce the observed HCO abundance
in highly illuminated PDRs such as the Orion Bar.
The weaker FUV-radiation field in the Horsehead, but high density,
prevent dust grains from acquiring high temperatures over large
spatial scales.
In fact, both gas and grains cool down below ![]() 30 K
in
30 K
in ![]() 10''-20'' (or
10''-20'' (or
![]() )
as the FUV-radiation field is attenuated. Therefore, thermal
desorption of dust ice-mantles (presumably formed before
)
as the FUV-radiation field is attenuated. Therefore, thermal
desorption of dust ice-mantles (presumably formed before ![]() -Orionis
ignited and started to illuminate the nebula) should
play a negligible role. Hence a non-thermal desorption mechanism
should be considered to produce the high abundance of HCO observed
in the gas phase. This mechanism could either produce HCO directly or
a precursor molecule such as formaldehyde.
-Orionis
ignited and started to illuminate the nebula) should
play a negligible role. Hence a non-thermal desorption mechanism
should be considered to produce the high abundance of HCO observed
in the gas phase. This mechanism could either produce HCO directly or
a precursor molecule such as formaldehyde.
Since high HCO abundances are only observed in the PDR, FUV induced ice-mantle photo-desorption (with rates that roughly scale with the FUV-radiation field strength) seems the best candidate (e.g., Willacy & Williams 1993; Bergin et al. 1995). Laboratory experiments have shown that HCO radicals are produced in irradiated, methanol containing, ice mantles Bernstein et al. (1995); Moore et al. (2001); Bennett & Kaiser (2007). The formyl radical could be formed through the hydrogenation of CO in the solid phase. It is an important intermediate radical in the synthesis of more complex organic molecules such as methyl formate or glycolaldehyde Bennett & Kaiser (2007). However, the efficiency of the production of radicals in FUV irradiated ices remains uncertain, and very likely depends on the ice-mantle composition. The formation of species like formaldehyde and methanol in CO-ice exposed to H-atom bombardment has been reported by different groups Linnartz et al. (2007); Hiraoka et al. (1994); Watanabe et al. (2002), further confirming the importance of HCO as an intermediate product in the synthesis of organic molecules in ices. Indeed, hydrogenation reactions of CO-ice, which form HCO, H2CO, CH3O and CH3OH in grain mantles (e.g., Tielens & Whittet 1997; Charnley et al. 1997), are one important path which warrants further studies.
To compare with our observations, we further need to understand how the radicals are released in the gas phase, either directly during the photo-processing, or following FUV induced photo-desorption. Recent laboratory measurements have started to shed light on the efficiency of photo-desorption, which depends on the ice composition and molecule to be desorbed. For species such as CO, the rate of photo-desorbed molecules per FUV photon is much higher than previously thought (e.g., Öberg et al. 2007). Similar experiments are required to constrain the formation rate of the various species that can form in interstellar ices and to determine their photo-desorption rates.
We can use the measured gas phase abundance of HCO to constrain
the efficiency of photo-desorption. We assume that
the PDR is at steady state, and that the main HCO formation mechanism is
non thermal photo-desorption from grain mantles (with a
![]() rate),
while the main destruction
mechanism is gas-phase photodissociation (with a
rate),
while the main destruction
mechanism is gas-phase photodissociation (with a
![]() rate),
therefore:
rate),
therefore:
![\begin{displaymath}D_{\rm HCO} = G_0~ \kappa_{\rm diss}(\mbox{HCO})~ \chi(\mbox{HCO})~ n(\mbox{H$_2$ }) \hspace{0.5cm} [\rm cm^{-3}~s^{-1}]
\end{displaymath}](/articles/aa/full_html/2009/06/aa10933-08/img130.gif) |
(5) |
![\begin{displaymath}F_{\rm HCO} = G_0~ \kappa_{\rm pd}(\mbox{HCO})~ \chi({\rm HCO...
...ver n(\mbox{H$_2$ })}~ n(\mbox{H$_2$ }) ~ [\rm cm^{-3}~s^{-1}]
\end{displaymath}](/articles/aa/full_html/2009/06/aa10933-08/img131.gif) |
(6) |
where
![]() is the gas phase abundance of HCO relative to H2,
is the gas phase abundance of HCO relative to H2,
![]() is the solid phase abundance relative to water ice,
and
is the solid phase abundance relative to water ice,
and
![]() is the fraction of water in the solid phase
relative to the total gas density.
is the fraction of water in the solid phase
relative to the total gas density.
![]() and
and
![]() are the HCO photodissociation and photo-desorption rates respectively.
are the HCO photodissociation and photo-desorption rates respectively.
By equaling the formation and destruction rates, we get:
![\begin{displaymath}\kappa_{\rm pd}(\mbox{HCO}) = \kappa_{\rm diss}(\mbox{HCO})~ ...
...H$_2$ }) \over n({\rm H_2O_{ice}})}\hspace{0.5cm} [\rm s^{-1}]
\end{displaymath}](/articles/aa/full_html/2009/06/aa10933-08/img137.gif) |
(7) |
or
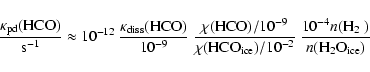 |
(8) |
where we have used typical figures for the HCO abundance in the gas
phase (![]() 10-9, see above) and solid phase
(
10-9, see above) and solid phase
(![]() 10-2 see e.g. Bennet & Kaiser 2007)
and for the amount of oxygen present as water ice in grain mantles.
10-2 see e.g. Bennet & Kaiser 2007)
and for the amount of oxygen present as water ice in grain mantles.
Assuming standard ISM grains with a radius of 0.1 ![]() m
the required photodesorption efficiency (or yield)
m
the required photodesorption efficiency (or yield)
![]() (HCO):
(HCO):
![\begin{displaymath}Y_{\rm pd}(\mbox{HCO}) \simeq \frac{\kappa_{\rm pd}(\mbox{HCO...
...{\rm V})~ \pi a^2} \hspace{0.5cm} [\rm molecules~ photon^{-1}]
\end{displaymath}](/articles/aa/full_html/2009/06/aa10933-08/img141.gif) |
(9) |
(see e.g., d'Hendecourt et al. 1985; Bergin et al. 1995) converts to
Because the formyl radical is closely related to formaldehyde and methanol and the three species are likely to coexist in the ice mantles, a combined analysis of the H2CO, CH3OH and HCO line emissions towards the Horsehead nebula (PDR and cores) is needed to provide more information on the relative efficiencies of gas-phase and solid-phase routes in the formation of complex organic molecules in environments dominated by FUV-radiation. This will be the subject of a future paper.
5 Summary and conclusions
We have presented interferometric and single-dish data showing the
spatial distribution of the formyl radical rotational lines in the Horsehead
PDR and associated dense core. The HCO emission delineates the illuminated
edge of the nebula and coincides with the PAH and hydrocarbon
emission. HCO and HCO+ reach similar abundances
(
![]() )
in these PDR regions where the chemistry is
dominated by the presence of FUV photons. For the physical conditions
prevailing in the Horsehead edge, pure gas-phase chemistry is able to
reproduce the observed HCO abundances (high in the PDR, low in the shielded
core) if the O + CH2
)
in these PDR regions where the chemistry is
dominated by the presence of FUV photons. For the physical conditions
prevailing in the Horsehead edge, pure gas-phase chemistry is able to
reproduce the observed HCO abundances (high in the PDR, low in the shielded
core) if the O + CH2
![]() HCO + H reaction is included in the
models. This reaction connects the high abundance of HCO, through its
formation from carbon radicals, with the availability of C+ in the PDR.
HCO + H reaction is included in the
models. This reaction connects the high abundance of HCO, through its
formation from carbon radicals, with the availability of C+ in the PDR.
The different linewidths of HCO and H13CO+ in the line of sight
towards the ``DCO+ peak'' suggest that the H13CO+ line emission
arises from the quiescent, cold and dense gas completely shielded from the
FUV radiation, whereas HCO predominantly arises from the outer surface of
the cloud (its illuminated skin). As a result we propose the
HCO/H13CO+ abundance ratio, and the HCO abundance itself (if
![]() 10-10), as sensitive diagnostics of the presence of FUV
radiation fields. In particular, regions where the HCO/H13CO+abundance ratio (or intensity ratio if lines are optically thin) is greater
than
10-10), as sensitive diagnostics of the presence of FUV
radiation fields. In particular, regions where the HCO/H13CO+abundance ratio (or intensity ratio if lines are optically thin) is greater
than ![]() 1 should reflect ongoing FUV-photochemistry.
1 should reflect ongoing FUV-photochemistry.
Given the rich HCO spectrum and the possibility of mapping its bright millimeter line emission with interferometers, we propose HCO-H2as a very interesting molecular system for calculations of the ab initio inelastic collision rates.
Acknowledgements
We thank the IRAM PdBI and 30 m staff for their support during the observations. We thank A. Faure and J. Tennyson for sending us the H13CO+-e- collisional rates prior to publication, B. Godard for useful discussions on the chemistry of carbon ions in the diffuse ISM, and A. Bergeat and A. Canosa for interesting discussions on radical-atom chemical reactions. J.R.G. is supported by a Ramón y Cajal research contract from the Spanish MICINN and co-financed by the European Social Fund. This research has benefitted from the financial support of the CNRS/INSU research programme, PCMI. We acknowledge the use of the JPL (Pickett et al. 1998) and Cologne (Müller et al. 2001,2005) spectroscopic data bases, as well as the UMIST chemical reaction data base Woodall et al. (2007).
References
- Abergel, A., Bernard, J. P., Boulanger, F., et al. 2002, A&A, 389, 239 [NASA ADS] [CrossRef] [EDP Sciences] (In the text)
- Bennett, C. J., & Kaiser, R. I. 2007, ApJ, 661, 899 [NASA ADS] [CrossRef]
- Bergin, E. A., Langer, W. D., & Goldsmith, P. F. 1995, ApJ, 441, 222 [NASA ADS] [CrossRef]
- Bernstein, M. P., Sandford, S. A., Allamandola, L. J., Chang, S., & Scharberg, M. A. 1995, ApJ, 454, 327 [NASA ADS] [CrossRef]
- Charnley, S. B., Tielens, A. G. G. M., & Rodgers, S. D. 1997, ApJ, 482, L203 [NASA ADS] [CrossRef]
- d'Hendecourt, L. B., Allamandola, L. J., & Greenberg, J. M. 1985, A&A, 152 130
- Draine, B. T. 1978, ApJS, 36, 595 [NASA ADS] [CrossRef]
- de Jong, T., Boland, W., & Dalgarno, A. 1980, A&A, 91, 68 [NASA ADS] (In the text)
- Flower, D. R. 1999, MNRAS, 305, 651 [NASA ADS] [CrossRef]
- García-Burillo, S., Martín-Pintado, J., Fuente, A., Usero, A., & Neri, R. 2002, ApJ, 575, L55 [NASA ADS] [CrossRef]
- Goicoechea, J. R., & Le Bourlot, J. 2007, A&A, 467, 1 [NASA ADS] [CrossRef] [EDP Sciences]
- Goicoechea, J. R., Pety, J., Gerin, M., et al. 2006, A&A, 456, 565 [NASA ADS] [CrossRef] [EDP Sciences] (In the text)
- Goicoechea, J. R., Pety, J., Gerin, M., et al. 2009, A&A, in press
- González-García, M., Le Bourlot, J., Le Petit, F., & Roueff, E. 2008, A&A, 485, 127 [NASA ADS] [CrossRef] [EDP Sciences]
- Graedel, T. E., Langer, W. D., & Frerking, M. A. 1982, ApJS, 48, 321 [NASA ADS] [CrossRef] (In the text)
- Habart, E., Abergel, A., Walmsley, C. M., Teyssier, D., & Pety, J. 2005, A&A, 437, 177 [NASA ADS] [CrossRef] [EDP Sciences] (In the text)
- Hiraoka, K., Ohashi, N., Kihara, N., et al. 1994, Chem. Phys. Lett., 229, 408 [NASA ADS] [CrossRef]
- Landsberg, B. M., Merer, A. J., & Oka, T. 1977, J. Mol. Spec., 67, 459 [NASA ADS] [CrossRef] (In the text)
- Le Bourlot, J., Pineau Des Forets, G., Roueff, E., & Flower, D. R. 1993, A&A, 267, 233 [NASA ADS]
- Le Petit, F., Nehmé, C, Le Bourlot, J., & Roueff, E. 2006, ApJS, 64, 506 [NASA ADS]
- Linnartz, H., Acharyya, K., Awad, Z., et al. 2007, Molecules in Space and Laboratory, ed. J. L. Lemaire, & F. Combes
- Mallard, et al. 1994, NIST Chemical Kinetics Database, NIST, Gaithersburg, MD (In the text)
- Moore, M. H., Hudson, R. L., & Gerakines, P. A. 2001, Spec. Acta part A, 57, 843 [NASA ADS] [CrossRef]
- Müller, H. S. P., Thorwirth, S., Roth, D. A., & Winnewisser, W. 2001, A&A, 370, L49 [NASA ADS] [CrossRef] [EDP Sciences]
- Müller, H. S. P., Schlöder, F., Stutzki, J., & Winnewisser, W. 2005, J. Mol. Struct., 742, 215 [NASA ADS] [CrossRef]
- Öberg, K. I., Fuchs, G. W., Awad, Z., et al. 2007, ApJ, 662, L23 [NASA ADS] [CrossRef] (In the text)
- Penzias, A. A., & Burrus, C. A. 1973, ARA&A, 11, 51 [NASA ADS] [CrossRef] (In the text)
- Pety, J., Teyssier, D., Fossé, D., et al. 2005, A&A, 435, 885 [NASA ADS] [CrossRef] [EDP Sciences]
- Pety, J. SF2A-2005: Semaine de l'Astrophysique Française, meeting held in Strasbourg, France, ed. F. Casoli, T. Contini, J. M. Hameury, & L. Pagani (EDP Sciences, Conf. Ser.), 721 (In the text)
- Pety, J., Goicoechea, J. R., Hily-Blant, P., Gerin, M., & Teyssier, D. 2007a, A&A, 464, L41 [NASA ADS] [CrossRef] [EDP Sciences] (In the text)
- Pety, J., Goicoechea, J. R., Gerin, M., et al. 2007b, Proceedings of the Molecules in Space and Laboratory conference, ed. J. L. Lemaire, & F. Combes (In the text)
- Philipp, S. D., Lis, D. C., Güsten, R., et al. 2006, A&A, 454, 213 [NASA ADS] [CrossRef] [EDP Sciences]
- Pickett, H. M., Poynter, R. L., Cohen, E. A., et al. 1998, J. Quant. Spectrosc. Rad. Transfer, 60, 883 [CrossRef] (In the text)
- Röllig, M., et al. 2007, A&A, 467, 187 [NASA ADS] [CrossRef] [EDP Sciences] (In the text)
- Schilke, P., Pineau des Forets, G., Walmsley, C. M., & Martín-Pintado, J. 2001, A&A, 372, 291 [NASA ADS] [CrossRef] [EDP Sciences] (In the text)
- Snyder, L. E., Hollis, J. M., & Ulich, B. L. 1976, ApJ, 208, L91 [NASA ADS] [CrossRef] (In the text)
- Snyder, L. E., Schenewerk, M. S., & Hollis, J. M. 1985, ApJ, 298, 360 [NASA ADS] [CrossRef]
- Teyssier, D., Fossé, D., Gerin, M., et al. 2004, A&A, 417, 135 [NASA ADS] [CrossRef] [EDP Sciences]
- Tielens, A. G. G. M., & Whittet, D. C. B. 1997, in Molecules in astrophysics: probe and processes, ed. E. F. van Dishoeck (Dordrecht: Kluwer), 45
- Troe, J. 2007, J. Phys. Chem., 111, 3868
- Tsuboi, T., & Hashimoto, K. 1981, J. Combust. Flame, 42
- van Dishoeck, E. F. 1988, Rate Coefficients in Astrochemistry, ed. T. J. Millar, & D. A. Williams (Dordrecht, Boston: Kluwer Academic Publishers), 49
- Watanabe, N., & Kouchi, A. 2002, ApJ, 571, L173 [NASA ADS] [CrossRef]
- Willacy, K., & Williams, D. A. 1993, MNRAS, 260, 635 [NASA ADS]
- Woodall, J., Agúndez, M., Markwick-Kemper, A. J., & Millar, T. J. 2007, A&A, 466, 1197 [NASA ADS] [CrossRef] [EDP Sciences] (In the text)
- Yin, H. M., Rowling, S. T., Büll, A., & Kable, S. H. 2007, J. Chem. Phys., 064302
Footnotes
- ... surfaces
- Based on observations obtained with the IRAM Plateau de Bure interferometer and 30 m telescope. IRAM is supported by INSU/CNRS (France), MPG (Germany), and IGN (Spain).
- ...
- 30m maps of the ground state lines are only available in electronic form at the CDS via anonymous ftp to cdsarc.u-strasbg.fr (130.79.128.5) or via http://cdsweb.u-strasbg.fr/cgi-bin/qcat?J/A+A/494/977
- ...1,
- Current address: Centro de Astrobiología. Consejo Superior de Investigaciones Científicas, Madrid, Spain.
- ...
- See http://www.iram.fr/IRAMFR/GILDAS for more information about the GILDAS softwares.
- ...
- Publicly available at http://aristote.obspm.fr/MIS/
All Tables
Table 1:
Observation parameters for the maps shown in Figs. 1
and 5. The projection center of all the maps is
![]() ,
,
![]() .
.
Table 2:
Observation parameters for the HCO deep integrations shown in
Fig. 1. Associated transitions can be found in
Table 3. The RA and Dec offsets are computed with
reference to
![]() ,
,
![]() .
The positions are also given in the coordinate
system used to display the maps in Figs. 1
and 5. In this coordinate system, maps are
rotated by 14
.
The positions are also given in the coordinate
system used to display the maps in Figs. 1
and 5. In this coordinate system, maps are
rotated by 14![]() counter-clockwise around the projection center,
located at
counter-clockwise around the projection center,
located at
![]() =
(20'',0''), to bring the
illuminated star direction in the horizontal direction and the
horizontal zero has been set at the PDR edge.
=
(20'',0''), to bring the
illuminated star direction in the horizontal direction and the
horizontal zero has been set at the PDR edge.
Table 3: Einstein coefficients and upper level energies.
Table 4:
Inferred column densities and abundances with respect to
molecular hydrogen, e.g.
![]() .
.
All Figures
| |
Figure 1:
High angular resolution maps of the integrated intensity of
H13CO+, HCO, CCH and vibrationally excited H2 emission.
H13CO+ and HCO have been observed
simultaneously, both with the IRAM-30 m and IRAM-PdBI. Maps have been
rotated by 14 |
| Open with DEXTER | |
| In the text | |
| |
Figure 2:
IRAM-30 m observations (histograms) of several HCO hyperfine components
of the 101-000, 202-101 and 303-202 rotational transitions towards the PDR (``HCO peak'') and towards the
dense core (``DCO+ peak'') Pety et al. (2007a). Solid lines are
single-
|
| Open with DEXTER | |
| In the text | |
| |
Figure 3:
Observations along a horizontal cut through ``the HCO peak'' (histograms).
The H13CO+ J = 1-0 and HCO
101-000 lines were mapped with
the PdBI at an angular resolution of 6.8'', whereas the H13CO+
J = 3-2 line was mapped with HERA-30 m (and smoothed to a spatial
resolution of 13.5''). Radiative transfer models of an edge-on
cloud with a line of sight extinction of
|
| Open with DEXTER | |
| In the text | |
| |
Figure 4:
Photochemical models of a unidimensional PDR.
Upper panels show the density gradient (
|
| Open with DEXTER | |
| In the text | |
| |
Figure 5:
Medium angular resolution maps of the integrated intensity of
the 4 hyperfine components of the fundamental transition of HCO.
These lines have been
observed simultaneously at IRAM-30 m. Maps have been rotated by 14 |
| Open with DEXTER | |
| In the text | |
Copyright ESO 2009
Current usage metrics show cumulative count of Article Views (full-text article views including HTML views, PDF and ePub downloads, according to the available data) and Abstracts Views on Vision4Press platform.
Data correspond to usage on the plateform after 2015. The current usage metrics is available 48-96 hours after online publication and is updated daily on week days.
Initial download of the metrics may take a while.