


| Issue |
A&A
Volume 712, August 2026
|
|
|---|---|---|
| Article Number | C3 | |
| Number of page(s) | 2 | |
| Section | Interstellar and circumstellar matter | |
| DOI | https://doi.org/10.1051/0004-6361/202661829e | |
| Published online | 30 July 2026 | |
A molecule-rich torus-like structure in the 21 μm source IRAS 23304+6147 (Corrigendum)
1
School of Physics and Astronomy, Sun Yat-sen University,
2 Daxue Road, Tangjia, Zhuhai
519082,
Guangdong Province,
China
2
Xinjiang Astronomical Observatory, Chinese Academy of Sciences,
150 Science 1-Street,
Urumqi
830011,
China
3
CSST Science Center for the Guangdong-Hongkong-Macau Greater Bay Area, Sun Yat-Sen University,
Guangdong Province,
China
4
School of physics and astronomy, Yunnan University,
Kunming
650091,
China
5
School of Mathematics and Physics, Jinggangshan University,
28 Xueyuan Road, Qingyuan District, Ji’an
343009,
Jiangxi Province,
China
6
Xinjiang Key Laboratory of Radio Astrophysics,
150 Science 1-Street, Urumqi,
Xinjiang
830011,
China
7
Key Laboratory of Radio Astronomy and Technology, Chinese Academy of Sciences,
A20 Datun Road, Chaoyang District,
Beijing,
100101,
China
★ Corresponding author: This email address is being protected from spambots. You need JavaScript enabled to view it.
Key words: stars: AGB and post-AGB / circumstellar matter / ISM: molecules / planetary nebulae: general / radio lines: ISM / errata, addenda
In the original paper (Sun et al. 2025), the east–west orientation was inadvertently reversed when assigning cardinal directions to several sky-projected images and spatial cuts. The images, coordinate axes, observational data, and model calculations themselves remain unchanged. However, the directional labels and the corresponding descriptions in the text and figure captions should be corrected.
In the standard astronomical orientation adopted by the maps, east is to the left and west is to the right. Consequently, the directions NW, NE, SE, and SW in the affected passages should be replaced by NE, NW, SW, and SE, respectively.
The description of the channel maps in Sect. 3.2 has been corrected as follows. The channel maps of the CO, 13CO, and HC3N lines are shown in Figs. B.1–B.3. An inspection of these maps reveals that the intensity distributions strongly depend on velocity. In the red channels (VLSR > −3 km s−1), the elongated ellipsoid (EE) appears as a bright spot located in the NE region, whereas in the blue channels (VLSR < −29 km s−1), the bright region of the EE is shifted to the SW. The behavior of the equatorial density enhancement (EDE) in the channel maps is opposite to that of the EE. The channel maps of 13CO and HC3N (Figs. B. 2 and B.3) show that the crescent-shaped EDE emission shifts from the SW to the NE from the red to the blue channels (VLSR = −8 to −27 km s−1). This clearly demonstrates that the major axis of the EE is inclined toward us in the SW, and the EE expands faster along the major axis than the EDE.
The corrections to the directional labels and the corresponding descriptions in the captions of Figs. 6, 4, and 7 of the original paper are shown in Figs. 1, 2, and 3, respectively.
The corresponding sentence in Sect. 4.2.1 of the original paper has been corrected as follows. In the direction of the EE major axis (the left panels of Fig. 7), the intensity profiles of the 13CN and HC3N lines are asymmetric, and the peak intensities slightly shift to the SW.
These corrections only involve the cardinal-direction labels and the assignment of the EE’s southwestern side (instead of the southeastern side) as the region inclined toward the observer. All measured line intensities, spatial distributions, velocity structures, model parameters, chemical interpretations, and the conclusions drawn in the original paper remain unchanged.
References
- Sun, H.-M., Zhang, Y., Ouyang, X.-J., et al. 2025, A&A, 696, A102 [NASA ADS] [CrossRef] [EDP Sciences] [Google Scholar]
© The Authors 2026
 Open Access article, published by EDP Sciences, under the terms of the Creative Commons Attribution License (https://creativecommons.org/licenses/by/4.0), which permits unrestricted use, distribution, and reproduction in any medium, provided the original work is properly cited.
This article is published in open access under the Subscribe to Open model. This email address is being protected from spambots. You need JavaScript enabled to view it. to support open access publication.
All Figures
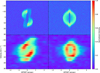 |
Fig. 1 P-V diagrams of the 13CO J = 2–1 transition derived from the modeling (upper panels) and observations (lower panels). The left panels present the velocity structure along the major axis of the EE, oriented from the NE to SW, where negative offsets indicate the NE direction. The right panels show the velocity structure along the minor axis, oriented from the SE to NW, with negative offsets corresponding to the SE direction. The cuts we used to extract these diagrams are detailed in Fig. 2. |
| In the text | |
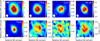 |
Fig. 2 Integrated-intensity (moment-zero) maps of the molecular lines detected in IRAS 23304+6147. The white ellipse in the lower corner represents the synthesized beam. For convenience, the dashed elliptical circles in each panel indicate the main CO emission region, whose semi-major (PA= 30°) and minor axis (PA= 60°) are 1.16″ and 0.84″, respectively, and the dashed straight lines mark the size of the extended CO halo. The NE direction is marked in the upper-left corner of the CO map. |
| In the text | |
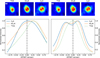 |
Fig. 3 Spatial distributions of the 13CN, HC3N, and C4H molecules. The NE direction is marked in the upper left corner of the 13CN map. The left panels show the molecular line intensity distributions in the major-axis direction, tracking a path from the NE to SW (the offset changes from negative to positive) at a PA of 30° relative to the NS direction. The right panels show the molecular line intensity distributions in the minor-axis direction, tracking a path from the SE to NW (the offset changes from negative to positive) at a PA of 60°. In the upper panels, the dashed lines denote the paths along which the line intensity profiles were extracted. The positions of the phase centers are denoted by the pentagrams in the upper panels and the vertical dashed lines in the lower panels. |
| In the text | |
Current usage metrics show cumulative count of Article Views (full-text article views including HTML views, PDF and ePub downloads, according to the available data) and Abstracts Views on Vision4Press platform.
Data correspond to usage on the plateform after 2015. The current usage metrics is available 48-96 hours after online publication and is updated daily on week days.
Initial download of the metrics may take a while.