| Issue |
A&A
Volume 708, April 2026
|
|
|---|---|---|
| Article Number | C5 | |
| Number of page(s) | 2 | |
| Section | The Sun and the Heliosphere | |
| DOI | https://doi.org/10.1051/0004-6361/202660138e | |
| Published online | 14 April 2026 | |
Coronal dimmings from active region 13664 during the May 2024 solar energetic events (Corrigendum)
1
University of Graz, Institute of Physics, Universitätsplatz 5, 8010, Graz, Austria
2
University of Graz, Kanzelhöhe Observatory for Solar and Environmental Research, Kanzelhöhe 19, 9521, Treffen, Austria
3
NorthWest Research Associates, 3380 Mitchell Lane, Boulder, CO, 80301, USA
4
Skolkovo Institute of Science and Technology, Bolshoy Boulevard 30, Bld. 1, 121205, Moscow, Russia
★ Corresponding author: This email address is being protected from spambots. You need JavaScript enabled to view it.
Key words: errata, addenda / Sun: activity / Sun: corona / Sun: coronal mass ejections (CMEs) / Sun: flares
This corrigendum to Razquin et al. (2025) corrects an inconsistency in the comparison between the total unsigned magnetic flux of the May 2024 events’ coronal dimmings and that of the general dimming population reported by Dissauer et al. (2018). Dissauer et al. (2018) defined the total unsigned magnetic flux of coronal dimmings, ϕ, as ϕ = (ϕ+ + |ϕ−|)/2, whereas in our original analysis we calculated it as ϕ = ϕ+ + |ϕ−|. As a result, the magnetic flux values for the May 2024 events, as well as their temporal derivatives ( ), were overestimated by a factor of two in the comparison. This affects Figs. 7, 9, and E.3 of the original publication, which are shown here corrected in Figs. 1a, 1b–c, and 2, respectively. We also provide a corrected version of Table B.1 of the original paper in Table 1, which includes the revised values of ϕ and
  for each dimming event.
 |
Fig. 1. Corrected versions of Figs. 7 and 9 in the original paper (Razquin et al. 2025): Total unsigned magnetic flux (ϕ) compared to (a) the GOES soft X-ray peak flux, FP, (b) the magnetic dimming area, Aϕ, and (c) the mean unsigned magnetic flux density, Bus. Blue crosses represent dimmings from the May 2024 events, while grey crosses correspond to dimming events from Dissauer et al. (2018). The black (blue) regression lines are fitted exclusively to the grey (blue) data points. |
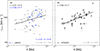 |
Fig. 2. Corrected version of Fig. E.3 in the original paper (Razquin et al. 2025): Correlation plots of the maximum corona mass ejection velocity (vmax) against the dimming magnetic flux rate ( |

Characteristic dimming properties of the on-disc coronal dimmings from AR 13664.
With the adequate definition, the May 2024 events’ dimmings contain magnetic fluxes exceeding 2.77 × 10²¹ Mx, with a mean value of (6.3 ± 2.9)×1021 Mx. Similarly to what was reported in the original paper, these values are considerably larger than those found in the general dimming population by Dissauer et al. (2018), where the mean is (2.44 ± 2.9)×1021 Mx and 66% of the dimmings are below 2.77 × 10²¹ Mx. Figures 1a and 1b show the relationship of the unsigned magnetic flux with the peak GOES flux and the magnetic dimming area, respectively. In both cases, the May 2024 events’ dimmings show higher magnetic fluxes than what would be expected from the general population, although the difference is less pronounced than previously reported.
In addition, event no. 5 in Razquin et al. (2025) was incorrectly associated with an M-class flare. In reality, the flare-dimming corona mass ejection event in active region (AR) 13664 around 14:30 UT on May 5 is more likely related to a C7.5-class flare.
These corrections resulted in minor quantitative changes and do not affect the main conclusions of the paper. In particular, although the revised magnetic flux values are lower, the May 2024 events’ dimmings still exhibit substantially higher magnetic fluxes than typical coronal dimmings, manly due to the strong underlying magnetic field of AR 13664.
Acknowledgments
This project has received funding from the European Union’s Horizon Europe research and innovation programme under grant agreement No 101134999 (SOLER). The research was sponsored by the DynaSun project and has thus received funding under the Horizon Europe programme of the European Union under grant agreement (no. 101131534). Views and opinions expressed are however those of the author(s) only and do not necessarily reflect those of the European Union and therefore the European Union cannot be held responsible for them.
References
- Dissauer, K., Veronig, A. M., Temmer, M., Podladchikova, T., & Vanninathan, K. 2018, ApJ, 863, 169 [NASA ADS] [CrossRef] [Google Scholar]
- Dissauer, K., Veronig, A. M., Temmer, M., & Podladchikova, T. 2019, ApJ, 874, 123 [NASA ADS] [CrossRef] [Google Scholar]
- Razquin, A., Veronig, A. M., Dissauer, K., Podladchikova, T., & Jain, S. 2025, A&A, 699, A40 [NASA ADS] [CrossRef] [EDP Sciences] [Google Scholar]
© The Authors 2026
 Open Access article, published by EDP Sciences, under the terms of the Creative Commons Attribution License (https://creativecommons.org/licenses/by/4.0), which permits unrestricted use, distribution, and reproduction in any medium, provided the original work is properly cited.
This article is published in open access under the Subscribe to Open model. This email address is being protected from spambots. You need JavaScript enabled to view it. to support open access publication.
All Tables
Characteristic dimming properties of the on-disc coronal dimmings from AR 13664.
All Figures
|
Fig. 1. Corrected versions of Figs. 7 and 9 in the original paper (Razquin et al. 2025): Total unsigned magnetic flux (ϕ) compared to (a) the GOES soft X-ray peak flux, FP, (b) the magnetic dimming area, Aϕ, and (c) the mean unsigned magnetic flux density, Bus. Blue crosses represent dimmings from the May 2024 events, while grey crosses correspond to dimming events from Dissauer et al. (2018). The black (blue) regression lines are fitted exclusively to the grey (blue) data points. |
| In the text | |
|
Fig. 2. Corrected version of Fig. E.3 in the original paper (Razquin et al. 2025): Correlation plots of the maximum corona mass ejection velocity (vmax) against the dimming magnetic flux rate ( |
| In the text | |
Current usage metrics show cumulative count of Article Views (full-text article views including HTML views, PDF and ePub downloads, according to the available data) and Abstracts Views on Vision4Press platform.
Data correspond to usage on the plateform after 2015. The current usage metrics is available 48-96 hours after online publication and is updated daily on week days.
Initial download of the metrics may take a while.