


| Issue |
A&A
Volume 711, July 2026
|
|
|---|---|---|
| Article Number | A171 | |
| Number of page(s) | 11 | |
| Section | Atomic, molecular, and nuclear data | |
| DOI | https://doi.org/10.1051/0004-6361/202659643 | |
| Published online | 13 July 2026 | |
Modification of spectral properties of the PAH cations upon cluster formation
1
Institut für Ionenphysik und Angewandte Physik, Universität Innsbruck,
Technikerstr. 25,
6020
Innsbruck,
Austria
2
University of Jena,
Helmholtzweg 3,
07743
Jena,
Germany
★ Corresponding author: This email address is being protected from spambots. You need JavaScript enabled to view it.
Received:
27
February
2026
Accepted:
25
May
2026
Abstract
Context. Polycyclic aromatic hydrocarbons (PAHs) and their clusters are widely invoked as carriers of unidentified infrared bands (UIBs) and are abundant in the interstellar medium (ISM). Although the spectra of individual PAHs have been extensively studied, the spectroscopic properties of ionized PAH clusters remain poorly constrained.
Aims. We investigate how clustering affects the spectral properties of PAH cations and assess the implications of their contribution to the observed infrared (IR) emission and their detectability in astronomical observations.
Methods. Helium-tagging action spectroscopy was performed on cationic clusters of naphthalene, anthracene, and hexabenzocoronene in different spectral ranges. The experimental spectra were analyzed with the support of quantum chemical calculations.
Results. Cluster formation strongly modifies PAH spectra. In the CH stretching region, clustering enhances the 3.3 μηι absorption band by more than an order of magnitude while preserving its position, confirming this band as a robust tracer of both isolated and clustered PAHs. Combination bands contribute significantly to the total intensity of the 3.3 μm band and may be efficiently excited at lower internal energies than fundamental modes. In the middle IR range, the clustering enhances and broadens the vibrational bands and shifts the features in the 7–9 μm region, providing a match with the observed emission in this range. In contrast, clustering has little impact on the position of the bands near the observed 6.2 μm UIBs, which remain significantly redshifted relative to the position of the UIB. This suggests that small classical PAH cations are unlikely carriers of this feature. The match of the positions could be expected for considerably larger PAH cations. However, for such large PAHs, electronic transitions appear in the IR range even for monomeric cations, producing broad and very intense absorptions, which could contribute to the observed infrared continuum emission. Absorption in the ultraviolet (UV), visible (Vis), and near IR (NIR) ranges is strongly attenuated with clustering.
Conclusions. Ionized PAH clusters exhibit spectroscopic signatures that differ significantly from those of isolated PAHs, which must be explicitly considered in models of interstellar emission. The observed mismatch with the 6.2 μm band suggests that small classical PAH cations and their clusters are unlikely to be carriers of the UIBs. Furthermore, the absence of narrow absorption features in the UV–Vis–NIR spectral ranges indicates that PAH cation clusters are also poor candidates for carriers of the diffuse interstellar bands. Only substantially larger PAH cations than those investigated in the present study, as well as their clusters, may exhibit spectral properties consistent with the observed UIBs. Such large PAH cations are also expected to display broad continuum emission in the infrared region arising from electronic transitions.
Key words: methods: laboratory: molecular / ISM: lines and bands / ISM: molecules / infrared: ISM
© The Authors 2026
 Open Access article, published by EDP Sciences, under the terms of the Creative Commons Attribution License (https://creativecommons.org/licenses/by/4.0), which permits unrestricted use, distribution, and reproduction in any medium, provided the original work is properly cited.
This article is published in open access under the Subscribe to Open model. This email address is being protected from spambots. You need JavaScript enabled to view it. to support open access publication.
1 Introduction
Polycyclic aromatic hydrocarbons (PAHs) have been identified in meteorites, indicating their high abundance in the interstellar medium (ISM) (Plows et al. 2003; Zenobi et al. 1989). Direct detection of these nonpolar molecules in space remains challenging, as rotational spectroscopy, which is the most sensitive technique for molecular identification, cannot be applied to the majority of PAHs. Benzene was first identified via its infrared (IR) absorption features (Cernicharo et al. 2001), while indene, which possesses a small but nonzero dipole moment, was detected through rotational spectroscopy (Burkhardt et al. 2021). In both cases, the inferred molecular abundances were significantly higher than expected, suggesting the presence of unknown formation pathways. Additionally, several CN-substituted PAHs have been observed using rotational spectroscopy (McGuire et al. 2021; Wenzel et al. 2024, 2025). Based on the known abundance ratios between bare and CN-substituted species, the abundances of the parent PAHs can be estimated and are found to be substantial. For example, the abundance of pyrene relative to H2 has been inferred to lie between 0.15 and 1.5 × 10⁻⁸, corresponding to up to 0.1% of the total gas-phase carbon budget (Wenzel et al. 2024).
Given their presence in space, PAHs have long been proposed as potential carriers of diffuse interstellar bands (DIBs) (Joblin et al. 1990; Leger & Dhendecourt 1985; Salama et al. 1996). However, despite extensive spectroscopic investigations of neutral Krasnokutski et al. 2005; Staicu et al. 2006) and ionized (Kappe et al. 2023a,c; Meyer et al. 2021) PAHs, no convincing correspondence between specific PAH absorption bands and individual DIBs has been established. The abundances of the species studied to date appear to be below current detection limits. Moreover, experimental work has predominantly focused on relatively small PAHs that can be readily transferred to the gas phase, with a strong emphasis on neutral molecules. Thus, larger PAHs or PAH cations may still represent viable candidates for at least a subset of the DIBs.
Unidentified infrared emission bands (UIBs) (Sellgren et al. 2007; Sturm et al. 2000) are widely attributed to either pure PAHs (Leger & Puget 1984; Allamandola et al. 1985) in the gas phase or mixtures of PAHs with aliphatic organic material in the solid state (Kwok & Zhang 2013). These emission features cannot be reproduced by only a few specific PAH molecules; instead, contributions from various PAH classes and ionization states are generally considered. For example, the prominent 3.3 μm band is associated with aromatic CH stretching modes. The accompanying 3.4 μm emission band, commonly attributed to aliphatic CH bonds (Kwok & Zhang 2013), can be explained within the gas-phase PAH model by considering modified PAHs, such as superhydrogenated species or PAHs with aliphatic side groups. The PAHs are expected to exist in the gas phase as isolated molecules, small clusters, and as components of dust grains (Berné et al. 2022; Compiègne et al. 2011; Rapacioli et al. 2005b; Foschino et al. 2019). Because such mixtures are complex and their spectra depend on numerous poorly constrained parameters, no unambiguous identification of PAHs in space has been achieved solely through comparison with the UIBs.
A major uncertainty arises from the poorly characterized contribution of PAH clusters, whose spectral properties remain largely unexplored. Estimates suggest that isolated PAH cations in neutral regions of the ISM become photostable at sizes of roughly 30–50 carbon atoms, depending on their molecular structure (Jochims et al. 1999; Montillaud et al. 2013). In contrast, even small PAHs are expected to remain stable within clusters or in the solid state, where absorbed photon energy can be redistributed throughout the aggregate, leading to only moderate temperature increases. However, because the intermolecular binding energies in PAH clusters are weaker than the covalent bonds within individual molecules, clusters may evaporate more readily. As a result, PAH clusters are expected to survive preferentially at greater distances from strong UV sources, where clustering can outcompete photodestruction (Rapacioli et al. 2006). Importantly, ionized PAH clusters are predicted to be significantly more stable than their neutral counterparts, enabling them to persist closer to stars and potentially increasing their abundance (Bouvier et al. 2002; Piuzzi et al. 2002).
Despite their expected astrophysical relevance, PAH clusters have been investigated predominantly in theoretical studies (Adkins et al. 2017; Dontot et al. 2020; Rapacioli et al. 2007; Ricca et al. 2013), and experimental spectroscopic data remain scarce. Neutral PAH clusters have been examined in the IR using matrix-isolation spectroscopy, suggesting that they may contribute to the asymmetric red-shaded profile of the interstellar 11.2 μm emission feature (Roser & Ricca 2015).
To address this gap and provide new insight into the spectral properties of ionized PAH clusters, we present He-tagging spectroscopy of several PAHs of different sizes and structures, namely naphthalene (Np, C10H8), anthracene (An, C14H10), and hexabenzocoronene (HBC, C42H18), investigating their cationic clusters across multiple wavelength regions. Our objective is to obtain a general understanding of how clustering modifies the spectral signatures of PAH molecules. The spectroscopic method employed here introduces only minimal perturbation of the positions and profiles of the absorption bands (Kappe et al. 2023c; Krasnokutski et al. 2025), enabling direct comparison between laboratory and astronomical spectra and facilitating targeted searches for these species in astrophysical environments.
 |
Fig. 1 Left: schematic sketch of the experimental setup. Superfluid helium nanodroplets (HNDs) are generated in the cluster source (CS), traverse a skimmer, and are ionized via electron impact (EI) in a subsequent chamber. To pick up PAH dopants (PU), multiply charged HNDs pass through the PAH vapor via either an oven containing HBC or Np/An vapor introduced via an externally heated gas inlet. The resulting clusters are liberated from the He matrix via surface collision (SC). The remaining He-tagged ions are irradiated by a pulsed laser to achieve action spectroscopy, recorded by the reflectron time-of-flight (ToF). Right: exemplary mass spectrum of cationic anthracene ( |

2 Methods
All experiments in this work were carried out using our ClusTOF instrument (see the schematic on the left of Figure 1), where only a few parameters required adjustment to optimize the yield of the corresponding PAH species. The experimental setup used in this work has been described in detail in previous publications (Kappe et al. 2023a,c; Meyer et al. 2021). The basis of He-tagged action spectroscopy is the production of superfluid helium nan-odroplets (HNDs), each consisting of several million He atoms. The HNDs are generated by expanding precooled (8.85–10.1 K) and pressurized (20–25 bar) helium (99.9999% purity) through a 5 μm pinhole nozzle into ultrahigh vacuum (Gomez et al. 2011; Tanyag et al. 2020). To avoid shock waves, the helium droplets pass through a skimmer with a 0.8 mm aperture and are subsequently ionized via electron impact. Similarly to the stagnation pressure and temperature, the electron energy and current are tuned to yield optimal production of the respective PAH species. Electron energies and currents of 25−60 eV and 130−500 μΑ were applied for cationic droplets, producing multiply charged helium droplets (Laimer et al. 2019).
The resulting charge centers, most likely in the form of  or
or  , are distributed near the HND surface and act as nucleation sites for cluster formation (Laimer et al. 2019, 2021), when dopant molecules are picked up from the gas phase. Ion-induced dipole interactions attract the dopants toward these charge centers, and charge transfer produces charged dopant species. As an alternative, Penning ionization could serve as a minor source of ions.
The PAH dopants were introduced into the gas phase either via a home-built resistively heated oven (HBC) or via a gas inlet with an externally heated reservoir (Np and An). Anthracene powder (Sigma-Aldrich, 99% purity) was evaporated at approximately 28 W (roughly 90°C), naphthalene (Sigma-Aldrich, 99.9% purity) at room temperature, and hex-abenzocoronene (synthesized according to (Kappe et al. 2022) by Holger Bettinger, University of Tübingen) at 55 W (roughly 280°C). After formation, the ionic dopant clusters were efficiently released from the helium matrix by collision with a polished stainless-steel surface (Martini et al. 2021), resulting in PAH clusters tagged with up to several hundred He atoms, as shown on the right side of Figure 1. These tagged clusters have suitable masses for detection using our time-of-flight mass spectrometer (ToF-MS; HTOF from Tofwerk AG), which typically provides resolving powers of 2000 m/Δm.
Prior to the extraction of the He-tagged PAH complexes into the ToF, action spectroscopy was performed by irradiating the ions with a tunable pulsed laser (EXPLA NT273-XIR in the 4500–12000 nm range: linewidth <6 cm−1, maximum OPO pulse energy 20 μJ; EXPLA NT277 in the 2500–4475 nm range: linewidth < 10 cm−1, maximum OPO pulse energy 150 μJ; EXPLA NT242 in the UV-Vis range: linewidth <5 cm−1, maximum OPO pulse energy 450 μJ). Laser calibration was performed by a wavelength meter (SHR High-Resolution Wide-Range Wavelength Meter). Standard air wavelengths are given in the text. The laser operates at 1 kHz, whereas the ToF extracts ions at 10 kHz; therefore, every tenth extraction pulse coincides with laser irradiation. This configuration enables direct comparison of ion yields with and without resonant photon absorption. Absorption of resonant photons results in evaporation of the weakly bound helium tags, producing a depletion of the corresponding  ion signal and a simultaneous increase in the bare
  photoproduct. The absorbance A of an ion is defined as the natural logarithm of the laser-on (Ilaser)/laser-off (Ioff) ion ratio, corrected for background (IBG, summed ion signal over the mass spectrum when the laser is off)
![Mathematical equation: $A = {\rm{ln}}\left[ {1 - {{{I_{{\rm{laser}}}} - {I_{{\rm{off}}}}} \over {{I_{{\rm{BG}}}}}}} \right].$](/articles/aa/full_html/2026/07/aa59643-26/aa59643-26-eq6.png) (1)
(1)
To assess the power dependence of the ion signal, we recorded the number of anthracene ions as a function of laser power at 2500 nm. A linear dependence was observed, consistent with the widely assumed proportionality between laser intensity and ionsignal depletion (Kappe et al. 2023a; Meyer et al. 2021). For the final ion yield (Y), the data are hence further normalized for wavelength-dependent changes in the laser power based on the direct correlation between laser power and the number of photons (N)
 (2)
(2)
with an arbitrary scaling factor const. to improve the readability of the resulting numbers. Note that the scaling factor is chosen for each graph separately, resulting in an ion yield that cannot consistently give an estimate of the absorption intensity between different wavelength ranges. Positive values correspond to absorption (increase in the parent ion) and negative intensities denote depletion (loss of He tags or destruction and neutralization of the complex).
Calculations of IR spectra of cationic monomers and dimers of Np, An, and HBC were performed at the BP86+D3/def2TZVP level, employing D3 dispersion correction as suggested by Grimme (Grimme et al. 2010). Electronic states were calculated at the time-dependent density functional theory (TDDFT) level using the TD-B3LYP/6-31+g*//BP86+D3/def2TZVP level of theory. To ensure that our density functional theory (DFT) calculations semi-quantitatively reproduce the physics of the investigated clusters, we performed benchmark calculations for cationic naphthalene dimers, employing the Coulomb-Attenuating Becke, 3-parameter, Lee–Yang–Parr (CAM-B3LYP) functional and the Equation-of-Motion Coupled-Cluster Singles and Doubles (EOM-CCSD) method as the gold standard for calculations of single-reference electronically excited states. The respective benchmark tables are provided in the appendix; see Tables A2 and A3. The results of the TDDFT method for low-lying transitions were found to align fairly well with the EOM-CCSD results in the case of the naphthalene dimer, so the DFT methods are expected to be effective for the larger molecules used in our studies. For benchmarking purposes, IR spectra were also calculated using BP86+D3/def2SVP, B3LYP+D3/def2SVP, and ωB97XD/def2SVP approaches. Anharmonic IR spectra were modeled using the VPT2 approach at the BP86+D3/6-31+g* level. All calculations were performed in Gaussian (Frisch et al. 2016).
3 Results and discussion
3.1 CH stretching region
Clustering has the most pronounced impact on the spectra of PAH cations in the CH stretching region. Figure 2 compares the spectra of monomeric and dimeric Np+, An+, and HBC+ in the wavelength range corresponding to the UIB at 3.3 μm. No detectable absorption is observed for the monomeric Np+ and An+, consistent with the well-known suppression of CH stretching band intensities upon ionization (Pathak & Rastogi 2005; Reider et al. 2025). This effect arises from reduced dipole moment changes along the CH bonds following charge redistribution. This attenuation depends on the size of the PAHs. For the molecules considered here, the computational results from the NASA Ames IR PAH database Ricca et al. (2025) yield values of 114 for Np, 25 for An, and 1.9 for HBC. However, attenuation is also sensitive to molecular structure and therefore can remain significant even for substantially larger PAHs (Pathak & Rastogi 2007).
Cluster formation leads to the appearance of pronounced absorption bands in this region. Both  and
and  exhibit clearly detectable CH stretching bands, with intensities at least about ten times greater than those of the corresponding monomers. The real ratio is likely higher. This estimated number is based on the fact that the measurements were conducted under conditions where monomeric ions are most abundant in the beam, as can be seen in Figure 1, as well as the estimate that the absorption band of the monomeric species would be detectable above the noise level in the experiment. Furthermore, we assumed that the widths of the monomeric absorption bands are the same as or smaller than those for clusters. For
  , absorption is confined to the vicinity of 3.3 μm, whereas
  additionally exhibits features between 3.5 and 4.5 μm that cannot be assigned to fundamental vibrations and are therefore attributed to combination and overtone bands. The complete list of all IR absorption bands found in the experiment is given in Table 1.
To interpret these observations, anharmonic vibrational calculations were performed for An+ and  . The computed results shown in Figure 3 demonstrate that the combination bands also contribute significantly to the absorption of isolated An+ , in agreement with previous results for neutral PAHs (Chen 2018). These bands arise primarily from combinations of C=C stretching modes located at lower frequencies. For example, the strongest calculated combination band corresponds to the modes at 1545 and 1583 cm−1 (6.47 and 6.32 μm).
Cluster formation enhances the intensities of both the fundamental and combination bands. The calculations predict that the absorption intensity of the fundamental CH stretching of  will increase by a factor of approximately 17 relative to An+, while the intensities of the combinational bands in this range will increase only slightly. A similar enhancement was found for all isomers of
  considered in our calculations. This considerably underestimates the observed enhancement of the intensities of the combination bands in experiments. The latter achieves intensities similar to fundamental CH stretching bands in the experimental spectra. Consequently, we can also expect their large contribution to the 3.3 μm band. Computations show that the broad absorption near 3.3 μm has two components. Combination bands dominate the low-energy side of this structure, whereas the high-energy region is associated mainly with fundamental CH stretching modes. The discrepancy between the calculated and measured relative intensities likely reflects strong vibronic coupling effects, which enhance infrared absorption through coupling between electronic and nuclear motion, as previously reported for fullerene dimer cations (Kappe et al. 2023b). This coupling occurs because the lowest electronic transition in clusters of PAH cations or large monomeric PAH cations appears in this range, as discussed below.
In addition to discrete vibrational bands, all clusters exhibit a broad absorption feature extending towards higher energies. This feature is attributed to the low-energy wing of the absorption bands associated with an electronic transition, most likely the D1/D2 ← D0 one. Calculations indicate that these transitions involve excitations to the highest occupied molecular orbital (HOMO) from HOMO–1 and HOMO–2. The oscillator strength of electronic transitions is often much greater than that of purely vibrational transitions. This results in very strong absorption observed in the IR range. Such very broad charge-resonance transitions in the near-infrared (NIR) range have been previously observed for  and 2-methyl-
 by photodissociation spectroscopy Friha et al. (2012); Bernard et al. (2024). Although such bands are not directly measured in this work, their low-energy tails may contribute to the observed continuumlike absorption. Structural isomers, on the other hand, have been shown to become increasingly relevant at elevated temperatures Bernard et al. (2024). The very low internal temperatures in our helium-tagging experiments strongly limit thermally induced structural conversions between isomers. Furthermore, cationic clusters in our experiments are produced by the ionization of neutral PAH clusters formed within HNDs. This process anneals the clusters, which are then rapidly cooled. This is expected to favor the formation of the most stable structures. Therefore, the contribution of multiple isomers and their effect of additional band broadening is expected to be reduced.
For  , our calculations predict two nearly isoenergetic stacked isomers, analogous to what was previously reported Rapacioli et al. (2005a); Lemmens et al. (2021). Both isomers exhibit parallel π-stacked arrangements of the Np molecules. In the lowest-energy configurations, the long molecular axes are oriented perpendicular to each other, as illustrated in Figure A.2, whereas in another isomer they remain parallel. The energies of the first electronic transitions span the range of 0.83–1.4 μm, depending on both the isomeric form and the computational level of theory employed. The complete list of calculated electronic transitions can be seen in Tables A1–A3. For the lowest energy isomer, the difference in found values is also significant, varying between 0.83 and 1.1 μm. This significant change reflects the generally low accuracy of computational methods in determining the energy of electronic transitions. This issue is particularly relevant for weakly bonded structures, such as dimers. To produce the observed absorption extending toward 2.5 μm, substantial lifetime broadening is required, corresponding to the longest excited-state lifetimes on the order of 5 × 10⁻¹⁵ s. Such ultra-fast relaxation is in line with strong vibronic coupling in PAH cations (Lee et al. 2021; Marciniak et al. 2015). We note that the lifetime measurements were performed on PAH cations in highly excited states. Our results are therefore the first indication of such ultrafast relaxation of lower excited states in PAH cation clusters, a finding that still requires verification by direct measurements. A similar situation is observed for the
  ion, for which the first electronic transition was calculated to occur at wavelengths of 1.7 and 1.2 μm using the same levels of theory. As expected, increasing molecular size shifts the electronic transitions towards lower energies, resulting in broader and more intense absorption in the measured range.
For HBC+, electronic absorption in the IR is already present for monomers due to its larger size. As shown in Fig. 2, both HBC+ and  exhibit broad absorption features in the 2.5–3 μm range. The calculations predict electronic transitions near 2 and 3 μm, consistent with the observed spectral envelope. In contrast to smaller PAHs, cluster formation has only a minor effect on the vibrational absorption intensities of HBC, reflecting weaker perturbations of CH stretching modes in the stacked cluster geometry.
The spectra of larger clusters closely resemble those of the corresponding dimers (Fig. 4). The broad electronic absorption feature remains largely unchanged with increasing cluster size, while the vibrational bands exhibit progressive broadening and reduced peak intensity. This behavior likely reflects the increasing number of structural isomers contributing to the measured spectra.
Importantly, the fundamental CH stretching bands near 3.3 μm remain well defined and show only minor shifts, indicating that intermolecular interactions in PAH clusters do not strongly perturb individual CH bonds. This observation is consistent with stacked geometries dominated by π–π interactions (Rapacioli et al. 2006). In contrast, combination bands broaden significantly with increasing cluster size due to increased structural diversity and associated spectral congestion.
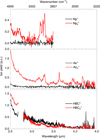 |
Fig. 2 Comparison of the IR absorption spectra of the monomers (black line) and dimers (red line) of the Np, An, and HBC cations in the region of the CH stretching vibrations. Missing data ranges are due to insufficient laser power. Note that the ion yields are denoted in arbitrary units that cannot be compared across the different ion species. |
Experimental positions of the most prominent IR absorption bands of PAH cations.
 |
Fig. 3 Calculated BP86-D3/6-31+G(d) anharmonic IR absorption spectra and molecular structures of An+ and |

 |
Fig. 4 IR absorption spectra of |


3.2 Mid-IR range
Figure 5 shows the spectra of  and
and  in the region of C=C stretching and CH in-plane bending vibrations, which correspond to the strongest vibrational modes of PAH cations. Cluster formation enhances the intensities of C=C stretching bands in
  , in agreement with theoretical predictions. A similar enhancement of in-plane C=C vibrational modes in the 1400–2000 cm−1 region upon clustering has been reported in theoretical studies on cationic pyrene clusters by Dontot et al. (2020), indicating that this behavior may be a common feature of PAH aggregation. The spectra of different cluster sizes remain similar, with the primary effect of increasing the cluster size being spectral broadening. This broadening reflects the presence of multiple isomers with slightly different vibrational frequencies.
Cluster formation activates additional vibrational modes that are not observed in the monomer spectrum. In particular, strong absorption bands appear at 1541 cm−1 (6.49 μm) and 1485 cm−1 (6.7 μm), assigned to combinations of CH in-plane bending and C=C stretching modes. These bands remain intense across all measured cluster sizes, making them promising spectroscopic markers for ionized clusters of small PAHs.
In contrast, HBC cations show only modest spectral changes upon clustering. The data of the monomer, HBC+, can be compared to the infrared multiphoton dissociation spectra and the accompanying DFT computation of Zhen et al. (2017), and are consistent with their prediction of the strongest bands. Upon dimerization, the overall band positions remain largely unchanged, indicating that intermolecular interactions in these larger systems have a limited effect on vibrational frequencies. A rather surprising result is that the bandwidth decreased considerably upon cluster formation. However, considering the low signal-to-noise ratio, this result should still be verified in future measurements.
 |
Fig. 5 IR absorption spectra of |


UV–Vis absorption wavelengths of cationic PAHs (Å).
 |
Fig. 6 Comparison of the absorption spectra of An+ and |

3.3 UV-Vis-NIR ranges
The complete list of all band positions in this region is given in Table 2. The absorption spectra in the UV–Vis–NIR range arise from electronic transitions. The spectrum of An+ (Fig. 6) shows a strong band near 707 nm, previously assigned to the D2(0) ← D0(0) transition (Meyer et al. 2021). Additional weaker bands in the visible region correspond to vibronic progressions and transitions to higher electronic states, including a strong D6(0) ← D0(0) near 348 nm. The D6(0) ← D0(0) absorption band near 421 nm is relatively weak compared to other electronic transitions (Szczepanski et al. 1993; Meyer et al. 2021).
Cluster formation results in a substantial reduction in absorption intensity across the entire spectral range for all observed electronic transitions. Since this could potentially be due to cluster fragmentation after the absorption of energetic photons, we also recorded the depletion spectra by monitoring the ion signal on the masses An+He1-40 and An+He1-40, as shown in Figure 6. In depletion mode, we also observed considerable attenuation of absorption upon cluster formation. However, this attenuation is much less pronounced, particularly in the NIR range of the spectrum. Unfortunately, this measurement mode provides a poor S/N. However, in the UV range, absorption is still very weak. Electronic transitions in this range usually have little dependence on intermolecular interaction as they involve transitions from inner orbitals. The only other possible explanation is almost spontaneous and highly efficient luminescence, which prevents the excitation of the vibrations and thus the destruction of weakly bonded clusters. Therefore, further studies are required to obtain unbiased information on the absorption of the PAH cluster cations in the UV and VIS ranges.
The spectrum of HBC+, measured here for the first time in this spectral region, exhibits broad absorption features in the visible range and several narrow bands in the NIR (Fig. 7). Calculations predict three electronic transitions D6 D0, D7 D0, D8 D0, falling in this range. The positions of transitions in the Franck-Condon point are predicted to lie at 740 nm (f=0.034), 734 nm (f=0.039) and 697 nm (f=0.087), respectively. Therefore, the strong absorption band at 828.4 nm could be assigned to the D6(0) D0(0) transition, and the bands on the blue side could belong to the vibronic bands of this electronic transition, as well as be associated with the D7 D0 electronic transition. As observed for anthracene, cluster formation leads to a marked reduction in absorption intensity, indicating that ionized PAH clusters are unlikely to produce strong, narrow absorption features in this wavelength range.
 |
Fig. 7 Comparison of the absorption spectra of HBC+ and HBC+ cations in the region of electronic transitions. Due to the varying laser power, the ion yield in the different wavelength regions cannot be compared with each other and with Fig. 6. |
4 Astrophysical implications
The spectra reported in this work correspond to cold action spectroscopy, whereas the UIBs arise from infrared emission of vibrationally excited PAHs following UV photon absorption. Anharmonic effects can lead to shifts and broadening of emission bands compared to low-temperature absorption spectra. In most cases, a shift to the red below 0.06 μm was found at elevated temperatures compared to low-temperature measurements (Joblin et al. 1995). Despite these differences, gas-phase absorption spectra currently provide the most direct experimental tool for accessing the intrinsic vibrational properties of PAHs and serve as the best reference data before accounting for temperature effects.
Cluster formation has a profound impact on the spectral properties of PAH cations and must therefore be considered when interpreting astronomical spectra and modeling the UIBs. Since clustered PAHs are expected to be abundant under interstellar conditions (Rapacioli et al. 2005b), their spectral signatures may contribute significantly to the observed emission.
The most pronounced effect of clustering is observed in the CH stretching region near 3.3 μι^ The position of this band remains largely independent of the cluster size and molecular structure, confirming its robustness as a tracer of PAHs in both isolated and clustered forms. However, cluster formation leads to a substantial increase in band intensity, particularly for small PAHs, which are known to be abundant in the ISM. The enhanced absorption and emission at 3.3 μm may therefore serve as an indicator of PAH clustering in astrophysical environments.
A significant fraction of the intensity in this region arises from combination bands, which can be excited at lower internal energies than the fundamental CH stretching modes. Since interstellar PAH emission is typically caused by single-photon excitation followed by vibrational relaxation, disregarding combination bands could lead to an overestimation of PAH temperatures and consequently to an overestimation of the fraction of small PAHs. This is because small PAHs can be heated to higher temperatures by single-photon absorption.
Cluster formation also affects electronic transitions, which shift toward longer wavelengths and produce broad absorption extending into the infrared even for small PAHs. It was found that the absorption due to such electronic transitions was extremely broad. Because electronic transitions generally have much larger oscillator strengths than vibrational transitions, their redshift into the infrared may contribute to the continuum emission underlying the UIBs. In several astronomical sources, a rising infrared continuum has been observed starting at wavelengths of approximately 5 μm (Foschino et al. 2019). This continuum is often removed before spectral analysis, but it may contain valuable information about the abundance and distribution of large PAH cations and their clusters.
In the mid-IR range, clustering modifies both the positions and intensities of vibrational bands. The strong absorption bands observed near 6.49 μm for cationic An clusters and near 6.36 μm for HBC cations are significantly redshifted relative to the 6.2 μm UIB. Since cluster formation has little impact on the position of this band, small classical PAH cations and their clusters are unlikely to be the dominant carriers of this feature. This suggests that the 6.2 μm band may instead originate from larger PAH cations. If we assume the same shift of this absorption band as observed moving from An+ to HBC+, also for larger PAH cations, the correct position of the absorption band would be achieved for PAH cations that have about 84 carbon atoms. However, with the increase in the size of PAH cations, this shift is expected to be reduced as follows from a considerably larger shift coming from Np+ to An+ found in computations. This means that considerably larger PAH cations should be involved, probably having about a hundred or more C atoms. Alternative explanations could be that this emission arose from non-classical PAHs containing aliphatic components (Pino et al. 2008) or heteroatom-substituted species (Hudgins et al. 2005). For example, recent work by Maragkoudakis et al. (2025) demonstrates good agreement between observational and simulated spectra when an extended range of PAH species is considered, including nitrogen-containing PAHs. However, this agreement requires the abundance of the most stable classical PAHs, such as those measured in this work, to be relatively low, since they are expected to emit outside the observed 6.2 μm band.
In contrast, there is a better agreement of our spectra with observed emission in the 7–9 μm region. The positions of the absorption bands shift with both molecular size and cluster formation, and the combination of multiple overlapping bands produces a broad spectral structure consistent with the observed 7.7 μm UIB. In addition, some bands present in monomer spectra weaken or disappear upon clustering, resulting in better overall agreement with astronomical emission profiles. Therefore, in this range, there is a principal match between the observational and laboratory spectra of PAH cations and their clusters.
Cluster formation also leads to an increase in band broadening, which likely reflects the presence of multiple structural isomers. Bands that are weakly affected by intermolecular interactions remain relatively narrow, while bands that shift significantly upon clustering exhibit pronounced broadening. This behavior further contributes to the formation of broad emission features characteristic of astronomical spectra.
In the UV–Vis–NIR range, cluster formation results in a substantial reduction in absorption intensity. Consequently, ionized PAH clusters are unlikely to produce strong, narrow absorption features detectable as DIBs. The electronic spectrum of HBC+, measured here for the first time in this spectral region, exhibits narrow transitions in the NIR that do not correspond to any known DIBs Fan et al. (2019). This suggests that even large classical PAH cations are unlikely to be detectable through their electronic absorption features under typical interstellar conditions.
Overall, these results demonstrate that cluster formation significantly modifies the spectral signatures of PAH cations and must be taken into account when interpreting astronomical spectra. Ionized PAH clusters are likely to contribute to the intensity and structure of several UIB features, particularly in the 3.3 and 7.7 μm regions, as well as to the IR continuum. At the same time, their spectral properties suggest that they are unlikely to be major contributors to the 6.2 μm band or to narrow DIBs.
5 Conclusions
We have investigated the vibrational and electronic spectra of ionized clusters of naphthalene, anthracene, and hexabenzo-coronene using helium-tagging spectroscopy over a broad spectral range from mid-IR (6–11 μm), near-IR (2.5–4.5 μm) to the near UV-visible (300–900 nm). These measurements provide direct experimental insight into how cluster formation modifies the spectroscopic properties of PAH cations and their potential astrophysical signatures.
Cluster formation strongly affects both vibrational and electronic absorption. The most pronounced effect is observed in the CH stretching region near 3.3 μm, where clustering enhances absorption intensities by more than an order of magnitude while leaving band positions largely unchanged. This confirms that the 3.3 μm band remains a reliable tracer of PAHs regardless of the aggregation state, while demonstrating that clustering can substantially increase its emission strength. In addition, combination bands in the 3.3–4.5 μm region contribute significantly to the total intensity and can be excited at lower internal energies, which may affect interpretations of interstellar emission and inferred PAH size distributions. In the mid-IR range, the dominant bands observed near 6.4 μm remain significantly redshifted relative to the astronomical 6.2 μm emission band, indicating that small classical PAH cations and their clusters are unlikely to be their primary carriers.
Cluster formation also strongly modifies electronic absorption. Electronic transitions shift toward longer wavelengths and produce broad absorption that extends into the IR continuum. At the same time, absorption in the UV–visible range is significantly reduced, implying that ionized PAH clusters are unlikely to produce strong narrow features detectable as DIBs. The spectrum of HBC+ measured here further indicates that even large classical PAH cations are unlikely to be detected through narrow electronic transitions.
Overall, our results demonstrate that ionized PAH clusters possess distinct spectroscopic properties that must be considered when interpreting interstellar IR emission. Cluster formation can significantly enhance the intensity of key vibrational bands, contribute to broad emission structures, and generate IR continuum absorption through low-lying electronic transitions. These findings highlight the importance of including clustered PAHs in astrophysical models and provide laboratory benchmarks for identifying their spectroscopic signatures in astronomical environments.
Data availability
Tables 1 and 2 are available at the CDS via https://cdsarc.cds.unistra.fr/viz-bin/cat/J/A+A/711/A171. The data underlying this article are available in the Zenodo repository under the DOI https://doi.org/10.5281/zenodo.1866782010.5281/zenodo.18667820.
Acknowledgements
The work was supported by the FWF (Grant-DOI 10.55776/I6221 and 10.55776/W1259). S.A.K. is grateful for the support of the Max Planck Institute for Astronomy and the Deutsche Forschungsgemeinschaft DFG (grant No. 413610339). This article is based on work from COST Actions CA18212–Molecular Dynamics in the GAS phase (MD-GAS) and CA21101–Confined Molecular Systems: From a New Generation of Materials to the Stars (COSY), supported by COST (European Cooperation in Science and Technology). The computational results presented have been obtained using the HPC infrastructure LEO of the University of Innsbruck.
References
- Adkins, E. M., Giaccai, J. A., & Miller, J. H. 2017, Proc. Comb. Inst., 36, 957 [Google Scholar]
- Allamandola, L., Tielens, A., & Barker, J. 1985, ApJ, 290, L25 [NASA ADS] [CrossRef] [Google Scholar]
- Bernard, J., Martin, S., Al-Mogeeth, A., et al. 2024, PCCP, 26, 18571 [Google Scholar]
- Berné, O., Habart, É., Peeters, E., et al. 2022, Publ. Astron. Soc. Pac., 134, 22 [Google Scholar]
- Bhattacharjee, R., Jervis, H., McCormack, M. E., Petrukhina, M., & Kertesz, M. 2024, JACS, 146, 10465 [Google Scholar]
- Bouvier, B., Brenner, V., Millié, P., & Soudan, J. M. 2002, JPCA, 106, 10326 [Google Scholar]
- Burkhardt, A. M., Long Kelvin Lee, K., Bryan Changala, P., et al. 2021, ApJ, 913, L18 [NASA ADS] [CrossRef] [Google Scholar]
- Cernicharo, J., Heras, A. M., Tielens, A. G. G. M., et al. 2001, ApJ, 546, L123 [Google Scholar]
- Chen, T. 2018, ApJS, 238, 18 [Google Scholar]
- Compiègne, M., Verstraete, L., Jones, A., et al. 2011, A&A, 525, A103 [Google Scholar]
- Dontot, L., Spiegelman, F., Zamith, S., & Rapacioli, M. 2020, Europ. Phys. J. D, 74, 216 [Google Scholar]
- Fan, H., Hobbs, L. M., Dahlstrom, J. A., et al. 2019, ApJ, 878, 151 [NASA ADS] [CrossRef] [Google Scholar]
- Foschino, S., Berné, O., & Joblin, C. 2019, A&A, 632, A84 [EDP Sciences] [Google Scholar]
- Friha, H., Féraud, G., Pino, T., et al. 2012, EAS Publ. Ser., 58, 373 [Google Scholar]
- Frisch, M. J., Trucks, G. W., Schlegel, H. B., et al. 2016, Gaussian~16 Revision A.03 (Wallingford CT: Gaussian Inc.) [Google Scholar]
- Gomez, L. F., Loginov, E., Sliter, R., & Vilesov, A. F. 2011, JCP, 135, 154201 [Google Scholar]
- Grimme, S., Antony, J., Ehrlich, S., & Krieg, H. 2010, JCP, 132, 154104 [Google Scholar]
- Hudgins, D. M., Bauschlicher, C. W., & Allamandola, L. J. 2005, ApJ, 632, 316 [NASA ADS] [CrossRef] [Google Scholar]
- Joblin, C., Maillard, J. P., Dhendecourt, L., & Leger, A. 1990, Nature, 346, 729 [NASA ADS] [CrossRef] [Google Scholar]
- Joblin, C., Boissel, P., Leger, A., d’Hendecourt, L., & Defourneau, D. 1995, A&A, 299, 835 [Google Scholar]
- Jochims, H. W., Baumgärtel, H., & Leach, S. 1999, ApJ, 512, 500 [NASA ADS] [CrossRef] [Google Scholar]
- Kappe, M., Calvo, F., Schöntag, J., et al. 2022, Molecules, 27, 6764 [Google Scholar]
- Kappe, M., Rasul, B., Mahmoodi-Darian, M., et al. 2023a, Mol. Phys., 122, e2202271 [Google Scholar]
- Kappe, M., Schiller, A., Gruber, E., et al. 2023b, JCP, 159, 204302 [Google Scholar]
- Kappe, M., Schiller, A., Zappa, F., et al. 2023c, A&A, 672, A4 [NASA ADS] [CrossRef] [EDP Sciences] [Google Scholar]
- Krasnokutski, S., Rouillé, G., & Huisken, F. 2005, CPL, 406, 386 [Google Scholar]
- Krasnokutski, S. A., Ganner, L., Ončák, M., et al. 2025, ApJ, 982, 34 [Google Scholar]
- Kwok, S., & Zhang, Y. 2013, ApJ, 771, 5 [NASA ADS] [CrossRef] [Google Scholar]
- Laimer, F., Kranabetter, L., Tiefenthaler, L., et al. 2019, PRL, 123, 165301 [Google Scholar]
- Laimer, F., Zappa, F., & Scheier, P. 2021, JPCA, 125, 7662 [Google Scholar]
- Lee, J. W. L., Tikhonov, D. S., Chopra, P., et al. 2021, Nat. Comm., 12, 1 [NASA ADS] [CrossRef] [Google Scholar]
- Leger, A., & Dhendecourt, L. 1985, A&A, 146, 81 [NASA ADS] [Google Scholar]
- Leger, A., & Puget, J. L. 1984, A&A, 137, L5 [Google Scholar]
- Lemmens, A. K., Chopra, P., Garg, D., et al. 2021, Mol. phys., 119, e1811908 [Google Scholar]
- Maragkoudakis, A., Boersma, C., Temi, P., et al. 2025, ApJ, 979, 90 [Google Scholar]
- Marciniak, A., Despré, V., Barillot, T., et al. 2015, Nat. Comm., 6, 1 [Google Scholar]
- Martini, P., Albertini, S., Laimer, F., et al. 2021, PRL, 127, 263401 [Google Scholar]
- McGuire, B. A., Loomis, R. A., Burkhardt, A. M., et al. 2021, Science, 371, 1265 [Google Scholar]
- Meyer, M., Martini, P., Schiller, A., et al. 2021, ApJ, 913, 136 [NASA ADS] [CrossRef] [Google Scholar]
- Montillaud, J., Joblin, C., & Toublanc, D. 2013, A&A, 552, A15 [NASA ADS] [CrossRef] [EDP Sciences] [Google Scholar]
- Pathak, A., & Rastogi, S. 2005, Proc. Int. Astron. Union., 235, 133 [Google Scholar]
- Pathak, A., & Rastogi, S. 2007, Spectrochim. Acta A Mol. Biomol. Spectrosc., 67, 898 [Google Scholar]
- Pino, T., Dartois, E., Cao, A. T., et al. 2008, A&A, 490, 665 [CrossRef] [EDP Sciences] [Google Scholar]
- Piuzzi, F., Dimicoli, I., Mons, M., et al. 2002, CP, 275, 123 [Google Scholar]
- Plows, F. L., Elsila, J. E., Zare, R. N., & Buseck, P. R. 2003, Geochim. Cosmochim. Acta., 67, 1429 [Google Scholar]
- Podeszwa, R., & Szalewicz, K. 2008, PCCP, 1019, 2735 [Google Scholar]
- Rapacioli, M., Calvo, F., Spiegelman, F., Joblin, C., & Wales, D. 2005a, JPCA, 109, 2487 [Google Scholar]
- Rapacioli, M., Joblin, C., & Boissel, P. 2005b, A&A, 429, 193 [NASA ADS] [CrossRef] [EDP Sciences] [Google Scholar]
- Rapacioli, M., Calvo, F., Joblin, C., et al. 2006, A&A, 460, 519 [NASA ADS] [CrossRef] [EDP Sciences] [Google Scholar]
- Rapacioli, M., Calvo, F., Joblin, C., Parneix, P., & Spiegelman, F. 2007, JPCA, 111, 2999 [Google Scholar]
- Reider, A. M., Kappe, M., Schmidt, M., et al. 2025, Mol. Phys., e2568076 [Google Scholar]
- Ricca, A., Bauschlicher, C., & Allamandola, L. J. 2013, ApJ, 776, 102 [Google Scholar]
- Ricca, A., Boersma, C., Maragkoudakis, A., et al. 2025, ApJS, 282, 7 [Google Scholar]
- Roser, J. E., & Ricca, A. 2015, ApJ, 801, 108 [Google Scholar]
- Salama, F., Bakes, E. L. O., Allamandola, L. J., & Tielens, A. G. G. M. 1996, ApJ, 458, 621 [NASA ADS] [CrossRef] [Google Scholar]
- Saragi, R., Calabrese, C., Juanes, M., et al. 2022, JPCL, 14, 207 [Google Scholar]
- Sellgren, K., Uchida, K. I., & Werner, M. W. 2007, ApJ, 659, 1338 [Google Scholar]
- Staicu, A., Krasnokutski, S., Rouillé, G., Henning, T., & Huisken, F. 2006, J. Mol. Struct., 786, 105 [NASA ADS] [CrossRef] [Google Scholar]
- Sturm, E., Lutz, D., Tran, D., et al. 2000, A&A, 358, 481 [NASA ADS] [Google Scholar]
- Szczepanski, J., Vala, M., Talbi, D., Parisel, O., & Ellinger, Y. 1993, JCP, 98, 4494 [Google Scholar]
- Tanyag, R. M. P., Feinberg, A. J., O’Connell, S. M. O., & Vilesov, A. F. 2020, JCP, 152, 234306 [Google Scholar]
- Wenzel, G., Cooke, I. R., Changala, P. B., et al. 2024, Science, 386, 810 [NASA ADS] [CrossRef] [Google Scholar]
- Wenzel, G., Gong, S., Xue, C., et al. 2025, ApJ, 984, L36 [Google Scholar]
- Yurtsever, E. 2009, JPCA, 113, 924 [Google Scholar]
- Zenobi, R., Philippoz, J. M., Buseck, P. R., & Zare, R. N. 1989, Science, 246, 1026 [Google Scholar]
- Zhen, J., Castellanos, P., Bouwman, J., Linnartz, H., & Tielens, A. G. G. M. 2017, ApJ, 836, 28 [Google Scholar]
Appendix A Computational results
Figure A.1 shows the computed harmonic IR spectra in the full range for all cations. As can be seen, the computational results are in general agreement with the experimental spectra shown in the main part. The CH stretching vibrations near 3.3 μm (3030 cm−1) are attenuated in the spectra of monomeric cations and are enhanced upon cluster formation, although to a lesser extent than observed in experiments. Since no scaling has been applied to the computational spectra, these bands appear at somewhat higher energies compared to the experiment. The position of a strong absorption band near 6.2 μm (1613 cm−1) shifts to the blue, moving to larger cations that potentially may allow reaching the position of the observed 6.2 μm UIB.
 |
Fig. A.1 Calculated IR harmonic spectra for PAH cations |
Figure A.2 shows the molecular geometries of the cationic dimers, which were used to compute the spectral parameters. This configuration of π-stacked, slightly shifted PAH dimers as the energetically most favorable isomers is well known in the literature Saragi et al. (2022); Podeszwa & Szalewicz (2008); Yurtsever (2009); Bhattacharjee et al. (2024).
 |
Fig. A.2 The calculated geometries of cationic PAH dimers used for the spectra computations. |
Calculated wavelengths of electronic transitions.
Calculated wavelengths of electronic transitions.
Calculated wavelengths of electronic transitions.
All Tables
All Figures
|
Fig. 1 Left: schematic sketch of the experimental setup. Superfluid helium nanodroplets (HNDs) are generated in the cluster source (CS), traverse a skimmer, and are ionized via electron impact (EI) in a subsequent chamber. To pick up PAH dopants (PU), multiply charged HNDs pass through the PAH vapor via either an oven containing HBC or Np/An vapor introduced via an externally heated gas inlet. The resulting clusters are liberated from the He matrix via surface collision (SC). The remaining He-tagged ions are irradiated by a pulsed laser to achieve action spectroscopy, recorded by the reflectron time-of-flight (ToF). Right: exemplary mass spectrum of cationic anthracene ( |
| In the text | |
|
Fig. 2 Comparison of the IR absorption spectra of the monomers (black line) and dimers (red line) of the Np, An, and HBC cations in the region of the CH stretching vibrations. Missing data ranges are due to insufficient laser power. Note that the ion yields are denoted in arbitrary units that cannot be compared across the different ion species. |
| In the text | |
|
Fig. 3 Calculated BP86-D3/6-31+G(d) anharmonic IR absorption spectra and molecular structures of An+ and |
| In the text | |
|
Fig. 4 IR absorption spectra of |
| In the text | |
|
Fig. 5 IR absorption spectra of |
| In the text | |
|
Fig. 6 Comparison of the absorption spectra of An+ and |
| In the text | |
|
Fig. 7 Comparison of the absorption spectra of HBC+ and HBC+ cations in the region of electronic transitions. Due to the varying laser power, the ion yield in the different wavelength regions cannot be compared with each other and with Fig. 6. |
| In the text | |
|
Fig. A.1 Calculated IR harmonic spectra for PAH cations |
| In the text | |
|
Fig. A.2 The calculated geometries of cationic PAH dimers used for the spectra computations. |
| In the text | |
Current usage metrics show cumulative count of Article Views (full-text article views including HTML views, PDF and ePub downloads, according to the available data) and Abstracts Views on Vision4Press platform.
Data correspond to usage on the plateform after 2015. The current usage metrics is available 48-96 hours after online publication and is updated daily on week days.
Initial download of the metrics may take a while.