


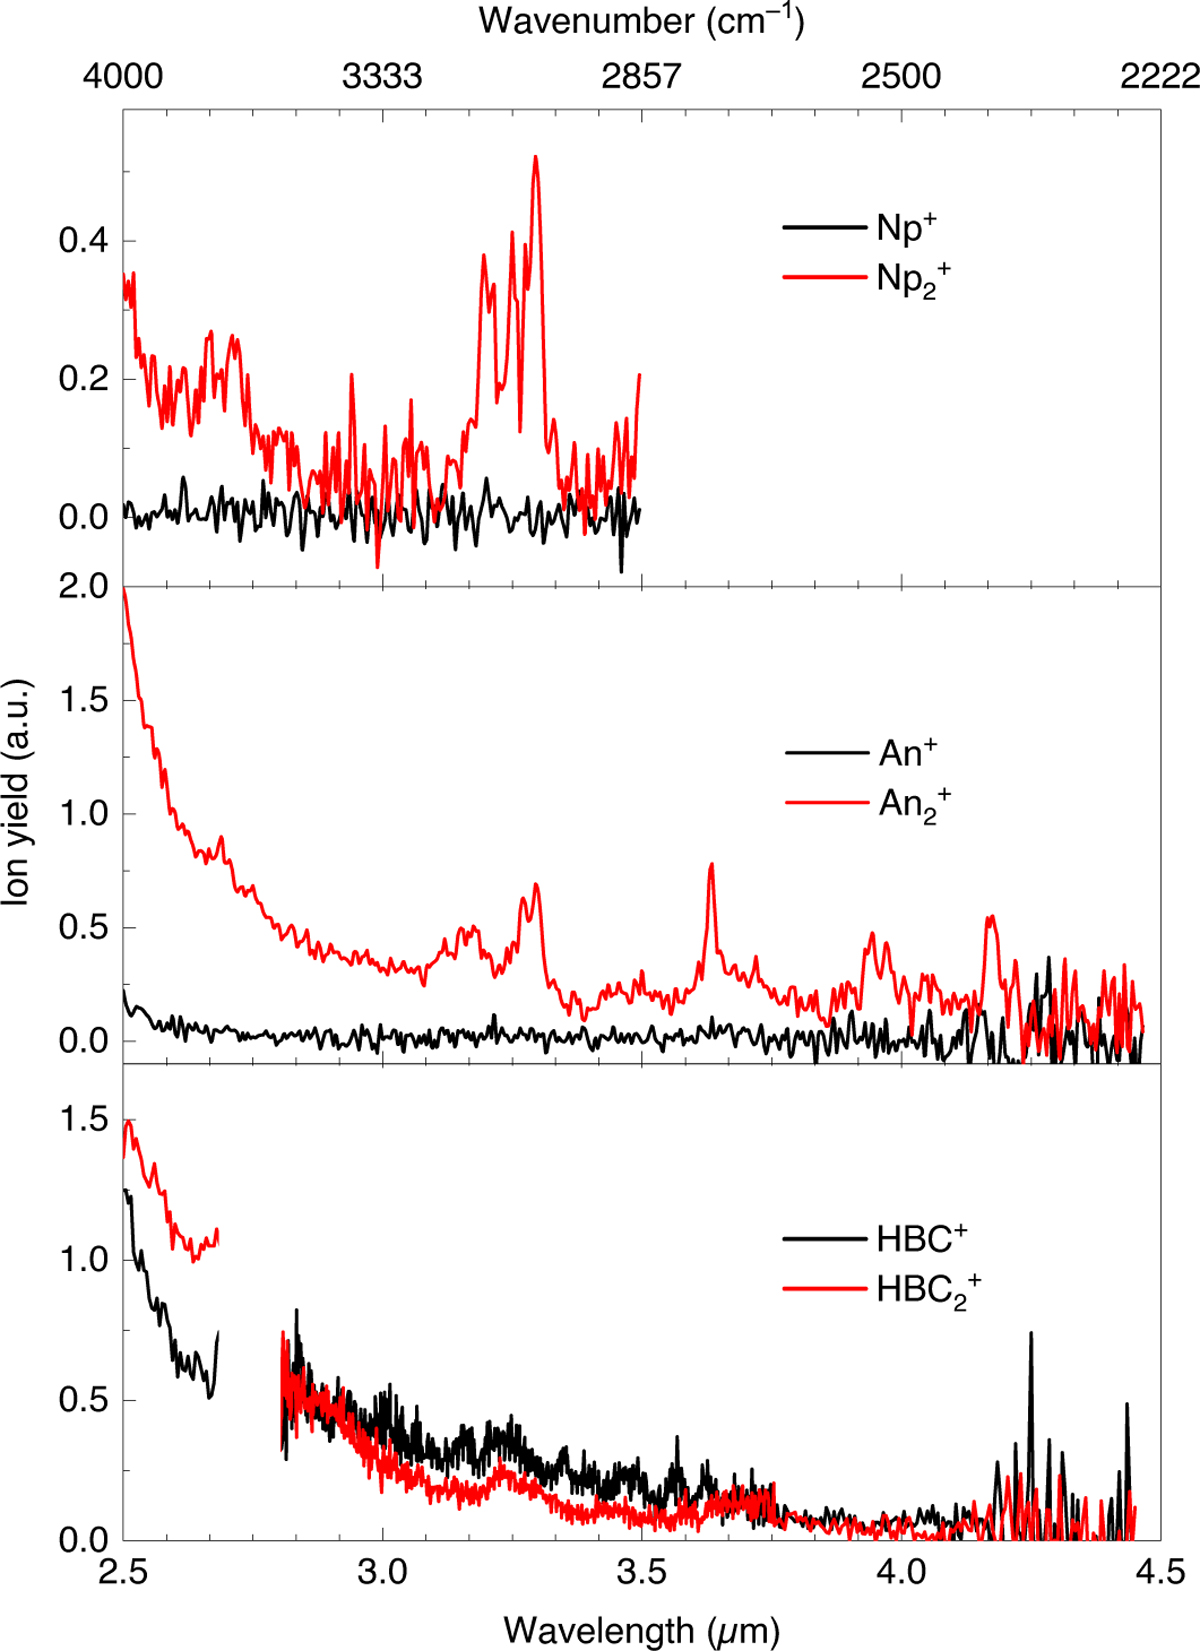
Fig. 2
Download original image
Comparison of the IR absorption spectra of the monomers (black line) and dimers (red line) of the Np, An, and HBC cations in the region of the CH stretching vibrations. Missing data ranges are due to insufficient laser power. Note that the ion yields are denoted in arbitrary units that cannot be compared across the different ion species.
Current usage metrics show cumulative count of Article Views (full-text article views including HTML views, PDF and ePub downloads, according to the available data) and Abstracts Views on Vision4Press platform.
Data correspond to usage on the plateform after 2015. The current usage metrics is available 48-96 hours after online publication and is updated daily on week days.
Initial download of the metrics may take a while.