| Issue |
A&A
Volume 709, May 2026
|
|
|---|---|---|
| Article Number | A117 | |
| Number of page(s) | 12 | |
| Section | Galactic structure, stellar clusters and populations | |
| DOI | https://doi.org/10.1051/0004-6361/202659104 | |
| Published online | 08 May 2026 | |
Discovery of Galactic-centre-ejected star in DESI DR1
1
Leiden Observatory, Leiden University,
PO Box 9513,
2300 RA
Leiden,
The Netherlands
2
Institute for Astronomy, University of Edinburgh, Royal Observatory,
Blackford Hill,
Edinburgh
EH9 3HJ,
UK
3
Institute of Astronomy, University of Cambridge,
Madingley Road,
Cambridge
CB3 0HA,
UK
★ Corresponding author: This email address is being protected from spambots. You need JavaScript enabled to view it.
Received:
23
January
2026
Accepted:
7
March
2026
Abstract
Hypervelocity stars (HVSs) are stars ejected from the Galactic centre (GC) through tidal interactions with the central supermassive black hole. Formed in the immediate vicinity of Sgr A*, these stars are accelerated to velocities high enough to escape the GC and be observable in the Galactic halo. Using spectroscopy from the Dark Energy Spectroscopic Instrument (DESI) and astrometry from Gaia, we conducted a six-dimensional search for HVSs and identified a compelling candidate, hereafter called DESI-312, whose bound trajectory can be confidently traced back to the central 2 kpc of our galaxy. The star resides in the inner halo and exhibits supersolar metallicity ( [Fe/H] = 0.27 ± 0.09), which makes it distinct from other known stellar populations with radial orbits. Its inferred GC ejection velocity of 698-27 is consistent with a Hills mechanism ejection, and suggests its origin lies in the innermost regions of the Milky Way. We considered alternative origins for the star, including disc ejections from young clusters and globular clusters, but these scenarios fail to explain both its orbit and metallicity. Unlike previously identified A- and B-type HVSs, DESI-312 is a ∼1 M⊙ star on the main sequence or early sub-giant branch, which enables a detailed chemical analysis of its atmosphere and offers a rare window -unobscured by dust and crowding - into the composition of the central regions of the Galaxy.
Key words: celestial mechanics / stars: black holes / stars: solar-type / Galaxy: bulge / Galaxy: center
© The Authors 2026
 Open Access article, published by EDP Sciences, under the terms of the Creative Commons Attribution License (https://creativecommons.org/licenses/by/4.0), which permits unrestricted use, distribution, and reproduction in any medium, provided the original work is properly cited.
This article is published in open access under the Subscribe to Open model. This email address is being protected from spambots. You need JavaScript enabled to view it. to support open access publication.
1 Introduction
Hypervelocity stars (HVSs) are stars ejected from the vicinity of Sgr A* in our Galactic centre (GC); when the ejection velocity is on the order of ~1000 km s−1, they can reach the halo of our Galaxy. The most promising mechanism for producing such high velocities is the Hills mechanism (Hills 1988), in which a stellar binary is tidally disrupted by an interaction with a massive black hole, yielding one captured component and one ejected star with velocities up to thousands of kilometers per second. A similar scenario ejects single stars following an interaction with a binary massive black hole; this assumes the existence of an intermediate black hole companion orbiting around Sgr A* (e.g. Yu & Tremaine 2003; Levin 2006; Sesana et al. 2006, 2009; Rasskazov et al. 2019).
Alternative channels include dynamical encounters in dense stellar systems (Poveda et al. 1967; Leonard & Duncan 1990; Gvaramadze et al. 2009) and supernova explosions in binary systems (Blaauw 1961; Portegies Zwart 2000). Both processes have been observed in the Galaxy (Hoogerwerf et al. 2001; Zari et al. 2025), with typical ejection velocities exceeding ~40 kms−1 (Blaauw 1961; Perets & Šubr 2012), which define the category of runaway stars. Simulations predict that most runaway stars from dynamical encounters have ejection velocities ≤200 km s−1 (Perets & Šubr 2012), while faster, unbound ejections (often termed hyper-runaway stars) are extremely rare, with a rate of 8 × 10⁻⁷ yr−1 (Perets & Šubr 2012; Brown 2015). Therefore, the primary mechanism for accelerating stars to velocities exceeding 200 kms−1 is an interaction with Sagittarius A*.
These ejected stars experience the entire Galactic potential, from the GC to the outskirts of the Milky Way (MW) halo. This makes them prime tracers of the Galactic potential (Gnedin et al. 2005; Yu & Madau 2007; Brown 2015; Gallo et al. 2022) and even possible probes of modified theories of gravity (Chakrabarty et al. 2022).
Importantly, HVSs provide a unique opportunity to study the properties of the GC, including the star formation history, merger history, and chemical composition. Due to high dust extinction, direct chemical abundance measurements within the GC are extremely challenging, particularly in the central parsec (Ryde et al. 2025). Because HVSs originate from these inner regions but travel beyond the dusty environment of the GC, they provide a powerful means to indirectly study the chemical makeup of their progenitor populations. Since the HVS ejection mechanism is intrinsically linked to the capture of objects around massive black holes, depending on initial conditions (Sersante et al. 2025), the ejection rate of HVSs is crucial for understanding stars in the vicinity of SgrA*, such as the S-star cluster (Verberne et al. 2025b). In addition, approximately 20% of captured stars may result in a tidal disruption event (TDE) (Verberne et al. 2025b); if the captured object is instead a stellar mass black hole, it could lose orbital energy via the emission of gravitational waves and be detected by the Laser Interferometer Space Antenna (LISA, Amaro-Seoane et al. 2017) as an extreme mass ratio inspiral (EMRI). Consequently, the HVS ejection rate plays a key role in constraining both the EMRI and TDE rates.
Many HVS searches have been conducted, primarily using Gaia data (e.g. Marchetti et al. 2019; Marchetti 2021; Marchetti et al. 2022; Luna et al. 2024; Verberne et al. 2024; Hattori et al. 2025) or via the photometric identification of faint blue stars (Brown et al. 2015). These efforts have enabled the identification of some of the most promising candidates to date, such as unbound HVS1 (Brown et al. 2005); however, this lacks sufficient astrometric precision to be definitively associated with the GC. Nevertheless, HVSs are rare. Only about a dozen promising candidates have been identified, and only a single unambiguous HVS has been detected to date - S5-HVS1 (Koposov et al. 2020).
Relying only on Gaia data limits the HVS search as the subset of stars in Gaia with measured radial velocities represents only a small fraction of the full Gaia catalogue. This sample is restricted to the brightest (GRVS < 16 mag) objects and lacks chemical information that would allow one to separate the HVS candidate from halo populations in similar orbits. In this context, the advent of multi-object spectroscopic surveys such as the 4-metre Multi-Object Spectroscopic Telescope (4MOST, de Jong 2019), WHT Enhanced Area Velocity Explorer (WEAVE, Dalton et al. 2012), and, most importantly for this work, the Dark Energy Spectroscopic instrument (DESI, DESI Collaboration 2025), represents the next step in HVS searches as these surveys increase sensitivity by targeting fainter objects and provide radial velocities and stellar parameters for millions of stars across the sky.
The first data release of the DESI survey (DESI Collaboration 2025) includes spectra for more than 18 million unique targets and is mainly aimed at mapping the evolving three-dimensional structure of the Universe up to z = 4. In addition, through the Bright programme of the main survey and the backup programme, DESI has observed more than 4 million stars. Measurements of stellar parameters, abundances, and radial velocities for these stars are provided in the stellar value-added catalogue (Koposov et al. 2026). Furthermore, Li et al. (2025) constructed the value-added distance catalogue Specdis, which provides distances for objects in the stellar catalogue using a feed-forward neural network trained directly on DESI spectra. The combined catalogue includes radial velocities from the DESI stellar catalogue, spectroscopic distances from the Specdis catalogue, and proper motions and sky positions from the third data release of the Gaia mission (Gaia Collaboration 2023). This combined dataset provides full six-dimensional phase-space information for approximately 4 million stars.
Additionally, the determination of metallicities from DESI spectra is crucial for a HVS search, as metal-poor halo stars are the principal contaminants. Combining chemical abundances with kinematics to constrain stellar birth locations via chemical tagging increases the reach of HVS searches, as it opens a window for studying bound HVSs - i.e. stars ejected from the GC whose total velocities are insufficient to escape the gravitational field of the Galaxy - which are expected to dominate the population of unbound HVSs (Brown 2015; Marchetti et al. 2018; Evans et al. 2021). An example of this type of object is WINERED-HVS1 (Hattori et al. 2025), a bound red giant with [Fe/H] —0.15 whose trajectory can be traced back to the GC and implies a modest ejection velocity of 500 km s−1. Its abundance pattern in [α/Fe], [Mg/Fe], [Si/Mg], and [Ca/Mg] associates it with the nuclear star cluster (NSC); however, given its metallic-ity and low velocity, it is also considered an ambiguous HVS as the metallicity makes it likely to be a halo star.
In this work, we performed a six-dimensional search for HVSs ejected from the GC, including those that are bound. This was done by combining radial velocities and metallicities from the DESI Data Release 1 stellar catalogue (Koposov et al. 2026), Gaia Data Release 3 (DR3) (Gaia Collaboration 2023) proper motions and sky positions, along with spectroscopic distances from the SpecDis (Li et al. 2025) value-added catalogue.
This paper is organized as follows. In Section 2, we describe the data used in our HVS search, while in Section 3, we detail the methodology used to identify HVS candidates, which can be extended to any six-dimensional dataset. We describe our discovery of a strong HVS candidate in Section 4.1. We discuss its possible origins along with a comparison with previous studies in Section 5. Finally, we draw our conclusions in Section 6.
Quality selections.
2 Data
In this section, we describe the observational data from DESI and Gaia used to search for HVSs, as well as the quality selections applied to it. The simultaneous use of these two surveys allow us to gather full phase-space information as well as metallicity measurements for each examined star.
We utilized data from the first data release of DESI, particularly the DESI Milky Way Survey (MWS, Koposov et al. 2026), which contains spectra and stellar properties for more than ~4 million stars. Radial velocities and [Fe/H] measurements were taken from the RVS pipeline (Koposov 2019; Koposov et al. 2011), and combined with distances from the spectrophotometric Specdis catalogue (Li et al. 2025). The Specdis catalogue provides distances for MWS stars using a feed-forward neural network trained directly on DESI spectra. For the [Fe/H] measurements, we adopted the calibration described in Koposov et al. (2026) to account for biases in the RVS pipeline. To obtain full six-dimensional phase-space information, we combined DESI data with Gaia astrometry using the crossmatch included in the DESI stellar catalogue. Additionally, to ensure that we are working with reliable measurements, we imposed quality selections, which are summarized in Table 1. Briefly, we selected sources with RUWE < 1.4 to exclude objects with unreliable astrometry. Additionally, we ensured that objects are classified as stars by the redrock classifier (Anand et al. 2024) by requiring RR_SpECTYPE =′ STAR′, and we removed stars with potentially problematic spectral fits by requiring RVS_WARN = 0.
3 Methods
In this section, we describe the method for selecting hypervelocity stars ejected from the GC using the six-dimensional phase space measurements from DESI DR1 and Gaia. These were presented in the previous section.
3.1 Galactic centre origin
To identify hypervelocity star candidates that could originate from the GC of the MW, we first transformed their sky position, distance, proper motion, and radial velocity into the Galactocentric reference frame using the Python package Astropy (Astropy Collaboration 2013, 2018, 2022). This transformation assumes a distance to Sgr A* of 8.122 kpc , a solar three-dimensional velocity of (12.9, 245.6, 7.78) kms−1, and a solar height above the Galactic plane of 20.8 pc. We then selected objects with a galactocentric radial velocity |Vrf| > 300 km s−1, which removes most objects associated with the MW disc, while retaining relatively fast but still bound Galactic centre ejecta. This selection yielded 54 475 stars from DESI.
In order to investigate these stars’ origin, we used the Python package AGAMA (Vasiliev 2019) to perform backward orbit integration. We adopted the Price-Whelan 2017 potential, which corresponds to a porting of Gala (Price-Whelan 2017) Milky-WayPotential2022 to AGAMA. This is a mass model for the MW composed of a spherical nucleus, a bulge, a sum of three components of Miyamoto-Nagai discs (Miyamoto & Nagai 1975) to represent an exponential disc, and a Navarro-Frank-White dark matter halo (Navarro et al. 1996). This model is tuned to reproduce both the MW rotation curve from Eilers et al. (2019) and the vertical structure from the phase spiral in the solar neighbourhood of Darragh-Ford et al. (2023).
For each object, we generated 1000 Monte Carlo samples obtained by Gaussian sampling over uncertainties in radial velocity, proper motion, and distance. Each sample was integrated backwards in time over 0.5 Gyr using adaptive time steps in the AGAMA framework. During integration, the positions where the orbit crossed the Galactic plane were recorded. We then computed the GC crossing ratio, denoted ratio_gc, which is defined as the fraction of samples that cross the plane within the circle of a 1 kpc radius around the GC. Here, a star with a ratio_gc of 0.5 has a 50% chance of having its first plane crossing within 1 kpc from the GC.
We treated any star with a ratio_gc ≥0.5 as a candidate GC ejecta. Unlike most previous HVS searches (e.g. Marchetti et al. 2019; Marchetti 2021; Marchetti et al. 2022; Luna et al. 2024; Verberne et al. 2024), we did not exclude bound objects (see also Hattori et al. (2025). However, a purely kinematic selection that admits bound objects is vulnerable to contamination by accreted populations, and potentially eccentric in-situ stars if they exist (Eggen et al. 1962). In particular, stars associated with the Gaia-Sausage-Enceladus merger (GSE; Helmi et al. 2018; Belokurov et al. 2018) often occupy the same phase-space region as HVS candidates, as they are typically on highly eccentric, radial, and often retrograde orbits. Fortunately, GSE stars have a well defined metallicity distribution that peaks at [Fe/H] —1.6 and quenches at [Fe/H] --0.5 (Ernandes et al. 2024). Therefore, to mitigate contamination from GSE stars, we restricted our sample to candidates with supersolar metallicity ([Fe/H] > 0).
4 Results
By applying the methodology described in Section 3 to the dataset described in Section 2, we obtained the distribution of ratio_gc shown in Figure 1. Here, the requirement of supersolar metallicity ( [Fe/H] ≥ 0) removes all but one object from the purely kinematic selection, shown in red in Figure 1. Therefore, our analysis yields a single candidate, star SOURCE ID 4226880901740499200, which we refer as DESI-312 and describe in Section 4.1.
Additionally, Figure 1 shows that the majority of high ratio_gc objects have metallicities consistent with a GSE origin. For reference, the unambiguous HVS, S5-HVS1, is also shown, which has a metallicity of [Fe/H] 0.29 ± 0.08 dex and a ratio_gc obtained by applying our search methodology to the parameters of S5-HVS1 presented in Koposov et al. (2020).
4.1 HVS candidate DESI-312
Having described the HVS selection methodology and the data to which it is applied, in this section we describe the properties of the only HVS candidate found, DESI-312, as determined from DESI DR1 data, Gaia astrometry, and available photometric data. A summary of the Gaia and DESI measurements is presented in Table 2, and the photometric measurements used are presented in Table 3.
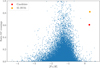 |
Fig. 1 Fraction of realizations (out of 1000 total) whose first Galactic-plane crossing falls within a radius of 1 kpc around the GC, shown as a function of [Fe/H] for DESI candidates. S5-HVS1 is overplotted in orange for reference (Koposov et al. 2020). The only candidate found, star DESI-312, is shown in red. |
Measured parameters of DESI-312 from Gaia and DESI DR1.
4.1.1 Spectroscopy
This source was observed as part of the bright programme during the main DESI survey. Being a relatively bright source with Gaia G - 17, the observed spectra were obtained with a signal-to-noise ratio of ~30.5 in the R and Z arms, and ~19 in the blue arm. The spectra, along with the best-fit PHOENIX (Husser et al. 2013) model from rvspecfit (Koposov 2019; Koposov et al. 2011), released with the DESI stellar catalogue, are shown in Figure 2.
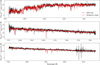 |
Fig. 2 Comparison between the best-fitting model spectrum (red) and the observed DESI spectra (black) for DESI-312, both provided as part of the first data release of the DESI stellar catalogue (Koposov et al. 2026). From top to bottom, the panels show the red, blue, and Z arms of the spectra. The close agreement between model and data gives no suggestion of a problematic fit or unreliable atmospheric parameters. |
Photometric measurements.
4.1.2 Photometry
In this section, we revise the photometric properties of DESI-312 by analysing the photometric measurements from a variety of surveys with broad wavelength coverage, and fitting the observations with isochrone models. Given the nature of this source as a relatively bright object, it has been covered by several different surveys. In this section, we gather photometric observations from Gaia, Sloan Digital Sky Survey (Abdurro’uf et al. 2022), SkyMapper (Onken et al. 2024), and Two Micron All-Sky Survey (Skrutskie et al. 2006), a summary of which is presented in Table 3.
We modelled the photometry by interpolating MESA isochrones & Stellar Tracks (MIST, Dotter 2016; Choi et al. 2016; Paxton et al. 2011, 2013, 2015) with the minimint package (Koposov 2023). Our dataset consists of the observed magnitudes, mi, where the index i labels each photometric band. The isochrones provide predicted magnitudes, surface gravities, and effective temperatures as functions of stellar age, mass (M), metallicity ( [Fe/H]), and band-pass (i). Assuming uncorrelated Gaussian uncertainties on the observed magnitudes, our model then becomes
![Mathematical equation: \begin{split}m_i & \sim {\mathcal N}\bigg( M (\mathrm{age},{\mathcal M},[\mathrm{Fe}/\mathrm{H}], i) \\ & \quad+ 5 \log_{10} D_{\mathrm{hel}} -5 + k_i E(B-V), \sqrt{\sigma_i^2 + \sigma_{\mathrm{sys}}^2}\bigg).\end{split}](/articles/aa/full_html/2026/05/aa59104-26/aa59104-26-eq3.png) (1)
(1)
Here, σi denotes the uncertainty in the magnitude measurement in band i, σsys represents an additional systematic scatter about the model, Dhel is the heliocentric distance to the star, and ki is the extinction coefficient in filter i1. In addition to the purely photometric model in Eq. (1), we also adopted a spectro-photometric model that, on top of Eq. (1), incorporates Gaussian constraints on log g and Teff from the DESI spectroscopic measurements, i.e. by multiplying the likelihood by normal-distribution terms for each of these parameters.
We adopted the following priors for our parameters: a uniform prior on (linear) stellar age, where, assuming no star formation in the halo, the lower bound is taken to be the median flight time to the disc, while the upper bound is the Hubble time, i.e. age ~ U(1.5 × 10⁸, 1.2 × 10¹⁰); a Salpeter-IMF prior for the stellar mass over M = 0.1 M⊙ - 5 M⊙; a Gaussian prior on distance based on the Gaia parallax; a Gaussian prior on [Fe/H] centred on the DESI-corrected value; a uniform prior in extinction from zero to five times the reported extinction in Schlegel et al. (1998), using the recalibration given in Schlafly & Finkbeiner (2011). The posterior distribution was sampled with the nested-sampling implementation in dynesty (Speagle 2020; Koposov et al. 2024). The implementation of this fitting procedure is publicly available here2, and can be used to fit MIST isochrones using any available bands supported by minimint along with the atmospheric parameters, when available. The posterior samples are shown in Figure 3, while the best-fit parameters are reported in Table 4.
In Figure 3, the photometric model is shown in green, and we observe a degeneracy between the stellar mass and the distance, as is typical for photometric data. We derive a stellar mass of  and [Fe/H] =
  . The age is weakly constrained, with the posterior spanning from 170Myr to 11 Gyr (16th to 84th percentiles), stretching as far as the prior allows. The estimated distance is
  kpc , in agreement with the Gaia parallax-based distance of
  kpc. These results are consistent with DESI-312 being a main-sequence star, on the full range of ages between the zero-age and terminal-age main sequence for a
  M⊙ star remains compatible with the data, meaning up to 11 Gyr.
For the spectro-photometric model, we find overall agreement with the photometric model, but with improved constraints, particularly on mass and age. While [Fe/H] remains similarly constrained. This model has a significantly improved age constraint, placing it between 5.12 and 10.96 Gyr corresponding to the 16th and 84th percentiles. We find that DESI-312 is an old main-sequence star, as evidenced by the star’s position in the Hertzsprung-Russell diagram shown in Figure 4, and with 98% of the posterior samples being consistent main-sequence solutions, while the other 2% corresponds to it being an evolved sub-giant branch star. While the star is consistent with both, a larger part of the posterior aligns with a main-sequence nature3.
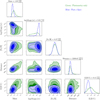 |
Fig. 3 Corner plot of the posterior distributions for stellar mass M*, log10(Age/yr), [Fe/H], distance d, and reddening E(B- V). Green contours are from the photometry-only fit; blue contours include photometry and the DESI rvspecfit measurements of Teff and logg. Contours indicate the 68%, 95%, and 99.7% credible regions; diagonal panels show the corresponding one-dimensional marginalized posteriors. Titles show the median and 16th and 84th percentiles for the spectro-photometric fit. |
Best-fit parameters for DESI-312 in photometric and spectrophotometric models.
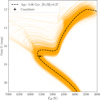 |
Fig. 4 Hertzsprung-Russell diagram of DESI-312. The orange curves show 1000 samples from the posterior of the spectro-photometric model (see Figure 3). The best-fit isochrone is shown as a dashed line. |
4.1.3 Kinematics
The kinematic properties of DESI-312 are summarized in Table 2. The star is found at 2.15 ± 0.37 kpc below the plane of the disc, and at a distance of 6.43 ± 0.07 kpc from the GC moving at 314 ± 65 km s−1. The star is currently falling back to the GC, with a flight time since the previous plane crossing of 211 ± 93 Myr.
Given the constraints from the spectro-photometric model described in Section 4.1.2 and shown in Table 4, we integrated the orbit of DESI-312 backwards over the median stellar lifetime of 8.05 Gyr, using the AGAMA library. The resulting orbit is shown in Figure 5. The top panel shows the orbit in the XZ plane. It reveals chaotic motion with many disc crossings, as expected for ejections via the Hills mechanism (Penoyre et al. 2025). The bottom panel shows the orbit in the XY plane and highlights its high eccentricity and repeated close pericenter passages.
We note that the plotted orbit is only one of many consistent with the observational uncertainties of DESI-312. A further caveat is that the adopted Galactic potential is rigid and nonevolving. In reality, the MW has grown in mass through mergers (Zasowski et al. 2025) and is currently being perturbed by the Large Magellanic Cloud (LMC) system (Garavito-Camargo et al. 2019; Conroy et al. 2021; Vasiliev 2023; Cavieres et al. 2025). In addition, the bar can have strong effects on orbits, particularly within resonances (Dillamore & Sanders 2025). Tests using an evolving barred potential from Hunter et al. (2024) show no significant effect on the orbit of DESI-312. Nevertheless, the orbit shown in Figure 5 should be regarded as an approximate reference, since it neglects both the secular mass growth of the MW and the ongoing LMC perturbation, as well as the observational uncertainties.
The same behaviour can be illustrated in the distribution of the plane crossing positions, shown in Figure 6, where the 1σ and 2σ regions are shown for the Monte Carlo sampling of the orbit, for 100 000 samples and considering all crossings that can take place within the lifetime of the star at the pericenter passage. The posterior peaks at the GC though this is less constrained than the distribution of plane crossing locations considering the first plane crossing only.
The chaotic dynamics that are also evident in the positive Lyapunov exponent for around half of our samples make the exact place of origin difficult to constrain. However, in all allowed orbital realizations the star can be traced back to the Galactic centre, owing to its low angular momentum in the Z direction, as shown in Figure 6.
We estimated the ejection velocity at a given disc location by subtracting the local circular rotation velocity from the total velocity at that XY position. To do so, we adopted the rotation curve evaluated at each XY position from MilkyWayPotential2022, and computed the ejection-velocity spectrum over 100 000 realizations of backward integration of DESI-312, while sampling over the observational uncertainties in proper motion, radial velocity, and distance, and we included all crossings allowed within the median lifetime of the star. The resulting ejection velocity spectrum is shown in Figure 7, with a median ejection velocity of  km s−1.
The minimum ejection velocity allowed is 221 km s−1 , which corresponds to an ejection taking place at the apocenter with the ejection direction and velocity tuned to eliminate the disc rotation and place the star in the low angular momentum orbit that is currently observed. This can be observed in the upper panel of Figure 8, which shows the ejection velocity as a function of radii, where the lowest ejection velocities (221 km s−1) all correspond to apocenter passages beyond 10kpc. However, most of the plane crossings take place at low radii, with the highest density of crossings observed below 2 kpc (also shown in Figure 6), where the velocities exceed 500 km s−1 and reach up to 800 km s−1.
The substructure visible in the upper panel of Figure 8 above 600 km s−1 at radii ~2 kpc is primarily a result of the uncertainty in the spectroscopic distance from Specdis, which maps directly onto uncertainties in both the orbital energy and the vertical component of the angular momentum. For solutions above the locus at (600 km s−1, 2 kpc) the inferred phase-space coordinates permit higher Lz, hence more regular orbits. In contrast, solutions below this locus are restricted to low-angular-momentum, high-energy trajectories that are fully chaotic. Consequently, Hills ejecta consistent with the observed parameters are generically placed on plunging, chaotic orbits (e.g. Penoyre et al. 2025).
The previous analysis was done using the distances from the SpecDis catalogue, however DESI-312 has a well-constrained parallax of 0.261 ± 0.082 mas, which translates into a distance of  kpc, consistent at the 1σ level with the spectroscopic distance (Dhel = 4.78 ± 0.83 kpc) reported in Specdist. We recomputed the posterior distribution on the first plane crossing position with all three distance estimations, namely the spectro-photometric model shown in Figure 3, the Specdis neural network distance, and the parallax distance and we found that the candidate is consistent with a GC origin for the first crossing for any of the distances used, as shown in Figure 9.
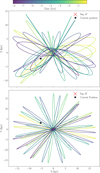 |
Fig. 5 Example orbit of DESI-312 integrated over the median lifetime in the XZ (top) and XY plane (bottom), in the Galactic Cartesian coordinate system, coloured according to the relative time, with 0 being the current observed position of the star. The orbit is backward integrated for 8.05 Gyr, given by the median on the age posterior for the spectrophotometric model described in 4.1.2. |
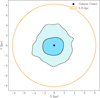 |
Fig. 6 Galactic plane crossing locations for DESI-312, considering all crossings that can take place within the lifetime of the star. The 1σ and 2σ corresponding to regions containing the 68th and 95th percentiles of plane crossings are shown with a continuous and dashed line, respectively. The solar circle is shown in orange for reference. |
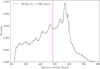 |
Fig. 7 Ejection velocity spectrum from 100000 orbit realizations integrated back by the median lifetime of the star, compensated by the MW rotation curve as given by the MilkyWayPotential2022. |
5 Discussion
In this section, we discuss the alternatives to the Hills mechanism to explain the properties of DESI-312. Young massive cluster ejection is discussed in Section 5.1. Dynamical disc ejections are discussed in Section 5.2, and an origin in the LMC and Sagitarius Dwarf are discussed in Sections 5.4 and 5.5.
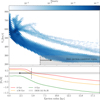 |
Fig. 8 Upper panel: ejection velocity from the disc versus galacto-centric distance of the ejection point, consistent with the kinematics of DESI-312. We computed the velocities and distances by sampling observational uncertainties over 100000 orbit realizations, integrated backwards over the star’s median lifetime; points are coloured according to the normalized density of orbit crossings in the radius-velocity plane. Lower panel: Fe abundance profiles of the gas 9 Gyr ago (green), 4.56 Gyr ago (yellow), and at present (red), from Prantzos et al. (2023) models. |
5.1 Young massive cluster
Dynamical interactions in young massive clusters (YMCs) are a leading candidate among the possible mechanisms capable of accelerating a star to the 486.9 kms−1 ejection velocity of DESI-312 (see Portegies Zwart et al. (2010) for a review). Such interactions, along with core-collapse supernovae (e.g. Blaauw 1961; Tauris & Takens 1998; Wagg et al. 2025), are typically invoked to explain the origin of main-sequence ’runaway stars’. These objects are conventionally defined as having ejection velocities exceeding 40 km s−1 (Blaauw 1961) - an arbitrary threshold chosen to distinguish them from ’walkaway stars’, whose velocities just exceed the escape velocity of their natal environment (Portegies Zwart et al. 2010). However, both mechanisms struggle to produce ejection velocities above ~200 km s−1 (Portegies Zwart 2000; Perets & Šubr 2012; Oh & Kroupa 2016; Evans et al. 2020, 2025), with ejections above 200 km s−1 being heavily outnumbered by ejections on the order of ~10 km s−1 (Portegies Zwart 2000; Eldridge et al. 2011; Wagg et al. 2025; Perets & Šubr 2012).
There are two well-known YMCs in the Galactic centre that lie within the posterior for the first place crossing shown in Figure 9: the Arches cluster (Nagata et al. 1995) and the Quintuplet cluster (Kobayashi et al. 1983). The age of the Arches cluster is found to be between 2.0-3.3 Myr, given the observed main-sequence turnoff, the population of supergiant stars, and the lack of H-free Wolf-Rayet stars (Clark et al. 2018); likewise, the age of the Quintuplet cluster is estimated to be 3.0-3.6 Myr (Liermann et al. 2012). Both are inconsistent with the estimated age for DESI-312 of ~5.12-10.9 Gyr, thus we reject both the Arches and Quintuplet clusters as possible progenitors for DESI-312, since they are both unlikely to generate the required ejection velocity and they have an inconsistent age.
The ejection velocity spectrum of DESI-312 is shown in Figure 7 from which a median ejection velocity of 486 km s−1 is found, which greatly exceeds typical ejection velocities from clusters (Perets & Šubr 2012). This makes the cluster ejection hypothesis highly unlikely for DESI-312, which is in line with findings that suggest dynamical and supernovae ejections cannot explain the HVS population Perets & Šubr (2012); Evans et al. (2020). Note that this velocity is higher than the Galactic reference frame velocity ejection since the later should also cancel out the MW rotation in order to match the angular momentum of DESI-312.
5.2 Disc ejections
Previous studies have identified a large number of fast objects that cannot be traced back to the GC and are instead associated with an origin in the MW disc, such as some of the candidates presented in Brown et al. (2015) and Kreuzer et al. (2020). To assess the possibility of DESI-312 being a disc ejection, we simulated a population of MW disc ejecta.
We generated birth sites from a geometrically thin, axisymmetric exponential disc and gave each star the local circular motion of a realistic Milky Way potential before perturbing it with small dispersions and an isotropic kick. Cylindrical galac-tocentric radii were drawn from the surface-density profile (∑(R) ∝ e-R/Rd), i.e. from the area-corrected radial probability density function (p(R) ∝ R, e-R/Rd), truncated at (Rmax); azimuths were uniform in ([0,2π)) (Juric et al. 2008). Vertical positions were sampled from a symmetric Laplace distribution about the midplane, (p(z) ∝ exp(-|z|/hz)), which is appropriate for a thin disc. At each sampled ((x,y,z)), we evaluated the circular speed from the adopted Milky Way potential and assigned initial velocities around the circular orbit. These were converted to Cartesian components and we included a small additional in-plane Gaussian turbulence (εx,y ~ N(0, σturb)) to mimic non-circular motions. Unless stated otherwise, we adopted fiducial values of (Rd = 2.6, kpc), (Rmax = 15, kpc), (hz = 0.1, kpc), (συR = συz = 10 kms−1), and (σturb = 15, km, s−1) (McMillan 2017; Eilers et al. 2019). The gravitational field and hence (vc (R)) are taken self-consistently from the MilkyWayPotential2022 within AGAMA, which ensures that the rotation curve reflects the same mass model used to integrate trajectories.
To model cluster-ejection mechanisms (few-body interactions and supernova kicks), we then gave each star an additional isotropic velocity kick drawn uniformly on the sphere and speeds sampled from a broken power-law distribution,  between (0.1-300 km s−1) and
  , following the dynamical ejection velocity distribution from Perets & Šubr (2012). This procedure yielded a population of disc ejecta whose birth radii, vertical distribution, and pre-ejection kinematics reflect a thin exponential disc embedded in a realistic Galactic potential, while the kick spectrum and isotropy encode the cluster-driven ejection channel with an upper limit in ejection velocity of 300 km s−1. The resulting initial conditions are forward-integrated 1 Gyr to predict present-day positions and velocities for comparison with the observed high-speed candidates.
From the simulated dynamical disc ejections, we find that it is possible to produce stars with orbits similar to that of DESI-312. However, placing a star in such an orbit within the halo is relatively unlikely, as it requires fine-tuning of both the ejection velocity and direction to achieve a radial trajectory consistent with that observed for DESI-312. In our simulation, approximately 2% of disc ejections result in |z| > 2 kpc. Furthermore, only about 10−5 of all ejections lead to a configuration compatible with the 16th and 84th percentiles of DESI-312's energy and angular momentum, shown in Figure 10. This low fraction reflects the stringent requirement that a star must be ejected with both the appropriate velocity and direction to lose angular momentum while retaining relatively high energy.
We can estimate an upper limit on the number of runaway stars that may lie in orbits compatible with DESI-312 by first assuming that all star formation in the galaxy has taken place in clusters, with a median star formation rate of Ψ = 2 M⊙ yr−1 (Elia et al. 2022), and a relatively high cluster mass capable of ejecting stars at high velocity Mcl = 104 M⊙. Then within the time T = 8 Gyr, which corresponds to the look-back time given by the 16th and 84th percentiles in age of DESI-312, we have a total number of clusters formed of
 (2)
(2)
Given Perets & Šubr (2012)'s most realistic model, we can expect 0.02 stars per cluster to be ejected with vej > 300 km s−1. Additionally, we need the star to survive to the present day, which requires the mass to be m ≤ 1 M⊙ given that DESI-312 is about to exit the main sequence with a solar mass. Therefore, considering Figure 4 in Perets & Šubr (2012), we can expect ~30% of runaways to be within this mass regime. As a result, the rate of runaways becomes e = 0.06 stars/cluster, of which, as previously described, the ratio 10−4 will have compatible orbits. Hence, the number of runaway stars that have accumulated in compatible orbits within the lifetime of DESI-312 is given by
 (3)
(3)
Note that this upper limit assumes that all star formation occurs in massive clusters with a mass of 104 M⊙, whereas in reality the cluster population follows a cluster mass function that peaks at 105 M⊙ (Larsen 2008; Gieles 2009; Just et al. 2023). Under our assumption that the number of runaways scales with the number of clusters, increasing the characteristic cluster mass by a factor of 10 would, for fixed total stellar mass and constant e, reduce the predicted number of runaways by the same factor. A detailed study of the dependence of e on cluster mass is beyond the scope of this work, but it would be a significant improvement on our estimation as this parameter is expected to be an increasing function of mass.
Additionally, this estimate does not account for detectability by Gaia or DESI, and it includes all stars with masses lower than DESI-312, which are less likely to be detected by either survey. Thus, it should be regarded as an upper limit on the number of stars that could be identified via this mechanism.
Moreover, for the star to be ejected at a velocity consistent with runaway ejection processes (Vej < 300 km s−1 in the most extreme cases), it would need to originate in the outer disc. As shown in the upper panel of Figure 8, ejection velocities below 300 km s−1 are only observed beyond 10 kpc , within the shaded region where the most extreme runaways would lie. Furthermore, considering the Fe abundance profile in the lower panel of Figure 8, the formation of stars with metallicities consistent with our candidate ( [Fe/H] ~ 0.3) beyond 4 kpc is not expected from chemical-evolution models of the galaxy, even allowing for the lower age limit of DESI-312 at ~5 Gyr; this is especially unlikely given the median age of DESI-312 at ~8 Gyr. We therefore consider the region within 4 kpc to be consistent with the DESI-312 [Fe/H]. Consequently, within the region (R ≲ 4 kpc) where the metallicity is consistent with DESI-312, the required ejection velocity would have to exceed the runaway threshold (Vej ≥ 300 km s−1), thereby almost completely ruling out runaway mechanisms as a viable origin.
Therefore, while this remains an extremely unlikely scenario, we do not completely rule out the possibility that DESI-312 was ejected from an unknown (and possibly now dissolved) cluster. This cluster would have to be an outlier in metallicity with respect to the MW disk, and the ejection would have to take place with the precise velocity and direction necessary to reach its current radial bound orbit. For such an event to occur, runaway ejections should be able to exceed 300 km s−1, which to date has not been observed.
 |
Fig. 9 Comparison of Galactic plane crossings for the different distance estimates available for DESI-312. For each estimate, the 2σ region is shown, obtained using the method described in Section 3, with the sampling increased to 100000 Monte Carlo realizations. DESI-312 shows consistency with a GC origin for the first crossing with all available distance estimations. |
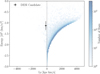 |
Fig. 10 Integral of motion space for 100000 simulated dynamically ejected runaway stars and hyper-runaway stars following the Perets & Šubr (2012) velocity distribution. DESI-312 is shown in black, with energy and angular momentum compatible at the 1σ level with Lz = 0, but mainly a counter-rotating angular momentum. |
5.3 Metal-rich globular clusters
Within the dynamical ejection scenario, three- and four-body interactions in dense stellar clusters can convert binary binding energy into kinetic energy and eject cluster members at high velocities. However, as previously mentioned, N-body simulations show that ejection velocities above ~200 km s−1 are rare in such dynamical encounters and cannot account for the population of hyper-runaway stars with Vej ≳ 400 kms−1.
A natural class of dense stellar systems in which dynamical ejections can occur is globular clusters. In the MW, ~170 globular clusters are currently known (e.g. Vasiliev & Baumgardt 2021), and their metallicities are predominantly subsolar ([Fe/H] < 0). Supersolar metallicities have been proposed for the bulge globular clusters Liller 1 and NGC 6528 (Carretta et al. 2009; Liu et al. 2017), although in both cases the quoted uncertainties are comparable to or larger than the inferred metallicity excess.
The highest-metallicity clusters are typically found in the bulge region (e.g. Garro et al. 2024). Therefore, if the existence of a metal-rich tail among bulge globular clusters is confirmed, dynamical ejection from such a system could represent a plausible progenitor channel for DESI-312 ( [Fe/H] ~0.27), particularly if its ejection velocity lies near the low end of the distribution shown in Fig. 7.
5.4 LMC origin
The LMC is the MW’s most massive satellite, with a mass estimated to be around 10% of the MW mass (Besla et al. 2010; Peñarrubia et al. 2016; Patel et al. 2017; Erkal et al. 2019; Erkal & Belokurov 2020; Shipp et al. 2021; Vasiliev et al. 2021; Correa Magnus & Vasiliev 2022; Koposov et al. 2023). As such, it is believed to host a supermassive black hole (Boyce et al. 2017), which also ejects HVSs via the Hills mechanism (Han et al. 2025). Hence, it is worth assessing the LMC as a possible progenitor for HVS candidates.
To test a LMC origin for DESI-312, we integrated 10000 realizations that sample the observational uncertainties (Section 3) in a time-dependent MW+LMC potential. We modelled the MW as a spherical bulge, a single exponential disc, and a spherical dark matter halo. The LMC was represented as a 1.5 × 10¹¹ M⊙ spheroid (Koposov et al. 2023), consistent with the constraints from Vasiliev (2019). The mutual MW-LMC orbit was computed self-consistently and included dynamical friction via the standard Chandrasekhar formula. Over the last 1 Gyr, this model reproduces the LMC orbit from the N-body simulations of Garavito-Camargo et al. (2019). None of the 10 000 realizations pass within 40 kpc of the LMC centre, so we reject an LMC origin for DESI-312.
5.5 Sagittarius Dwarf origin
The Sagittarius Dwarf galaxy is a dissolving galaxy being tidally disrupted by the MW (Ibata et al. 1995). It is one of the closest and most massive satellites of the MW, and the most metal rich (Hasselquist et al. 2021). As such, it is chemically consistent with the supersolar metallicity of our candidate ( [Fe/H] ~ 0.27), in particular if it was ejected from the core of Sagittarius.
To investigate a Sagittarius Dwarf origin, we treat the Sagittarius Dwarf trajectory from Vasiliev & Belokurov (2020) over the last 3 Gyr as fixed and propagate 100 000 realizations of DESI-312's trajectory in the same potential used by Vasiliev & Belokurov (2020) to model the Sagittarius Dwarf, namely an evolving potential that includes dynamical friction from the LMC and the Sagittarius Dwarf. We find that the median closest approach between both objects is ~12.1 ± 2.7 kpc. From a kinematic standpoint, this makes an origin of DESI-312 in the Sagittarius Dwarf unlikely, although not completely ruled out, in contrast to the case of the LMC.
5.6 Previous work
Recently, Verberne et al. (2025a) conducted a search using the same dataset employed in this work for a statistical overdensity of low-angular-momentum (Lz ~ 0), high-metallicity (-0.25 < [Fe/H] < 0.5) stars, effectively probing the same parameter space occupied by DESI-312. The detection of such an overdensity could not be statistically confirmed. This non-detection places an upper limit of approximately 51 stars that could still be present in DESI, which is consistent with the identification of a single candidate based on the selection function described in Section 3.
Hattori et al. (2025) performed a six-dimensional search that also included bound HVSs, using Gaia DR3 astrometry, distances from Starhorse (Anders et al. 2022), and metallicities derived from Gaia XP spectra in Hattori (2025). Their analysis identified a single HVS candidate: the red giant WINERED HVS1. This candidate is bound, similar to DESI-312, and is distinguished from halo stars on radial orbits by its chemical composition, both from Gaia XP-derived metallicities and from a high-resolution spectroscopic follow-up in which the authors chemically tagged WINERED HVS1 to MW bulge populations. Further association with nuclear star cluster trends could be assessed by comparing its abundance trends to those presented in Nandakumar et al. (2025), particularly the excess [Na/Fe] found in the nuclear star cluster relative to the nuclear stellar disc and bulge populations. A similar analysis could also be performed for DESI-312 given future high-resolution spectroscopic follow-up.
6 Conclusions
We performed a six-dimensional search for hypervelocity stars in DESI DR1 (DESI Collaboration 2025) by combining DESI radial velocities and metallicities with Gaia DR3 astrometry and spectrophotometric distances from Specdis to build a sixdimensional catalogue containing about 4 million objects. Our selection admits both bound and unbound ejecta and couples backward Monte Carlo orbit integration in a realistic Milky Way potential with a supersolar metallicity requirement to suppress contamination from halo stars in radial orbits. The method identifies candidates that (i) cross the Galactic plane within 1 kpc of Sgr A* in a significant fraction of realizations and (ii) are chemically inconsistent with Gaia-Sausage-Enceladus or other halo populations.
Here we summarize the findings from our HVS search:
Our search identifies DESI-312 as a strong candidate GC ejecta. It is an ~1 M⊙, high-metallicity star ( [Fe/H] - 0.27 dex) on a very eccentric orbit (e ~ 0.97) with almost purely radial motion, characterized by a normalized angular momentum Lz/Lc(E) = -0.018 ± 0.06. Its first Galactic-plane crossing lies within 2 kpc of Sgr A* in the vast majority of Monte Carlo realizations (see Figure 9). The present-day Galactocentric speed is Vgcr ≃ 314 ± 66 km s−1, the median ejection speed is Vej ≃ 486.9 kms−1, and the inferred GC (ejected within 1pc from Sag A*) ejection speed is
 kms−1, which values are compatible with ejection via the Hills mechanism;
From spectro-photometric modelling (Section 4.1.2), DESI-312 is an old main-sequence or slightly evolved sub-giant star, with an age of log10(age/yr) =
 and a mass of
  M⊙. This age range is incompatible with an origin in known young massive clusters in the Galactic centre region, such as the Arches and Quintuplet clusters (ages 24 Myr), even though these systems lie within the posterior on the first plane-crossing position;
The high metallicity measured for DESI-312 makes it extremely unlikely for it to be a halo star in a radial orbit, particularly from the known accretion event of Gaia-Sausage Enceladus, as well as an ejection from globular clusters;
DESI-312 required kick speed for a disc ejection exceeds those expected from dynamical or supernova-driven runaways. This, combined with the particular energy and angular space that DESI-312 occupies, makes it unlikely to originate from a disc ejection. Moreover, given the MW metallicity gradient, stars with metallicities comparable to our candidate are expected to form predominantly in the inner regions of the MW where the required ejection velocity exceeded the runaway regime (Vej ≥ 350 km s−1). Thus, within the region where the metallicity is consistent, the necessary ejection velocities almost completely rule out a runaway origin.
High resolution follow-up spectroscopy is essential both to rule out unresolved binarity that could bias our measurements, and further improve the association to the GC by chemical tagging. Specifically, we need to test whether DESI-312 exhibits the elevated [Na/Fe] trend identified for NSC stars (Nandakumar et al. 2025) when compared to other bulge stars. Additionally, a more precise radial velocity measurement would further tighten the kinematic constraints on its origin.
If the origin of DESI-312 is confirmed through chemical tagging, high resolution spectroscopy would allow us to exploit the full potential of DESI-312 as a tracer of the Galactic centre’s chemical composition since, unlike previously identified A-and B-type HVSs, DESI-312 is solar-type. This would enable a detailed chemical analysis of its atmosphere and provide a window into the chemistry of the central regions without the hindrance of dust and crowding.
The analysis presented here can also be extended to other large spectroscopic surveys, such as LAMOST (Cui et al. 2012), APOGEE (Majewski et al. 2017), WEAVE (Dalton et al. 2012), 4MOST (de Jong et al. 2019), as well as the forthcoming Gaia DR4 and DESI DR2. Together, these surveys will increase by roughly a factor of three the number of sources accessible to this analysis, and may consequently increase the number of detected HVSs.
Acknowledgements
The authors acknowledge Bianca Sersante, Andres Presa, and Konstantinos Kilmetis for their insightful discussions. EMR acknowledges support from European Research Council (ERC) grant number: 101002511/project acronym: VEGA_P. SK acknowledges support from the Science & Technology Facilities Council (STFC) grant ST/Y001001/1. This work was performed using the ALICE compute resources provided by Leiden University. This work has made use of data from the European Space Agency (ESA) mission Gaia (https://www.cosmos.esa.int/gaia), processed by the Gaia Data Processing and Analysis Consortium (DPAC, https://www.cosmos.esa.int/web/gaia/dpac/consortium). Funding for the DPAC has been provided by national institutions, in particular the institutions participating in the Gaia Multilateral Agreement. This research used data obtained with the Dark Energy Spectroscopic Instrument (DESI). DESI construction and operations is managed by the Lawrence Berkeley National Laboratory. This material is based upon work supported by the U.S. Department ofEnergy, Office of Science, Office ofHigh-Energy Physics, under Contract No. DE-AC02-05CH11231, and by the National Energy Research Scientific Computing Center, a DOE Office of Science User Facility under the same contract. Additional support for DESI was provided by the U.S. National Science Foundation (NSF), Division of Astronomical Sciences under Contract No. AST-0950945 to the NSF’s National Optical-Infrared Astronomy Research Laboratory; the Science and Technology Facilities Council of the United Kingdom; the Gordon and Betty Moore Foundation; the Heising-Simons Foundation; the French Alternative Energies and Atomic Energy Commission (CEA); the National Council of Humanities, Science and Technology of Mexico (CONAHCYT); the Ministry of Science and Innovation of Spain (MICINN), and by the DESI Member Institutions: www.desi.lbl.gov/collaborating-institutions. The DESI collaboration is honored to be permitted to conduct scientific research on I’oligam Du’ag (Kitt Peak), a mountain with particular significance to the Tohono O’odham Nation. Any opinions, findings, and conclusions or recommendations expressed in this material are those of the author(s) and do not necessarily reflect the views of the U.S. National Science Foundation, the U.S. Department of Energy, or any of the listed funding agencies. Software: NumPy (Harris et al. 2020), SciPy (Virtanen et al. 2020), Matplotlib (Hunter 2007), Astropy (Astropy Collaboration 2013, 2018, 2022).
References
- Abdurro’uf, Accetta, K., Aerts, C., et al. 2022, ApJS, 259, 35 [NASA ADS] [CrossRef] [Google Scholar]
- Amaro-Seoane, P., Audley, H., Babak, S., et al. 2017, arXiv e-prints [arXiv:1702.00786] [Google Scholar]
- Anand, A., Guy, J., Bailey, S., et al. 2024, AJ, 168, 124 [NASA ADS] [CrossRef] [Google Scholar]
- Anders, F., Khalatyan, A., Queiroz, A. B. A., et al. 2022, A&A, 658, A91 [NASA ADS] [CrossRef] [EDP Sciences] [Google Scholar]
- Astropy Collaboration (Robitaille, T. P., et al.) 2013, A&A, 558, A33 [NASA ADS] [CrossRef] [EDP Sciences] [Google Scholar]
- Astropy Collaboration (Price-Whelan, A. M., et al.) 2018, AJ, 156, 123 [Google Scholar]
- Astropy Collaboration (Price-Whelan, A. M., et al.) 2022, ApJ, 935, 167 [NASA ADS] [CrossRef] [Google Scholar]
- Belokurov, V., Erkal, D., Evans, N. W., Koposov, S. E., & Deason, A. J. 2018, MNRAS, 478, 611 [Google Scholar]
- Besla, G., Kallivayalil, N., Hernquist, L., et al. 2010, ApJ, 721, L97 [Google Scholar]
- Blaauw, A. 1961, Bull. Astron. Inst. Netherlands, 15, 265 [NASA ADS] [Google Scholar]
- Boyce, H., Lützgendorf, N., van der Marel, R. P., et al. 2017, ApJ, 846, 14 [Google Scholar]
- Brown, W. R. 2015, ARA&A, 53, 15 [Google Scholar]
- Brown, W. R., Geller, M. J., Kenyon, S. J., & Kurtz, M. J. 2005, ApJ, 622, L33 [Google Scholar]
- Brown, W. R., Anderson, J., Gnedin, O. Y., et al. 2015, ApJ, 804, 49 [NASA ADS] [CrossRef] [Google Scholar]
- Carretta, E., Bragaglia, A., Gratton, R., D’Orazi, V., & Lucatello, S. 2009, A&A, 508, 695 [NASA ADS] [CrossRef] [EDP Sciences] [Google Scholar]
- Cavieres, M., Chanamé, J., Navarrete, C., et al. 2025, ApJ, 983, 83 [Google Scholar]
- Chakrabarty, S. S., Ostorero, L., Gallo, A., Ebagezio, S., & Diaferio, A. 2022, A&A, 657, A115 [NASA ADS] [CrossRef] [EDP Sciences] [Google Scholar]
- Choi, J., Dotter, A., Conroy, C., et al. 2016, ApJ, 823, 102 [Google Scholar]
- Clark, J. S., Lohr, M. E., Najarro, F., Dong, H., & Martins, F. 2018, A&A, 617, A65 [NASA ADS] [CrossRef] [EDP Sciences] [Google Scholar]
- Conroy, C., Naidu, R. P., Garavito-Camargo, N., et al. 2021, Nature, 592, 534 [NASA ADS] [CrossRef] [Google Scholar]
- Correa Magnus, L., & Vasiliev, E. 2022, MNRAS, 511, 2610 [NASA ADS] [CrossRef] [Google Scholar]
- Cui, X.-Q., Zhao, Y.-H., Chu, Y.-Q., et al. 2012, Res. Astron. Astrophys., 12, 1197 [Google Scholar]
- Dalton, G., Trager, S. C., Abrams, D. C., et al. 2012, SPIE Conf. Ser., 8446, 84460P [Google Scholar]
- Darragh-Ford, E., Hunt, J. A. S., Price-Whelan, A. M., & Johnston, K. V. 2023, ApJ, 955, 74 [NASA ADS] [CrossRef] [Google Scholar]
- de Jong, R. S. 2019, Nat. Astron., 3, 574 [NASA ADS] [CrossRef] [Google Scholar]
- de Jong, R. S., Agertz, O., Berbel, A. A., et al. 2019, The Messenger, 175, 3 [NASA ADS] [Google Scholar]
- DESI Collaboration (Abdul-Karim, M., et al.) 2025, arXiv e-prints [arXiv:2503.14745] [Google Scholar]
- Dillamore, A. M., & Sanders, J. L. 2025, MNRAS, 542, 1331 [Google Scholar]
- Dotter, A. 2016, ApJS, 222, 8 [Google Scholar]
- Eggen, O. J., Lynden-Bell, D., & Sandage, A. R. 1962, ApJ, 136, 748 [NASA ADS] [CrossRef] [Google Scholar]
- Eilers, A.-C., Hogg, D. W., Rix, H.-W., & Ness, M. K. 2019, ApJ, 871, 120 [Google Scholar]
- Eldridge, J. J., Langer, N., & Tout, C. A. 2011, MNRAS, 414, 3501 [NASA ADS] [CrossRef] [Google Scholar]
- Elia, D., Molinari, S., Schisano, E., et al. 2022, ApJ, 941, 162 [NASA ADS] [CrossRef] [Google Scholar]
- Erkal, D., & Belokurov, V. A. 2020, MNRAS, 495, 2554 [NASA ADS] [CrossRef] [Google Scholar]
- Erkal, D., Belokurov, V., Laporte, C. F. P., et al. 2019, MNRAS, 487, 2685 [Google Scholar]
- Ernandes, H., Feuillet, D., Feltzing, S., & Skúladóttir, Á. 2024, A&A, 691, A333 [NASA ADS] [CrossRef] [EDP Sciences] [Google Scholar]
- Evans, F. A., Renzo, M., & Rossi, E. M. 2020, MNRAS, 497, 5344 [Google Scholar]
- Evans, F. A., Marchetti, T., Rossi, E. M., Baggen, J. F. W., & Bloot, S. 2021, MNRAS, 507, 4997 [NASA ADS] [CrossRef] [Google Scholar]
- Evans, F. A., Grondin, S. M., Ye, C. S., et al. 2025, arXiv e-prints [arXiv:2506.14273] [Google Scholar]
- Gaia Collaboration (Vallenari, A., et al.) 2023, A&A, 674, A1 [NASA ADS] [CrossRef] [EDP Sciences] [Google Scholar]
- Gallo, A., Ostorero, L., Chakrabarty, S. S., Ebagezio, S., & Diaferio, A. 2022, A&A, 663, A72 [NASA ADS] [CrossRef] [EDP Sciences] [Google Scholar]
- Garavito-Camargo, N., Besla, G., Laporte, C. F. P., et al. 2019, ApJ, 884, 51 [NASA ADS] [CrossRef] [Google Scholar]
- Garro, E. R., Minniti, D., & Fernández-Trincado, J. G. 2024, A&A, 687, A214 [NASA ADS] [CrossRef] [EDP Sciences] [Google Scholar]
- Gieles, M. 2009, MNRAS, 394, 2113 [NASA ADS] [CrossRef] [Google Scholar]
- Gnedin, O. Y., Gould, A., Miralda-Escudé, J., & Zentner, A. R. 2005, ApJ, 634, 344 [NASA ADS] [CrossRef] [Google Scholar]
- Gvaramadze, V. V., Gualandris, A., & Portegies Zwart, S. 2009, MNRAS, 396, 570 [Google Scholar]
- Han, J. J., El-Badry, K., Lucchini, S., et al. 2025, ApJ, 982, 188 [Google Scholar]
- Harris, C. R., Millman, K. J., van der Walt, S. J., et al. 2020, Nature, 585, 357 [NASA ADS] [CrossRef] [Google Scholar]
- Hasselquist, S., Hayes, C. R., Lian, J., et al. 2021, ApJ, 923, 172 [NASA ADS] [CrossRef] [Google Scholar]
- Hattori, K. 2025, ApJ, 980, 90 [Google Scholar]
- Hattori, K., Taniguchi, D., Tsujimoto, T., et al. 2025, ApJ, 989, 142 [Google Scholar]
- Helmi, A., Babusiaux, C., Koppelman, H. H., et al. 2018, Nature, 563, 85 [Google Scholar]
- Hills, J. G. 1988, Nature, 331, 687 [Google Scholar]
- Hoogerwerf, R., de Bruijne, J. H. J., & de Zeeuw, P. T. 2001, A&A, 365, 49 [NASA ADS] [CrossRef] [EDP Sciences] [Google Scholar]
- Hunter, G. H., Sormani, M. C., Beckmann, J. P., et al. 2024, A&A, 692, A216 [NASA ADS] [CrossRef] [EDP Sciences] [Google Scholar]
- Hunter, J. D. 2007, Comput. Sci. Eng., 9, 90 [NASA ADS] [CrossRef] [Google Scholar]
- Husser, T. O., Wende-von Berg, S., Dreizler, S., et al. 2013, A&A, 553, A6 [NASA ADS] [CrossRef] [EDP Sciences] [Google Scholar]
- Ibata, R. A., Gilmore, G., & Irwin, M. J. 1995, MNRAS, 277, 781 [NASA ADS] [CrossRef] [Google Scholar]
- Juric, M., Ivezic, Z., Brooks, A., et al. 2008, ApJ, 673, 864 [Google Scholar]
- Just, A., Piskunov, A. E., Klos, J. H., Kovaleva, D. A., & Polyachenko, E. V. 2023, A&A, 672, A187 [NASA ADS] [CrossRef] [EDP Sciences] [Google Scholar]
- Kobayashi, Y., Okuda, H., Sato, S., Jugaku, J., & Dyck, H. M. 1983, PASJ, 35, 101 [NASA ADS] [Google Scholar]
- Koposov, S. E. 2019, RVSpecFit: Radial velocity and stellar atmospheric parameter fitting, Astrophysics Source Code Library [record ascl:1907.013] [Google Scholar]
- Koposov, S. 2023, https://doi.org/10.5281/zenodo.10437032 [Google Scholar]
- Koposov, S. E., Gilmore, G., Walker, M. G., et al. 2011, ApJ, 736, 146 [NASA ADS] [CrossRef] [Google Scholar]
- Koposov, S. E., Boubert, D., Li, T. S., et al. 2020, MNRAS, 491, 2465 [Google Scholar]
- Koposov, S. E., Erkal, D., Li, T. S., et al. 2023, MNRAS, 521, 4936 [NASA ADS] [CrossRef] [Google Scholar]
- Koposov, S., Speagle, J., Barbary, K., et al. 2024, https://doi.org/10.5281/zenodo.12537467 [Google Scholar]
- Koposov, S., Li, T. S., Prieto, C. A., et al. 2026, Open J. Astrophys., 9, 55260 [Google Scholar]
- Kreuzer, S., Irrgang, A., & Heber, U. 2020, A&A, 637, A53 [NASA ADS] [CrossRef] [EDP Sciences] [Google Scholar]
- Larsen, S. S. 2008, in Astronomical Society of the Pacific Conference Series, 388, Mass Loss from Stars and the Evolution of Stellar Clusters, eds. A. de Koter, L. J. Smith, & L. B. F. M. Waters, 279 [Google Scholar]
- Leonard, P. J. T., & Duncan, M. J. 1990, AJ, 99, 608 [Google Scholar]
- Levin, Y. 2006, ApJ, 653, 1203 [Google Scholar]
- Li, S., Wang, W., Koposov, S. E., et al. 2025, arXiv e-prints [arXiv:2503.02291] [Google Scholar]
- Liermann, A., Hamann, W. R., & Oskinova, L. M. 2012, A&A, 540, A14 [NASA ADS] [CrossRef] [EDP Sciences] [Google Scholar]
- Liu, C., Ruchti, G., Feltzing, S., & Primas, F. 2017, A&A, 601, A31 [NASA ADS] [CrossRef] [EDP Sciences] [Google Scholar]
- Luna, A., Marchetti, T., Rejkuba, M., et al. 2024, MNRAS, 528, 5495 [Google Scholar]
- Majewski, S. R., Schiavon, R. P., Frinchaboy, P. M., et al. 2017, AJ, 154, 94 [NASA ADS] [CrossRef] [Google Scholar]
- Marchetti, T. 2021, MNRAS, 503, 1374 [NASA ADS] [CrossRef] [Google Scholar]
- Marchetti, T., Contigiani, O., Rossi, E. M., et al. 2018, MNRAS, 476, 4697 [NASA ADS] [CrossRef] [Google Scholar]
- Marchetti, T., Rossi, E. M., & Brown, A. G. A. 2019, MNRAS, 490, 157 [Google Scholar]
- Marchetti, T., Evans, F. A., & Rossi, E. M. 2022, MNRAS, 515, 767 [CrossRef] [Google Scholar]
- McMillan, P. J. 2017, MNRAS, 465, 76 [NASA ADS] [CrossRef] [Google Scholar]
- Miyamoto, M., & Nagai, R. 1975, PASJ, 27, 533 [NASA ADS] [Google Scholar]
- Nagata, T., Woodward, C. E., Shure, M., & Kobayashi, N. 1995, AJ, 109, 1676 [NASA ADS] [CrossRef] [Google Scholar]
- Nandakumar, G., Ryde, N., Schultheis, M., et al. 2025, ApJ, 982, L14 [Google Scholar]
- Navarro, J. F., Frenk, C. S., & White, S. D. M. 1996, ApJ, 462, 563 [Google Scholar]
- Oh, S., & Kroupa, P. 2016, A&A, 590, A107 [NASA ADS] [CrossRef] [EDP Sciences] [Google Scholar]
- Onken, C. A., Wolf, C., Bessell, M. S., et al. 2024, PASA, 41, e061 [NASA ADS] [CrossRef] [Google Scholar]
- Patel, E., Besla, G., & Sohn, S. T. 2017, MNRAS, 464, 3825 [NASA ADS] [CrossRef] [Google Scholar]
- Paxton, B., Bildsten, L., Dotter, A., et al. 2011, ApJS, 192, 3 [Google Scholar]
- Paxton, B., Cantiello, M., Arras, P., et al. 2013, ApJS, 208, 4 [Google Scholar]
- Paxton, B., Marchant, P., Schwab, J., et al. 2015, ApJS, 220, 15 [Google Scholar]
- Peñarrubia, J., Gómez, F. A., Besla, G., Erkal, D., & Ma, Y.-Z. 2016, MNRAS, 456, L54 [CrossRef] [Google Scholar]
- Penoyre, Z., Rossi, E. M., & Stone, N. C. 2025, MNRAS, 542, 322 [Google Scholar]
- Perets, H. B., & Šubr, L. 2012, ApJ, 751, 133 [Google Scholar]
- Portegies Zwart, S. F. 2000, ApJ, 544, 437 [NASA ADS] [CrossRef] [Google Scholar]
- Portegies Zwart, S. F., McMillan, S. L. W., & Gieles, M. 2010, ARA&A, 48, 431 [NASA ADS] [CrossRef] [Google Scholar]
- Poveda, A., Ruiz, J., & Allen, C. 1967, Bol. Observ. Tonantzintla Tacubaya, 4, 86 [Google Scholar]
- Prantzos, N., Abia, C., Chen, T., et al. 2023, MNRAS, 523, 2126 [NASA ADS] [CrossRef] [Google Scholar]
- Price-Whelan, A. M. 2017, J. Open Source Softw., 2, 388 [NASA ADS] [CrossRef] [Google Scholar]
- Rasskazov, A., Fragione, G., Leigh, N. W. C., et al. 2019, ApJ, 878, 17 [Google Scholar]
- Ryde, N., Nandakumar, G., Schultheis, M., et al. 2025, ApJ, 979, 174 [Google Scholar]
- Schlafly, E. F., & Finkbeiner, D. P. 2011, ApJ, 737, 103 [Google Scholar]
- Schlegel, D. J., Finkbeiner, D. P., & Davis, M. 1998, ApJ, 500, 525 [Google Scholar]
- Sersante, B., Penoyre, Z., & Rossi, E. M. 2025, arXiv e-prints [arXiv:2505.08499] [Google Scholar]
- Sesana, A., Haardt, F., & Madau, P. 2006, ApJ, 651, 392 [Google Scholar]
- Sesana, A., Madau, P., & Haardt, F. 2009, MNRAS, 392, L31 [NASA ADS] [Google Scholar]
- Shipp, N., Erkal, D., Drlica-Wagner, A., et al. 2021, ApJ, 923, 149 [NASA ADS] [CrossRef] [Google Scholar]
- Skrutskie, M. F., Cutri, R. M., Stiening, R., et al. 2006, AJ, 131, 1163 [NASA ADS] [CrossRef] [Google Scholar]
- Speagle, J. S. 2020, MNRAS, 493, 3132 [Google Scholar]
- Tauris, T. M., & Takens, R. J. 1998, A&A, 330, 1047 [NASA ADS] [Google Scholar]
- Vasiliev, E. 2019, MNRAS, 482, 1525 [Google Scholar]
- Vasiliev, E. 2023, Galaxies, 11, 59 [NASA ADS] [CrossRef] [Google Scholar]
- Vasiliev, E., & Belokurov, V. 2020, MNRAS, 497, 4162 [Google Scholar]
- Vasiliev, E., & Baumgardt, H. 2021, MNRAS, 505, 5978 [NASA ADS] [CrossRef] [Google Scholar]
- Vasiliev, E., Belokurov, V., & Erkal, D. 2021, MNRAS, 501, 2279 [NASA ADS] [CrossRef] [Google Scholar]
- Verberne, S., Rossi, E. M., Koposov, S. E., et al. 2024, MNRAS, 533, 2747 [NASA ADS] [CrossRef] [Google Scholar]
- Verberne, S., Koposov, S. E., Rossi, E. M., & Penoyre, Z. 2025a, A&A, 701, A58 [NASA ADS] [CrossRef] [EDP Sciences] [Google Scholar]
- Verberne, S., Rossi, E. M., Koposov, S. E., et al. 2025b, A&A, 696, A218 [NASA ADS] [CrossRef] [EDP Sciences] [Google Scholar]
- Virtanen, P., Gommers, R., Oliphant, T. E., et al. 2020, Nat. Methods, 17, 261 [Google Scholar]
- Wagg, T., Hendriks, D. D., Renzo, M., & Breivik, K. 2025, Open J. Astrophys., 8, 85 [Google Scholar]
- Yu, Q., & Madau, P. 2007, MNRAS, 379, 1293 [Google Scholar]
- Yu, Q., & Tremaine, S. 2003, ApJ, 599, 1129 [Google Scholar]
- Zari, E., Villaseñor, J., Kounkel, M., et al. 2025, A&A, 703, A303 [NASA ADS] [CrossRef] [EDP Sciences] [Google Scholar]
- Zasowski, G., Imig, J., & Coluccio, H. 2025, ApJ, 991, 36 [Google Scholar]
We note that if we extend the prior in age towards younger ages, the posterior on the spectro-photometric model also shows a solution for a 14 Myr old star; we do not include this age range as it would imply that the star was formed in the MW halo.
All Tables
All Figures
|
Fig. 1 Fraction of realizations (out of 1000 total) whose first Galactic-plane crossing falls within a radius of 1 kpc around the GC, shown as a function of [Fe/H] for DESI candidates. S5-HVS1 is overplotted in orange for reference (Koposov et al. 2020). The only candidate found, star DESI-312, is shown in red. |
| In the text | |
|
Fig. 2 Comparison between the best-fitting model spectrum (red) and the observed DESI spectra (black) for DESI-312, both provided as part of the first data release of the DESI stellar catalogue (Koposov et al. 2026). From top to bottom, the panels show the red, blue, and Z arms of the spectra. The close agreement between model and data gives no suggestion of a problematic fit or unreliable atmospheric parameters. |
| In the text | |
|
Fig. 3 Corner plot of the posterior distributions for stellar mass M*, log10(Age/yr), [Fe/H], distance d, and reddening E(B- V). Green contours are from the photometry-only fit; blue contours include photometry and the DESI rvspecfit measurements of Teff and logg. Contours indicate the 68%, 95%, and 99.7% credible regions; diagonal panels show the corresponding one-dimensional marginalized posteriors. Titles show the median and 16th and 84th percentiles for the spectro-photometric fit. |
| In the text | |
|
Fig. 4 Hertzsprung-Russell diagram of DESI-312. The orange curves show 1000 samples from the posterior of the spectro-photometric model (see Figure 3). The best-fit isochrone is shown as a dashed line. |
| In the text | |
|
Fig. 5 Example orbit of DESI-312 integrated over the median lifetime in the XZ (top) and XY plane (bottom), in the Galactic Cartesian coordinate system, coloured according to the relative time, with 0 being the current observed position of the star. The orbit is backward integrated for 8.05 Gyr, given by the median on the age posterior for the spectrophotometric model described in 4.1.2. |
| In the text | |
|
Fig. 6 Galactic plane crossing locations for DESI-312, considering all crossings that can take place within the lifetime of the star. The 1σ and 2σ corresponding to regions containing the 68th and 95th percentiles of plane crossings are shown with a continuous and dashed line, respectively. The solar circle is shown in orange for reference. |
| In the text | |
|
Fig. 7 Ejection velocity spectrum from 100000 orbit realizations integrated back by the median lifetime of the star, compensated by the MW rotation curve as given by the MilkyWayPotential2022. |
| In the text | |
|
Fig. 8 Upper panel: ejection velocity from the disc versus galacto-centric distance of the ejection point, consistent with the kinematics of DESI-312. We computed the velocities and distances by sampling observational uncertainties over 100000 orbit realizations, integrated backwards over the star’s median lifetime; points are coloured according to the normalized density of orbit crossings in the radius-velocity plane. Lower panel: Fe abundance profiles of the gas 9 Gyr ago (green), 4.56 Gyr ago (yellow), and at present (red), from Prantzos et al. (2023) models. |
| In the text | |
|
Fig. 9 Comparison of Galactic plane crossings for the different distance estimates available for DESI-312. For each estimate, the 2σ region is shown, obtained using the method described in Section 3, with the sampling increased to 100000 Monte Carlo realizations. DESI-312 shows consistency with a GC origin for the first crossing with all available distance estimations. |
| In the text | |
|
Fig. 10 Integral of motion space for 100000 simulated dynamically ejected runaway stars and hyper-runaway stars following the Perets & Šubr (2012) velocity distribution. DESI-312 is shown in black, with energy and angular momentum compatible at the 1σ level with Lz = 0, but mainly a counter-rotating angular momentum. |
| In the text | |
Current usage metrics show cumulative count of Article Views (full-text article views including HTML views, PDF and ePub downloads, according to the available data) and Abstracts Views on Vision4Press platform.
Data correspond to usage on the plateform after 2015. The current usage metrics is available 48-96 hours after online publication and is updated daily on week days.
Initial download of the metrics may take a while.