Fig. 2
Download original image
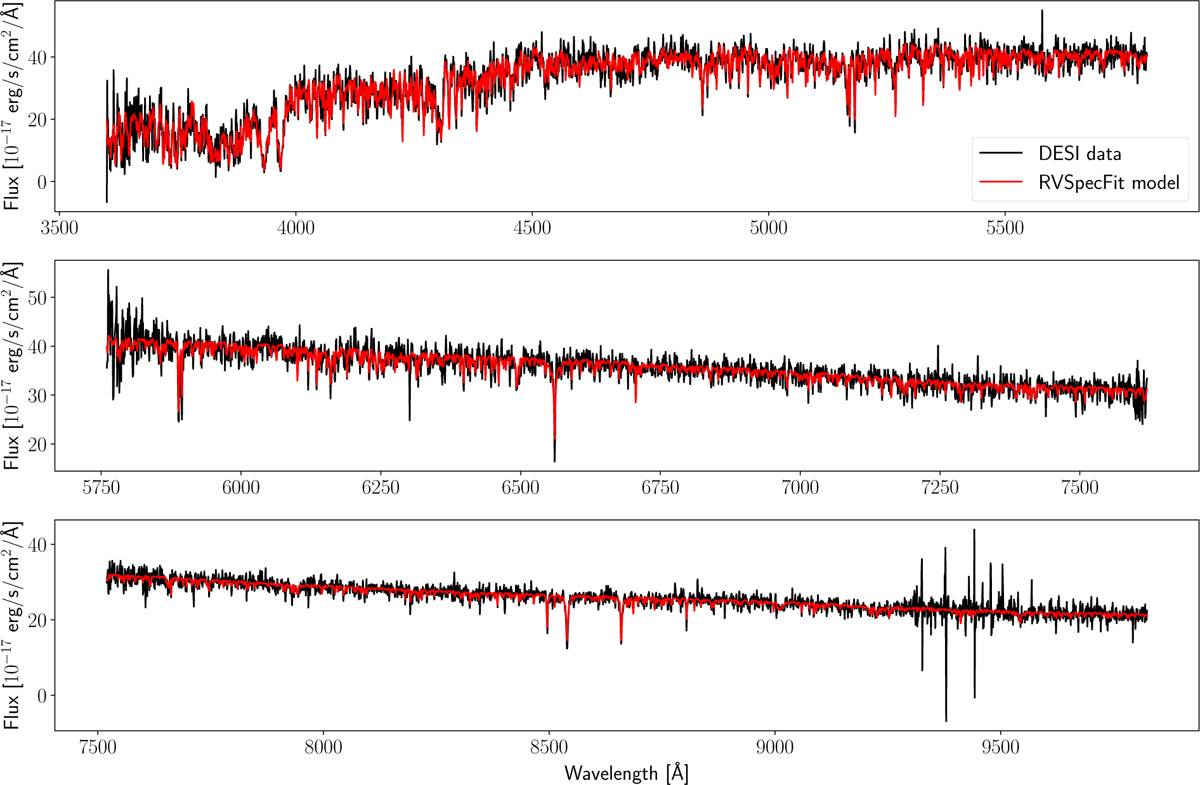
Comparison between the best-fitting model spectrum (red) and the observed DESI spectra (black) for DESI-312, both provided as part of the first data release of the DESI stellar catalogue (Koposov et al. 2026). From top to bottom, the panels show the red, blue, and Z arms of the spectra. The close agreement between model and data gives no suggestion of a problematic fit or unreliable atmospheric parameters.
Current usage metrics show cumulative count of Article Views (full-text article views including HTML views, PDF and ePub downloads, according to the available data) and Abstracts Views on Vision4Press platform.
Data correspond to usage on the plateform after 2015. The current usage metrics is available 48-96 hours after online publication and is updated daily on week days.
Initial download of the metrics may take a while.