| Issue |
A&A
Volume 696, April 2025
|
|
|---|---|---|
| Article Number | C1 | |
| Number of page(s) | 5 | |
| Section | Planets, planetary systems, and small bodies | |
| DOI | https://doi.org/10.1051/0004-6361/202554447e | |
| Published online | 28 March 2025 | |
Fully time-dependent cloud formation from a non-equilibrium gas-phase in exoplanetary atmospheres (Corrigendum)
1
Institute of Astronomy, KU Leuven,
Celestijnenlaan 200D,
3001
Leuven,
Belgium
2
Space Research Institute, Austrian Academy of Sciences,
Schmiedlstrasse 6,
8042
Graz, Austria
3
Institute for Theoretical Physics and Computational Physics, Graz University of Technology,
Petersgasse 16
8010
Graz, Austria
★ Corresponding author; This email address is being protected from spambots. You need JavaScript enabled to view it.
Key words: astrochemistry / methods: analytical / planets and satellites: atmospheres / errata, addenda
A follow-up study on TiO2 nucleation revealed a unit conversion error in the calculation of the original TiO2 nucleation rates. This error concerns all two-body association and dissociation reaction rates of TiO2 clusters, which were overestimated in the numerical evaluations.
A re-analysis with the correct nucleation rates was performed and confirmed the qualitative conclusions of the original manuscript. However, several results changed quantitatively. The corrected rates for TiO2 cluster sizes 1 to 4 can be seen in Fig. 1, where
 (1)
(1)
Evaluating the kinetic chemistry with the correct reaction rates leads to a slower nucleation of TiO2 (see Fig. 2). The depletion of oxygen-bearing gas-phase species is not affected by this change. The change in the CH4 number density due to the SiO-SiO2 cycle is slightly less significant (see Fig. 3). Our analysis of the kinetic nucleation of TiO2 reflects the longer nucleation timescales and the nucleation rate peaks between 0.1 to 1 second, which is two orders of magnitudes higher than before (see Fig. 4). However, the temperature range for which the formation of larger TiO2 clusters is favoured changes by less than 50 K compared to the original manuscript (see Fig. 5). Lastly, our simulations of HD 209458 b show a lower nucleation rate (see Figs. 6, 7, and 8). The lower nucleation rate also leads to a temporary increase in the average cloud particle size. This is relevant if the cloud formation timescales are to be compared to other chemical or dynamical timescales in exoplanet atmospheres.
Still, the conclusion of the original work stands, that cloud particle surface reactions allow a catalytic SiO-SiO2 cycle, which affects the CH4 gas-phase number density. Nucleation is now found to reach constant cloud particle number densities within 100 seconds.
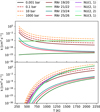 |
Fig. 1 Reaction rate coefficients for the formation of TiO2 clusters up to (TiO2)4. All solid lines assume pgas = 0.002 bar. Top: association reactions. Bottom: dissociation reactions. |
Offset values between number densities of given molecular species for different chemical networks.
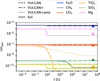 |
Fig. 2 Concentrations of selected gas-phase species for pgas = 0.002 bar at Tgas = 1378 K using different chemical kinetics networks. The diamond marker shows GGchem results that including equilibrium condensation. |
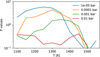 |
Fig. 3 Differences in CH4 abundance between chemical equilibrium and the full network for various temperatures and pressures. |
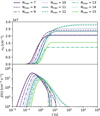 |
Fig. 4 Cloud particle number densities (top) and nucleation rates (bottom) for TiO2 nucleation with different Nmax at pgas = 0.02 bar and Tgas = 1379 K. |
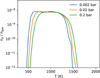 |
Fig. 5 Cloud particle concentrations for TiO2 nucleation for a range of temperatures and pressures. |
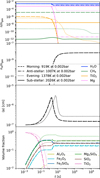 |
Fig. 6 Concentrations of selected gas-phase species (top), cloud particle number density (upper middle), mean cloud particle size (lower middle), and selected volume fractions (bottom) at the sub-stellar point, evening terminator, anti-stellar point, and morning terminator at pgas = 0.002 bar. The sub-stellar point does not form clouds. |
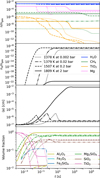 |
Fig. 7 Concentrations of selected gas-phase species (top), cloud particle number density (upper middle), mean cloud particle size (lower middle), and selected volume fractions (bottom) for logarithmically spaced pressures along the evening terminator. |
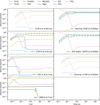 |
Fig. 8 Volume fractions for Tgas - pgas points of HD 209458 b. The sub-stellar point (pgas = 0.002 bar, Tgas = 2026 K) is not shown since no cloud formation occurs. |
Bulk growth reactions considered for this study.
Acknowledgements
The authors thank Laura X. Worutowicz for her help with finding and correcting the unit conversion error.
References
- Helling, Ch., Gourbin, P., Woitke, P., & Parmentier, V. 2019, A&A, 626, A133 [NASA ADS] [CrossRef] [EDP Sciences] [Google Scholar]
© The Authors 2025
 Open Access article, published by EDP Sciences, under the terms of the Creative Commons Attribution License (https://creativecommons.org/licenses/by/4.0), which permits unrestricted use, distribution, and reproduction in any medium, provided the original work is properly cited.
This article is published in open access under the Subscribe to Open model. This email address is being protected from spambots. You need JavaScript enabled to view it. to support open access publication.
All Tables
Offset values between number densities of given molecular species for different chemical networks.
All Figures
|
Fig. 1 Reaction rate coefficients for the formation of TiO2 clusters up to (TiO2)4. All solid lines assume pgas = 0.002 bar. Top: association reactions. Bottom: dissociation reactions. |
| In the text | |
|
Fig. 2 Concentrations of selected gas-phase species for pgas = 0.002 bar at Tgas = 1378 K using different chemical kinetics networks. The diamond marker shows GGchem results that including equilibrium condensation. |
| In the text | |
|
Fig. 3 Differences in CH4 abundance between chemical equilibrium and the full network for various temperatures and pressures. |
| In the text | |
|
Fig. 4 Cloud particle number densities (top) and nucleation rates (bottom) for TiO2 nucleation with different Nmax at pgas = 0.02 bar and Tgas = 1379 K. |
| In the text | |
|
Fig. 5 Cloud particle concentrations for TiO2 nucleation for a range of temperatures and pressures. |
| In the text | |
|
Fig. 6 Concentrations of selected gas-phase species (top), cloud particle number density (upper middle), mean cloud particle size (lower middle), and selected volume fractions (bottom) at the sub-stellar point, evening terminator, anti-stellar point, and morning terminator at pgas = 0.002 bar. The sub-stellar point does not form clouds. |
| In the text | |
|
Fig. 7 Concentrations of selected gas-phase species (top), cloud particle number density (upper middle), mean cloud particle size (lower middle), and selected volume fractions (bottom) for logarithmically spaced pressures along the evening terminator. |
| In the text | |
|
Fig. 8 Volume fractions for Tgas - pgas points of HD 209458 b. The sub-stellar point (pgas = 0.002 bar, Tgas = 2026 K) is not shown since no cloud formation occurs. |
| In the text | |
Current usage metrics show cumulative count of Article Views (full-text article views including HTML views, PDF and ePub downloads, according to the available data) and Abstracts Views on Vision4Press platform.
Data correspond to usage on the plateform after 2015. The current usage metrics is available 48-96 hours after online publication and is updated daily on week days.
Initial download of the metrics may take a while.