| Issue |
A&A
Volume 682, February 2024
|
|
|---|---|---|
| Article Number | A150 | |
| Number of page(s) | 22 | |
| Section | Planets and planetary systems | |
| DOI | https://doi.org/10.1051/0004-6361/202347441 | |
| Published online | 16 February 2024 | |
Fully time-dependent cloud formation from a non-equilibrium gas-phase in exoplanetary atmospheres
1
Institute of Astronomy, KU Leuven,
Celestijnenlaan 200D,
3001
Leuven,
Belgium
e-mail: This email address is being protected from spambots. You need JavaScript enabled to view it.
2
Space Research Institute, Austrian Academy of Sciences,
Schmiedlstrasse 6,
8042
Graz,
Austria
3
Institute for Theoretical Physics and Computational Physics, Graz University of Technology,
Petersgasse 16,
8010
Graz,
Austria
Received:
12
July
2023
Accepted:
6
November
2023
Abstract
Context. Recent observations suggest the presence of clouds in exoplanet atmospheres, but they have also shown that certain chemical species in the upper atmosphere might not be in chemical equilibrium. Present and future interpretation of data from, for example, CHEOPS, JWST, PLATO, and Ariel require a combined understanding of the gas-phase and the cloud chemistry.
Aims. The goal of this work is to calculate the two main cloud formation processes, nucleation, and bulk growth consistently from a non-equilibrium gas phase. The aim is also to explore the interaction between a kinetic gas-phase and cloud microphysics.
Methods. The cloud formation is modelled using the moment method and kinetic nucleation, which are coupled to a gas-phase kinetic rate network. Specifically, the formation of cloud condensation nuclei is derived from cluster rates that include the thermochemical data of (TiO2)N from N = 1 to 15. The surface growth of nine bulk Al, Fe, Mg, O, Si, S, and Ti binding materials considers the respective gas-phase species through condensation and surface reactions as derived from kinetic disequilibrium. The effect of the completeness of rate networks and the time evolution of the cloud particle formation is studied for an example exoplanet, HD 209458 b.
Results. A consistent, fully time-dependent cloud formation model in chemical disequilibrium with respect to nucleation, bulk growth, and the gas-phase is presented and first test cases are studied. This model shows that cloud formation in exoplanet atmospheres is a fast process. This confirms previous findings that the formation of cloud particles is a local process. Tests on selected locations within the atmosphere of the gas-giant HD 209458 b show that the cloud particle number density and volume reach constant values within 1 s. The complex kinetic polymer nucleation of TiO2 confirms results from classical nucleation models. The surface reactions of SiO[s] and SiO2[s] can create a catalytic cycle that dissociates H2 to 2 H, resulting in a reduction of the CH4 number densities.
Key words: astrochemistry / planets and satellites: atmospheres / methods: analytical
© The Authors 2024
 Open Access article, published by EDP Sciences, under the terms of the Creative Commons Attribution License (https://creativecommons.org/licenses/by/4.0), which permits unrestricted use, distribution, and reproduction in any medium, provided the original work is properly cited.
This article is published in open access under the Subscribe to Open model. This email address is being protected from spambots. You need JavaScript enabled to view it. to support open access publication.
1 Introduction
Clouds and dust are present in many astrophysical environments. In stellar environments, dust can be found in the outflows of asymptotic giant branch (AGB) stars (e.g. Gail et al. 1984; Fleischer et al. 1999; Ferrarotti & Gail 2006; Höfner 2009; Gobrecht et al. 2016; Khouri et al. 2016; Decin et al. 2017) and Wolf–Rayet (WR) stars (Williams et al. 1987; Crowther 2003; Lau et al. 2022). It can also be found in supernovae (Tinyanont et al. 2019; Niculescu-Duvaz et al. 2022; Zhang et al. 2022). Dust produced in these environments replenishes the interstellar medium (ISM) through radiation-driven mass loss. In cooler objects, clouds are predicted within brown dwarfs (Allard et al. 2001; Ackerman & Marley 2001; Helling et al. 2004), and indirect evidence of clouds in brown dwarfs has been found (Maire et al. 2020; Ward-Duong et al. 2020; Kammerer et al. 2021). Exoplanet atmospheres are also expected to have a strong cloud presence (Helling et al. 2023). Cloud particles typically have large opacities, which lead to characteristically flat spectra in the optical and near infrared. Furthermore, several exoplanet observations in these wavelength ranges show a flat spectrum (Bean et al. 2010; Kreidberg et al. 2014; Espinoza et al. 2019; Spyratos et al. 2021; Libby-Roberts et al. 2022). To understand cloud formation, one also needs to understand gas-phase chemistry and the nucleation process. In AGB stars, many chemical species have been detected (e.g. AlF, MgNC, NaCN, CO, SiO, HCN, CS, PAHs; Highberger et al. 2001; Decin et al. 2008; Smolders et al. 2010). For exoplanets, recent medium- and high-resolution observations detected the presence of several atomic (e.g. Mg, Na, Ca, Cr, Fe, Ni, V, Ti, Mn, O; Hoeijmakers et al. 2018a, 2020; Prinoth et al. 2022; Borsa et al. 2022) and molecular species (e.g. CO, H2O, CH4, NH3, C2H2; de Kok et al. 2013; Hoeijmakers et al. 2018b; Guilluy et al. 2022; Guillot et al. 2022), pointing to a chemically rich environment.
In collisionally dominated environments, the gas-phase can be modelled using chemical equilibrium models (Stock et al. 2018; Woitke & Helling 2021). This is a good assumption for the deep atmosphere of exoplanets and brown dwarfs (Venot et al. 2018) where the collisional timescales become small. In low-density environments, such as the outflow of AGB stars (Plane & Robertson 2022; Sande & Millar 2019) and the upper atmospheres of exoplanets (Rimmer & Helling 2013; Baxter et al. 2021; Tsai et al. 2023; Mendonça et al. 2018) and brown dwarfs (Helling & Rimmer 2019; Lee et al. 2020), collisional timescales become large. In these environments, chemical disequilibrium processes such as radiation or quenching can drive the gas-phase abundances out of equilibrium.
The formation of clouds and dust starts with the formation of cloud condensation nuclei (CCNs). In gaseous exoplanets, CCNs cannot originate from the planet’s surface as they do in terrestrial planets; they have to be formed directly from the gas phase through nucleation, which marks the transition from gas-phase chemistry to solid-phase chemistry. Classical nucleation theory (CNT) or modified classical nucleation theory (MCNT) is an often-used approach to describe the rate at which CCNs are formed (nucleation rate). In order to describe the actual formation of clusters leading up to CCNs, a kinetic description can be used. (Patzer et al. 1998; Lee et al. 2015; Bromley et al. 2016; Boulangier et al. 2019; Köhn et al. 2021; Gobrecht et al. 2022). To calculate kinetic nucleation, the thermodynamic properties of clusters of the nucleating species have to be known. There are active efforts to derive the structures and properties of species that are associated with nucleation processes (Chang et al. 2005, 2013; Patzer et al. 2014; Lee et al. 2015; Gobrecht et al. 2022; Sindel et al. 2022; Andersson et al. 2023). Even in the cases where data are available, this is often limited to the smallest cluster sizes because calculating the required properties becomes more computationally intensive for larger clusters (Sindel et al. 2022).
Supersaturated species can grow onto CCNs once they are present. There are two main ways these bulk growth processes can occur. First there is condensation, which describes the deposition of gas-phase species onto CCNs (e.g. SiO → SiO[s]). Many models use condensation curves to determine where clouds can form (e.g. Demory et al. 2013; Webber et al. 2015; Crossfield 2015; Kempton et al. 2017; Roman & Rauscher 2017; Roman et al. 2021). Second, bulk growth can occur through kinetic surface reactions (Patzer et al. 1998; Helling & Woitke 2006; Helling & Fomins 2013). In contrast to condensation, surface reactions include multiple chemical species to form the bulk material (e.g. SiS + H2O → SiO[s] + H2S ). In addition to providing additional bulk growth paths for condensing species, surface reactions also allow the bulk growth of materials that may not be stable in the gas phase themselves. Both processes can be described kinetically (Patzer et al. 1998).
In this paper, we present a fully time-dependent description of the processes that lead to the formation of clouds in exoplanets or dust in brown dwarfs, stars, and supernovae. We advanced the nucleation description by modelling potential chemical pathways based on thermodynamic cluster properties and expand the kinetic description of surface reactions to chemical disequilibrium. With this model, we studied the timescales of cloud formation in exoplanet atmospheres. The description of the chemical network, kinetic nucleation and bulk growth is given in Sect. 2. The kinetic chemistry and kinetic nucleation are investigated in Sect. 3. The fully kinetic cloud formation model is then applied to temperature-pressure (Tgas-pgas) points within the atmosphere of HD 209458 b (Sect. 4). Lastly, the summary is given in Sect. 5.
2 Model
We present the models for the gas phase, kinetic nucleation, and bulk growth through condensation and surface reactions. In Sect. 2.1, we describe our chemical kinetics network of the gas phase. The kinetic nucleation, which describes the time-dependent nucleation within disequilibrium environments, is described in Sect. 2.2 (two-body reactions) and in Sect. 2.3 (three-body reactions). In Sect. 2.4, we describe the bulk growth through condensation and surface reactions. The derivation of the reaction supersaturation is given in Sect. 2.5. Finally, the connection between nucleation and bulk growth is described in Sect. 2.6.
2.1 Gas-phase chemistry
The evolution of the number density ni (cm−3) of a given species i is determined by the following equation:
 (1)
(1)
where Fi is the set of reactions where the ith species is a product, Di is the set of reactions where the ith species is a reactant, Er is the set of reactants of reaction r, ni (cm−3) is the number densities of the reactants, νi,r is the stoichiometric coefficient of the ith species within reaction r, kr  is the reaction rate for the reaction r, and Jr is the number of reactants in Er. The sum overall nj is the total number density. The numerical solver is described in Appendix A.
Chemical kinetic networks for the atmospheres of exoplanets include several hundred species and several thousand reactions (e.g. Rimmer & Helling 2016; Tsai et al. 2017, 2021; Venot et al. 2012, 2020). For this paper, we chose the NCHO thermo network of VULCAN1,2 (Tsai et al. 2017, 2021). This network includes 69 species and 780 reactions. In this work, TiO2 is considered as the nucleation species. Because NCHO thermo network of VULCAN does not include reactions for the formation of TiO2, we added several reactions from Boulangier et al. (2019) leading to the formation of TiO2. The selected gas-phase reactions can be found in Table E.1. Furthermore, we added reactions including Si species for the bulk growth species SiO and SiO2 (see Sect. 2.4 and Table E.1).
All calculations start from chemical equilibrium abundances calculated using GGchem (Woitke & Helling 2021) for a solarlike composition (Asplund et al. 2009). A list of the considered species for the equilibrium calculation is given in Appendix B.
2.2 Nucleation
Nucleation reaction networks are ideally constructed by considering multiple reaction pathways. Unfortunately, few such studies exist (see e.g. Bromley et al. 2016; Gobrecht et al. 2022; Andersson et al. 2023). In the kinetic network approach, the change in cluster number densities can be described as
 (2)
(2)
where nN (cm−3) is the number density of a given polymer of size N (also called N-mer), FN is the set of forward reactions involving the N-mer, DN is the set of backward reactions involving the N-mer,  is the forward reaction rate coefficient of reaction r,
  is the backward reaction rate coefficient of reaction r, and Jr is the number of reactants.
We describe the growth reactions of nucleating species as two-body reactions (a + b → c). The forward reaction rate coefficient  can then be described as follows (Peters 2017; Boulangier et al. 2019):
 (3)
(3)
where υr (cm s−1) is the relative velocity of the collision partners, αr(υr) is the sticking coefficient, σr(υr) (cm2) is the reaction cross-section, and ƒ(υr) is the relative velocity distribution of the colliding particles. Similarly to other work, we set the sticking coefficient αj(vr) to 1 because detailed values for nucleation reactions are not yet available (e.g. Lazzati 2008; Bromley et al. 2016; Boulangier et al. 2019). The cross-section is approximated by a collision of two hard spheres:
 (4)
(4)
where r1 and r (cm) are the interaction radii of the reaction partners. For this work, we considered radii including electrostatic forces (Köhn et al. 2021; Gobrecht et al. 2022; Kiefer et al. 2023). The relative velocity distribution is described by a Maxwell-Boltzmann distribution:
 (5)
(5)
where Tgas (K) is the temperature, kB = 1.381 × 10⁻²³ erg K−1 is the Boltzmann constant, and
 (6)
(6)
is the reduced mass (g) with m1; m2 (g) being the masses of the reaction partners. Solving the integral from Eq. (3) yields:
 (7)
(7)
The backwards reaction rate (c → a + b) is derived by assuming detailed balance. For this, an equilibrium state needs to be defined, which we assume to be the chemical equilibrium state such that the law of mass action can be applied:
 (8)
(8)
where p⊖ = 105 Pa is the standard pressure and  (Tgas) (erg) is the Gibbs free energy of an i-mer at standard pressure.
For this study, we considered TiO2 as nucleating species. The chemical network is extended by including all forward (Eq. (3)) and backward reactions (Eq. (8)) from the monomer up to the 15-mer. The Gibbs free energy data is taken from Sindel et al. (2022).
2.3 Three-body reactions for cluster formation
Three-body reactions are important for the formation of small clusters. On the one hand, third bodies can remove the energy of formation from an association (forward) reaction, thus increasing cluster formation rates. On the other hand, collisions with third bodies can induce dissociation (backward) reactions. For this work, we considered three-body reactions for the cluster formation of TiO2 up to (TiO2)4. The reaction rates are taken from Kiefer et al. (2023) (see reaction numbers RNr 19 to 26 in Table E.1).
To determine for which temperature and pressures three-body reactions dominate over two-body reactions, we compared the reaction rate coefficients. To allow a direct comparison, we multiplied the reaction rate coefficients with the number density of third bodies. The comparison can be seen in Fig. 1. For reactions RNr 19 and 20, multiple pressures are shown. Since all three-body reactions have the same pressure dependence, the scaling is the same for all of them. For two-body reactions, we used the following shorthand notation:
 (9)
(9)
For the association and dissociation of (TiO2)2 from and into two monomers, respectively (RNr 19/20 and NU(1, 1)), the three-body reaction becomes dominant below Tgas = 400 K and for pressures higher than pgas = 0.001 bar. Above Tgas = 1300 K and for pressures lower than pgas = 10 bar, the two-body reaction becomes dominant. In between, either type of reaction can be dominant. At higher pressures (e.g. pgas > 1000 bar), the three-body reaction becomes dominant even at high temperatures (e.g. Tgas > 2000 K). For all other reactions compared in this section (RNr 21/22, 23/24, 25/26 and NU(2, 1), NU(2, 2), and NU(3, 1)), the two-body reaction typically dominates above Tgas > 400 K. Three-body reactions only start to become important at very high pressures (e.g. pgas > 1000 bar).
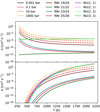 |
Fig. 1 Reaction rate coefficients for formation of TiO2 clusters up to (TiO2)4. All solid lines assume pgas = 0.002 bar. Top: association reactions. Bottom: dissociation reactions. |
2.4 Bulk growth
In order to describe the bulk growth by gas-surface reaction, we applied the moment method (Gail & Sedlmayr 1986, 1988; Dominik et al. 1993; Helling et al. 2001; Helling & Woitke 2006). The jth moment Lj (cmJ g−1) is defined as
 (10)
(10)
where j ∈ {0, 1, 2, 3}, V (cm3) is the cloud particle volume, Vl (cm3) is the minimum volume of a cloud particle to start bulk growth, ρ [cm−3] is the gas density and ƒ(V) (cm−6) is the cloud particle size distribution function. Using these moments the following cloud particle properties can be derived (Gail & Sedlmayr 1988; Helling et al. 2001):
 (11)
(11)
 (12)
(12)
 (13)
(13)
 (14)
(14)
where nd (cm−3) is the cloud particle number density, 〈a〉 [cm] the mean cloud particle radius, 〈A〉 (cm2) the mean cloud particle surface area, and 〈V〉 (cm3) the mean cloud particle volume. The change in the moments is determined by the nucleation and bulk growth and is described by the following set of equations3 (Helling & Woitke 2006):
 (15)
(15)
 (16)
(16)
 (17)
(17)
where J★(Vl) [cm−3] is the nucleation rate (see Sect. 2.6), Cd is the set of surface reactions, ∆Vr (cm3) is the volume increase per surface reaction r,  (cm−3) is the number density of the key gas-phase species,
  is the stochiometirc coefficient of the key gas-phase species for the surface reaction r, 〈υr〉 (cm s−1) is the average relative velocity between the cloud particle and the key gas-phase species, Sr is the reaction supersaturation (see Sect. 2.5), and
  is the surface area fraction of the given bulk growth material. ;χnet (cm s−1) is the net growth velocity. The key gas-phase species is the least abundant species involved in a given bulk growth reaction (Woitke & Helling 2003; Helling & Woitke 2006). The left term in the bracket of Eq. (17) represents the growth and the right term represents the evaporation. The cloud particle grows if the net sign of the bracket is positive and evaporates if it is negative. Similarly to Helling & Woitke (2006), we assume that the surface area fraction can be approximated by the following volume fraction:
 (18)
(18)
where Atot (cm2) is the total cloud particle surface area and Vtot (cm3) is the total cloud particle volume. The volume fraction of each cloud particle material is tracked separately.
The growth of cloud particles through bulk growth depletes the gas-phase. Therefore, we adjust the number densities ni of the species i involved in the surface reaction r (Helling & Woitke 2006):
 (19)
(19)
where δ(i) is equal to 1 for products and −1 for reactants.
For this study, we considered TiO2[s], Al2O3[s], SiO[s], SiO2[s], MgO[s], Mg2SiO4[s], FeO[s], FeS[s], Fe2O3[s], and Fe2SiO4[s] as bulk growth materials and include the surface reactions listed in Table E.2.
2.5 Reaction supersaturation
To calculate the net growth velocity as described in Eq. (17), the reaction supersaturation needs to be calculated. Surface growth and evaporation of a material s can occur via three types of reactions:
 (20)
(20)
 (21)
(21)
 (22)
(22)
where X is a reactant, Y a product, A(N) a cloud particle containing N units of bulk growth material4 (e.g. Mg2SiO4 would be 1 unit for Mg2SiO4[s]), F the set of reactants, D the set of products, and vi,r the stochiometric coefficients of the species i for the surface reaction r. Type 1 reactions describe condensation, Type 2 reactions are chemical growth reactions, and Type 3 reactions involve surface chemistry. Cloud particles are assumed to be large enough for the following approximation to hold:
 (23)
(23)
where  (erg) is the Gibbs free energy of formation at the standard pressure of the A(N) cloud particle made from N units and
  (erg) is the Gibbs free energy of formation of a solid unit at standard pressure. The goal of this section is to find the reaction supersaturation Sr of these reactions defined as
 (24)
(24)
where Rf (s−1) is the growth rate and Rb [s−1] is the evaporation rate. It is important to note that the following derivations were done in chemical disequilibrium. At no point in this section do we assume chemical equilibrium.
2.5.1 Sr of Type 1 reactions (condensation)
Type 1 reactions are reactions where the reactant is also the bulk growth material. In this case the reaction supersaturation is equal to the supersaturation of the growth species:
 (25)
(25)
where  (dyn cm−2) is the vapour pressure of species X, pX (dyn cm−2) is the partial pressure of species X, nX (cm−3) is the gas-phase number density of species X, Tgas (K) is the temperature, and
  [erg] is the Gibbs free energy of formation of the condensing species in the gas phase at standard pressure. Since the bulk growth material exists in the gas-phase, the supersaturation is well defined.
2.5.2 Sr of Type 2 reactions
Type 2 reactions were discussed in detail in previous studies (Gail & Sedlmayr 1988; Gauger et al. 1990; Dominik et al. 1993; Patzer et al. 1998). The reaction supersaturation is given by (adapted from Patzer et al. 1998):
 (26)
(26)
where  (erg) and
  [erg] are the Gibbs free energies of formation of the gas-phase reactant and product, respectively. nX (cm−3) is the number density of the reactant X and nY (cm−3) is the number density of the product Y. Type 2 reactions are well defined even if the bulk growth material is not present in the gas-phase (see Patzer et al. 1998 for further details).
2.5.3 Sr of Type 3 reactions
Type 3 reactions involve surface chemistry. Considering these reactions is especially important if the bulk growth material is not present in the gas phase. For example, Mg2SiO4[s] can condense via the surface reaction
![Mathematical equation: $2{\rm{Mg}} + {\rm{SiO}} + 3{{\rm{H}}_2}{\rm{O}} \leftrightarrow {\rm{M}}{{\rm{g}}_2}{\rm{Si}}{{\rm{O}}_4}[{\rm{s}}] + 3{{\rm{H}}_2}.$](/articles/aa/full_html/2024/02/aa47441-23/aa47441-23-eq41.png) (27)
(27)
To simplify the notation, we used the reaction of Eq. (27) as an example for this section and generalise the results at the end. For our example in this section, we assumed Mg to be the key gas-phase species. The bulk growth rate of this reaction can then be described by the following (adapted from Helling & Woitke 2006):
![Mathematical equation: ${R_f} = \left[ {{A_{{\rm{A}}(N - 1)}}{v_{{\rm{key }}}}{1 \over {v_r^{{\rm{key }}}}}} \right]{n_{{\rm{key }}}},$](/articles/aa/full_html/2024/02/aa47441-23/aa47441-23-eq42.png) (28)
(28)
where AA(N−1) (cm2) is the surface area of the A(N − 1) cloud particle, nA(N−1) (cm−3) the number density of the A(N − 1) cloud particle, νkey [cm s−1] the relative velocity of the cloud particle and the key gas-phase species (e.g. Mg), and nkey [cm−3] the number density of the key gas-phase species (e.g. Mg). Phase equilibrium for a given bulk growth reaction (short PGR, noted with º) is characterised5 by the evaporation rate equalling the growth rate  . Therefore, according to Eq. (28), the evaporation rate is:
![Mathematical equation: ${R_b} = \left[ {{A_{{\rm{A}}(N - 1)}}{v_{{\rm{key }}}}{1 \over {v_r^{{\rm{key }}}}}} \right]n_{{\rm{key }}}^^\circ ,$](/articles/aa/full_html/2024/02/aa47441-23/aa47441-23-eq44.png) (29)
(29)
where  (cm−3) is the number density of the key gas-phase species in PGR (e.g. Mg). Since all non-key-gas-phase species are typically much more abundant than the key-gas-phase species, their number densities in non-PGR only slightly differ from their number densities in PGR. Therefore, the following approximation holds:
 (30)
(30)
This allows us to write the reaction supersaturation as
![Mathematical equation: $S_r^2 = {{{{\left( {{n_{{\rm{Mg}}}}} \right)}^2}} \over {{{\left( {n_{{\rm{Mg}}}^^\circ } \right)}^2}}} = {{{{\left( {{n_{{\rm{Mg}}}}} \right)}^2}} \over {{{\left( {n_{{\rm{Mg}}}^^\circ } \right)}^2}}}{{n_{{\rm{SiO}}}^^\circ {{\left( {n_{{{\rm{H}}_2}{\rm{O}}}^^\circ } \right)}^3}{{\left( {{n_{{{\rm{H}}_2}}}} \right)}^3}} \over {{n_{{\rm{SiO}}}}{{\left( {{n_{{{\rm{H}}_2}{\rm{O}}}}} \right)}^3}{{\left( {n_{{{\rm{H}}_2}}^^\circ } \right)}^3}}}\left[ {{{{n_{{\rm{SiO}}}}{{\left( {{n_{{{\rm{H}}_2}{\rm{O}}}}} \right)}^3}{{\left( {n_{{{\rm{H}}_2}}^^\circ } \right)}^3}} \over {n_{{\rm{SiO}}}^^\circ {{\left( {n_{{{\rm{H}}_2}{\rm{O}}}^^\circ } \right)}^3}{{\left( {{n_{{{\rm{H}}_2}}}} \right)}^3}}}} \right],$](/articles/aa/full_html/2024/02/aa47441-23/aa47441-23-eq47.png) (31)
(31)
![Mathematical equation: $\eqalign{ & {\cal L} = \left[ {\sum\limits_{j \in E} {{N_j}} G_j^ \ominus + {N_j}{k_{\rm{B}}}{T_{{\rm{gas}}}}\ln \left( {{{{N_j}} \over N}} \right)} \right] \cr & \,\,\,\,\,\,\,\,\,\,\,\, + {\lambda _1}\left( {{C_1} + {N_{{\rm{Mg}}}} - 2{N_{{\rm{SiO}}}}} \right) \cr & \,\,\,\,\,\,\,\,\,\,\,\, + {\lambda _2}\left( {{C_2} + 3{N_{{\rm{Mg}}}} - 2{N_{{{\rm{H}}_2}{\rm{O}}}}} \right) \cr & \,\,\,\,\,\,\,\,\,\,\,\, + {\lambda _3}\left( {{C_3} + {N_{{\rm{Mg}}}} - 2{N_{{\rm{A}}(N - 1)}}} \right) \cr & \,\,\,\,\,\,\,\,\,\,\,\, + {\lambda _4}\left( {{C_4} - 3{N_{{\rm{Mg}}}} - 2{N_{{{\rm{H}}_2}}}} \right) \cr & \,\,\,\,\,\,\,\,\,\,\,\, + {\lambda _5}\left( {{C_5} - {N_{{\rm{Mg}}}} - 2{N_{{\rm{A}}(N)}}} \right), \cr} $](/articles/aa/full_html/2024/02/aa47441-23/aa47441-23-eq49.png) (32)
(32)
leaving only the ratios of gas number densities in PGR to find.
We started the derivation with a thought experiment by imagining a box containing a given elemental abundance of Mg, SiO, H2O, H2, A(N − 1), and A(N). We assume that in this box, gas-phase species only react with each other via the specific surface reaction from Eq. (27). Over time, the box will evolve towards PGR for this specific chemical configuration. In PGR, the entropy of the box will be maximised, which is equivalent to minimising the Gibbs free energy for the reactants and products of the given reaction. This minimisation problem with its constraints can be expressed in the following Lagrangian function:
 (33)
(33)
where E = {Mg, SiO, H2O, H2, A(N − 1), A(N − 1)} is the set of particles, Nj is the total number of particles j, N is the total number of gas particles,  [erg] is the Gibbs free energy of formation of particle j at standard pressure, λi [erg] are the Lagrangian multipliers, and Ci are constants. The constraints from λ1 , λ2, and λ3 are keeping the ratio of Mg, SiO, H2O, and A(N − 1) per reaction constant using Mg as reference. The constraints from λ4, and λ5 ensure mass conservation. Minimising this Lagrangian for all molecules and cloud particles results in the following set of equations:
 (34)
(34)
 (35)
(35)
 (36)
(36)
 (37)
(37)
 (38)
(38)
 (39)
(39)
In PGR, the Lagrangian function is minimal and thus the derivatives are zero. Solving this set of equations, using the approximation of Eq. (23), and going from particle numbers Nj to particle number densities nj leads to:
![Mathematical equation: $\eqalign{ & {{{{\left( {n_{{\rm{Mg}}}^^\circ } \right)}^2}n_{{\rm{SiO}}}^^\circ {{\left( {n_{{{\rm{H}}_2}{\rm{O}}}^^\circ } \right)}^3}} \over {{{\left( {n_{{{\rm{H}}_2}}^^\circ } \right)}^3}}} \approx {\left( {{{{p^ \ominus }} \over {{k_{\rm{B}}}{T_{{\rm{gas}}}}}}} \right)^3}\exp \left( {{{ - 1} \over {{k_{\rm{B}}}{T_{{\rm{gas}}}}}}\left[ {2G_{{\rm{Mg}}}^ \ominus + G_{{\rm{SiO}}}^ \ominus } \right.} \right. \cr & \left. {\,\,\,\,\,\,\,\,\,\,\,\,\,\,\,\,\,\,\,\,\,\,\,\,\,\,\,\,\,\,\,\,\,\,\,\,\,\,\,\,\,\,\,\,\,\,\,\,\,\,\,\,\left. { + 3G_{{{\rm{H}}_2}{\rm{O}}}^ \ominus - 3G_{{{\rm{H}}_2}}^ \ominus - G_{{\rm{M}}{{\rm{g}}_2}{\rm{Si}}{{\rm{O}}_4}[{\rm{S}}]}^ \ominus } \right]} \right). \cr} $](/articles/aa/full_html/2024/02/aa47441-23/aa47441-23-eq57.png) (40)
(40)
This result gives us the relation between the number densities of the reactants and products of the bulk growth reaction. Hence, the reaction supersaturation for the reaction of Eq. (27) is given by:
![Mathematical equation: $\eqalign{ & S_r^2 \approx {{{{\left( {{n_{{\rm{Mg}}}}} \right)}^2}{n_{{\rm{SiO}}}}{{\left( {{n_{{{\rm{H}}_2}{\rm{O}}}}} \right)}^3}} \over {{{\left( {{n_{{{\rm{H}}_2}}}} \right)}^3}}}{\left( {{{{p^ \ominus }} \over {{k_{\rm{B}}}{T_{{\rm{gas}}}}}}} \right)^{ - 3}} \cr & \,\,\,\,\,\,\,\,\,\,\,\,\,\exp \left( {{1 \over {{k_{\rm{B}}}{T_{{\rm{gas}}}}}}\left[ {2G_{{\rm{Mg}}}^ \ominus + G_{{\rm{SiO}}}^ \ominus + 3G_{{{\rm{H}}_2}{\rm{O}}}^ \ominus - 3G_{{{\rm{H}}_2}}^ \ominus - G_{{\rm{M}}{{\rm{g}}_2}{\rm{Si}}{{\rm{O}}_4}[{\rm{S}}]}^ \ominus } \right]} \right). \cr} $](/articles/aa/full_html/2024/02/aa47441-23/aa47441-23-eq58.png) (41)
(41)
For an arbitrary Type 3 reaction that is limited by a key-gas-phase species, the reaction supersaturation is then given by
![Mathematical equation: $\eqalign{ & S_r^{{v_{{\rm{key}}}}} = {{{\Pi _{X \in F}}n_X^{{v_X}}} \over {{\Pi _{Y \in D}}n_Y^{{v_Y}}}}{\left( {{{{p^ \ominus }} \over {{k_{\rm{B}}}{T_{{\rm{gas}}}}}}} \right)^{{l_Y} - {l_X}}} \cr & \,\,\,\,\,\,\,\,\,\,\,\,\,\,\,\,\,\,\,\,\exp \left( {{1 \over {{k_{\rm{B}}}{T_{{\rm{gas }}}}}}\left[ {G_{\rm{A}}^ \ominus - \sum\limits_{X \in F} {{v_X}} G_{\rm{X}}^ \ominus + \sum\limits_{Y \in D} {{v_Y}} G_{\rm{Y}}^ \ominus } \right]} \right), \cr} $](/articles/aa/full_html/2024/02/aa47441-23/aa47441-23-eq59.png) (42)
(42)
where lX is the number of reactants and lY is the number of products. If only one reactant is considered, this result matches the result for Type 1 reactions. It also matches Type 2 reactions if only one key reactant and one key product are considered. In the case of chemical equilibrium, our description of the supersaturation ratio for Type 3 reactions is the same as the one found by Helling & Woitke (2006).
We define the right side of Eq. (40) as the reaction vapour coefficient ![Mathematical equation: $c_r^{{\mathop{\rm vap}\nolimits} }\left[ {{\rm{c}}{{\rm{m}}^{ - 3\left( {{l_x} - {l_y}} \right)}}} \right]$](/articles/aa/full_html/2024/02/aa47441-23/aa47441-23-eq60.png) and fit it with
and fit it with
![Mathematical equation: $\ln \left( {{{c_r^{{\rm{vap}}}} \over {\left[ {{\rm{c}}{{\rm{m}}^{ - 3\left( {{l_x} - {l_y}} \right)}}} \right]}}} \right) = \sum\limits_{i = 0}^3 {{{{s_i}} \over {T_{{\rm{gas}}}^i}}} .$](/articles/aa/full_html/2024/02/aa47441-23/aa47441-23-eq61.png) (43)
(43)
The fitting parameters for the surface reactions considered in this paper are given in Table E.2. This allows us to write the reaction supersaturation as
 (44)
(44)
2.6 Formation rate of CCNs
To describe nucleation kinetically, we require the properties of each considered cluster size up until the size N★, where the clusters become preferably thermally stable. For this, the Gibbs free energies GN (Eq. (8)), the interaction radii rN (Eqs. (4) and (7)), and the masses mN (Eq. (6)) of all considered cluster sizes need to be known. Unfortunately, only limited data are available (see e.g. the case of TiO2: Qu & Kroes 2006; Lundqvist et al. 2006; Zhai & Wang 2007; Chiodo et al. 2011; Lee et al. 2015; Sindel et al. 2022). We used the data of Sindel et al. (2022) and approximated the nucleation rate with the largest cluster for which all necessary data are available, which in this case is Nmax = 15. The quality of this assumption for Nmax is tested in Sect. 3.3.
We followed the approach of Patzer et al. (1998) and calculated the nucleation rate as
 (45)
(45)
which describes the rate at which CCNs are formed. The growth from clusters made from Nmax monomers to clusters with a volume of Vl depletes the gas phase of the clustering species. Because polymer nucleation is considered, all N-mers up to a given Q-mer are depleted:
 (46)
(46)
 (47)
(47)
where nN (cm−3) are N-mer number densities and 1 ≤ N ≤ Q. For TiO2, the change in the number density of clusters of size Nmax = 15 defines nucleation (see Eq. (45)). We therefore excluded this size from the depletion description and selected  .
.
Starting from Vl, the particles can grow via surface growth. Similarly, they can shrink via evaporation down to size Vl. To numerically separate evaporation and nucleation, cloud particles should only evaporate down to size Vl. For the ODE solver, we needed a continuous transition and therefore adjusted the evaporating surface area by multiplying the evaporation term of Eq. (17) with
 (48)
(48)
Including Eq. (48) in Eq. (17) results in
 (49)
(49)
For the rest of this paper, we use Eq. (49) for ;χnet in Eqs. (16) and (19).
3 Exploring kinetic chemistry and nucleation
In Sect. 3.1, we create a chemical network for the kinetic cloud formation model. Using this network, we studied the impact on the gas phase when combining different chemical kinetics networks, nucleation, and bulk growth. Describing fully time-dependent bulk growth revealed a SiO–SiO2 cycle within the surface reactions; this is discussed in Sect. 3.2. In Sect. 3.3, we evaluate the nucleation rate’s dependence on different maximum cluster sizes Nmax.
3.1 A chemical network for kinetic cloud formation
To find the impact of combining different chemical networks, nucleation, and bulk growth on the number densities of the gas-phase species, we compared the gas-phase abundances in five cases: These cases are (i) equilibrium, a time-independent calculation whereby chemical equilibrium number densities are calculated using GGchem; (ii) the NCHO thermo network reactions of VULCAN; (iii) VULCAN+, which combines the NCHO thermo network reactions of VULCAN and the Ti and Si reactions as listed in Table E.1; (iv) VULCAN+poly, which combines VULCAN+, the polymer nucleation reactions for TiO2 as described in Sect. 2.2, and the formation of TiO2 CCNs as described in Sect. 2.6; (v) Full, which combines VULCAN+poly and the bulk growth through condensation and surface reactions as described in Sect. 2.4.
All simulations start from equilibrium number densities calculated with GGchem. All time axes in this paper measure the evaluation time t [s] of the disequilibrium chemistry starting from equilibrium conditions at t = 0 s. The results for the Tgas− pgas point6 pgas = 0.002 bar at Tgas = 1378 K can be seen in Fig. 2. The chemical equilibrium number densities match the predicted number densities of VULCAN and are therefore not shown in the figure.
To compare the difference in the predicted number densities, we compared the maximum absolute difference between the logarithm of the number densities of species A between two chemical networks C1 and C2:
![Mathematical equation: $P\left( {A,{C_1},{C_2}} \right) = \max \left\{ {\left| {{{\log }_{10}}\left( {n_{{C_1}}^A(t)/n_{{C_2}}^A(t)} \right)} \right|,\forall t \in \left[ {{{10}^{ - 4}},{{10}^9}} \right]} \right\}.$](/articles/aa/full_html/2024/02/aa47441-23/aa47441-23-eq69.png) (50)
(50)
The P values for pgas = 0.002 bar and Tgas = 1378 K, representing a low-pressure level in a relatively cool atmosphere, are shown in Table 1. For the comparison, we chose H2 because it is the dominant gas-phase species, H2O and CO2 because they are commonly studied, methane (CH4) because it has distinct spectral features, Mg and SiO2 because they are condensing species, and TiO2 because it is the nucleating species.
Comparing Equilibrium to VULCAN and VULCAN to VULCAN+ shows close to no difference (P < 0.1) in the predicted number densities of H2, H2O, CO2, CH4, and SiO2 in both cases. In VULCAN+poly TiO2 nucleation reactions and the formation of TiO2 CCNs are added. Therefore, it comes as no surprise that the number density of TiO2 decreases by close to two orders of magnitude. The impact for H2, H2O, CO2, CH4, and SiO2 on the other hand is still negligible. When bulk growth is added in the full network, the number densities of TiO2, SiO2 and Mg decrease by several orders of magnitude due to their being depleted by the bulk growth processes. The impact of bulk growth can also be seen in the number densities of H2O, CO2, and CH4. The change in CH4 is discussed in Sect. 3.2. The number density of H2 on the other hand is not significantly affected.
Also shown in Fig. 2 are the gas-phase concentrations calculated using GGchem including the equilibrium condensation of the bulk grow materials. Compared to our results, GGchem equilibrium condensation results predict higher gas-phase concentrations in the cloud-forming species TiO2, SiO2, and Mg, as well as the gas-phase-only species H2O, CH4, and CO2. Because our work treats cloud formation kinetically, these differences can be caused by the nucleation or surface reactions, neither of which is considered within GGchem. In environments such as the ISM or Titan’s atmosphere, surface reactions are known to cause deviations from equilibrium gas-phase abundances (see Sect. 3.2).
Selecting a suitable gas-phase chemical kinetics network is important. We chose VULCAN because it includes commonly considered species such as H2O, CO2, and CH4 with a reasonably small number of reactions (780). Other chemical kinetics networks for exoplanet atmospheres include thousands of reactions (e.g. Venot et al. 2012, 2020; Venot & Agúndez 2015; Rimmer & Helling 2016; Hobbs et al. 2019). Because of the computational intensity of these networks, their evaluation is often limited to 1D models (e.g. Moses et al. 2005; Chadney et al. 2017; Hobbs et al. 2022; Barth et al. 2021). Adding kinetic nucleation and bulk growth to the chemical network can increase the computational time considerably. For the simulations in this section, the evaluation time doubled if nucleation and bulk growth were considered. If enough computational resources are available, our kinetic nucleation and bulk growth model can be combined with extensive chemical networks for a detailed study. Furthermore, models and observations have shown that the 3D structure of exoplanets can have an impact on the gas-phase chemistry (Baeyens et al. 2021; Prinoth et al. 2022; Lee et al. 2023). To evaluate the chemistry and cloud formation within 3D models, the cloud formation description can be combined with small but accurate networks (Tsai et al. 2022).
Most chemical kinetics networks for exoplanet atmospheres do not include many Mg-, Ti-, Si-, or Fe-bearing species. In our simulations, only the surface reactions c0, c1, c2, c4, c16, c71, c80, c85, c101, and c104 (see Table E.2) have all reactants and products within the chemical kinetics network. All other bulk growth reactions rely at least partially on gas-phase species that are only calculated in equilibrium. Ideally, all reactants and products of surface reactions should be included in the chemical kinetics network but they are not always available in literature and would drastically increase the number of reactions.
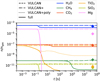 |
Fig. 2 Concentrations of selected gas-phase species for pgas = 0.002 bar at Tgas = 1378 K using different chemical kinetics networks. The diamond shaped marker shows GGchem results including equilibrium condensation. |
3.2 SiO-SiO2 cycle
In a fully kinetic description of cloud formation, minor species are affected as well. As shown in Fig. 2, adding bulk growth reactions significantly impacts the number density of CH4, even though it is not directly involved in any bulk growth processes. This is important since CH4 is discussed as a bio molecule in terrestrial atmospheres (Thompson et al. 2022; Huang et al. 2022) and is observable in hot Jupiter atmospheres (Swain et al. 2009; Barman et al. 2015; Guilluy et al. 2019).
The four bulk growth reactions causing the decrease in CH4 are c17, c19, c42, and c44. A closer look at these surface reactions revealed the following cycle:
![Mathematical equation: ${\rm{c}}42:\quad \,\,\,\,\,\,\,\,\,\,\,\,\,\,\,\,2{\rm{SiO}} \to 2{\rm{SiO}}[{\rm{s}}],$](/articles/aa/full_html/2024/02/aa47441-23/aa47441-23-eq70.png) (51)
(51)
![Mathematical equation: ${\rm{c44: }}\quad 3\,{{\rm{H}}_2} + 2\,{\rm{SiO}}\,[{\rm{s}}] \to 2\,{\rm{SiH}} + 2{{\rm{H}}_2}{\rm{O,}}$](/articles/aa/full_html/2024/02/aa47441-23/aa47441-23-eq71.png) (52)
(52)
![Mathematical equation: ${\rm{c19: }}\quad \,\,4\,{{\rm{H}}_2}{\rm{O}} + 2\,{\rm{SiH}} \to 2\,{\rm{Si}}{{\rm{O}}_2}[{\rm{s}}] + 4\,{{\rm{H}}_2} + 2{\rm{H,}}$](/articles/aa/full_html/2024/02/aa47441-23/aa47441-23-eq72.png) (53)
(53)
![Mathematical equation: ${\rm{c17: }}\quad 2\,{{\rm{H}}_2} + 2\,{\rm{Si}}{{\rm{O}}_2}[{\rm{s}}] \to 2\,{\rm{SiO}} + 2{{\rm{H}}_2}{\rm{O}}.$](/articles/aa/full_html/2024/02/aa47441-23/aa47441-23-eq73.png) (54)
(54)
The net process of this cycle is
 (55)
(55)
This additional pathway for the dissociation of H2 to H decreases the number density of CH4 through the following reactions:
 (56)
(56)
 (57)
(57)
 (58)
(58)
Most of the carbon from CH4 is transferred into H2CO with the following reaction:
 (59)
(59)
The change in carbon chemistry then also impacts other species like HCN, HCO, and C2H2.
To investigate at which pressures and temperatures the SiO-SiO2 cycle significantly impacts the CH4 abundance, P(CH4, Equilibrium, VULCAN+poly) values for a range of pressures and temperatures were calculated. The results are shown in Fig. 3. The difference in the CH4 abundance is largest for pressures lower than pgas < 10−3 bar and for temperatures around 1300 K.
The surface reactions used in this work were derived using a stoichiometric argument (Helling & Woitke 2006; Helling et al. 2008, 2017, 2019). Unfortunately, more detailed studies of surface reactions of bulk growth materials are missing from the literature. To determine if all surface reactions of the SiO-SiO2 cycle are likely to occur in exoplanet atmospheres, further investigations are needed. The fact that other processes, such as quenching or photo-chemistry, can have similar effects (Moses et al. 2011) makes it difficult to gain insights into surface reactions through observations.
Molaverdikhani et al. (2020) analysed the impact of clouds on the methane abundance. They found that clouds can increase the temperature in the photosphere, which in turn reduces the methane abundance. In contrast to our work, they used condensation curves rather than surface reactions, and therefore they did not observe a direct impact of cloud formation on the CH4 abundance.
In the (ISM), surface reactions are discussed as sources for molecular hydrogen in the gas phase (Hollenbach & Salpeter 1971; Williams 2005; Sabri et al. 2013; Dishoeck 2014; Herbst 2014, 2017). Similar to our study, in the ISM the surface of dust grains acts as a catalyst; however, in contrast to our work, they do not result in bulk material being deposited. The calculation of ISM surface reaction rates typically accounts for the vibrational frequency of the reactants and the energy barriers between different sites on the dust particle (Dishoeck 2014). Our surface reaction description could be improved by similar considerations. However, the large number of surface reactions considered and the heterogeneity of the cloud particle make such evaluations difficult.
Similarly to the ISM, the surfaces of aerosols in Titan’s atmosphere can enhance the recombination of H into H2 (Courtin et al. 1991; Bakes et al. 2003; Sekine et al. 2008). In addition, gas-phase catalytic cycles using hydrocarbons for the hydrogen recombination are postulated (Yung et al. 1984; Toublanc et al. 1995; Lebonnois et al. 2003). Both effects change the atomic hydrogen abundance, which, similarly to our work, can affect the abundance of hydrocarbons in return. In contrast to our work, the catalytic cycles considered are gas-phase-only cycles and do not result in bulk material being deposited.
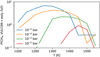 |
Fig. 3 Differences in CH4 abundance between chemical equilibrium and the VULCAN+poly network for various temperatures and pressures. |
3.3 Kinetic nucleation of TiO2
To accurately model the CCN formation in exoplanet atmosphere, the nucleation rates of the dominant nucleating species need to be known. Previous studies determined TiO2 (Goumans & Bromley 2013; Lee et al. 2015; Boulangier et al. 2019; Köhn et al. 2021) as an important nucleating species. Other species that are discussed as nucleating species are Al2O3 (Gobrecht et al. 2022), SiO (Gail & Sedlmayr 1986; Lee et al. 2015) and VO (Lecoq-Molinos et al., in prep). In addition to TiO2, we also analysed Al2O3 as a possible nucleating species for clusters up to size N = 10 (Gobrecht et al. 2022). The results were inconclusive (see Appendix C), and, therefore, for this study we decided to focus on TiO2.
If the maximum cluster size is larger than the smallest thermally stable cluster (Nmax > N★), the nucleation rate J★(Vl) is expected to be independent of the choice of the maximum cluster size. If the maximum cluster size is smaller than N★, we expect to see different nucleation rates depending on the choice of Nmax. Therefore, we test different Nmax (7 ≤ Nmax ≤ 15) and their impact on the cloud particle number density and nucleation rate. For this section, we set pgas = 0.02 bar and Tgas = 1379 K. We used the full network as described in Sect. 3.1. The cloud particle number densities and nucleation rates for different Nmax can be seen in Fig. 4. The predicted number densities for 7 ≤ Nmax ≤ 15 are all within a factor of 2. Furthermore, the peak in nucleation rate becomes smaller and appears later in time for larger clusters.
The biggest deviation in predicted cloud particle number density can be seen for Nmax = 13 and Nmax = 15, which predict lower cloud particle number densities than the rest. Looking at the Gibbs free energy per monomer unit  reveals that these sizes are the only N-mers that have a higher Gibbs free energy per monomer than their (N-1)-mers:
 (60)
(60)
 (61)
(61)
Therefore, N = 13 and N = 15 are less thermally stable than their predecessors. Previous studies have shown the same preference for even N clusters (Lasserus et al. 2019) that we find for the (TiO2)N clusters but further studies of larger sizes clusters are needed to determine if it is a size-dependent trend that can affect the nucleation process. Because our nucleation rate is determined by the largest cluster size, having Nmax = 13 or Nmax = 15 naturally results in lower cloud particle number densities. Thermodynamic data for TiO2 clusters larger than N = 15 are needed to further test this and to find the thermally stable cluster size N★ for TiO2.
Few studies have already evaluated nucleation using a non-classical approach. Lee et al. (2015) compared the nucleation rate predicted by CNT, MCNT, and non-classical nucleation for various temperatures without considering surface growth. We calculated the cloud particle number density over the same temperature range as they analysed (Fig. 5). In contrast to our work, they considered only Nmax = 10 and only monomer nucleation. Both their and our study predict significant nucleation of TiO2 for temperatures up to roughly 1300 K. Above that, the nucleation of TiO2 quickly decreases. For temperatures roughly between 600 K and 1200 K, our model predicts approximately constant cloud particle number densities, whereas the nucleation rate of Lee et al. (2015) decreases. This difference can be traced back to the polymer nucleation. Boulangier et al. (2019) showed that for TiO2 and other nucleation seeds monomer nucleation can underestimate the formation of larger clusters in colder environments.
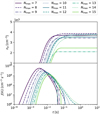 |
Fig. 4 Cloud particle number densities (top) and nucleation rates (bottom) for TiO2 nucleation with different Nmax at pgas = 0.02 bar and Tgas = 1379 K. |
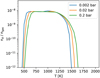 |
Fig. 5 Cloud particle concentrations for TiO2 nucleation for a range of temperatures and pressures. |
4 Time evolution of cloud formation in HD 209458 b
We simulate the chemistry and cloud formation for various Tgas − pgas points within HD 209458 b. The Tgas − pgas profiles used in this paper were calculated using expert/MITgcm simulations of HD 209458 b conducted by Schneider et al. (2022). The Tgas − pgas profiles for the sub-stellar point, anti-stellar point, evening terminator, and morning terminator can be seen in Fig. 6. The cloud particle concentrations and the mean cloud particle size as well as selected gas-phase concentrations and volume fractions7 for the sub-stellar point, evening terminator, anti-stellar point and morning terminator at pgas = 0.002 bar can be seen in Fig. 7. This pressure layer was selected as it showed the largest spread in temperatures. The results for four logarithmically spaced pressure points (pgas ∈ {0.002 bar, 0.02 bar, 0.2 bar, 2 bar}) along the evening terminator can be seen in Fig. 8. Only one Tgas − pgas profile was selected since the temperatures deeper in the atmosphere (pgas = 0.2 bar and pgas = 2 bar) are similar. The evening terminator was selected because of its intermediate temperature in the upper atmosphere at p = 0.002 bar. We used the full network as described in Sect. 3.1 for all simulations and start from chemical equilibrium calculated with GGchem.
To be able to compare gas-phase timescales to cloud formation timescales, we ran the VULCAN+ network (see Sect. 3.1) starting from solar-like atomic abundances for the Tgas−pgas points of the evening terminator. The resulting gas-phase concentrations of selected gas-phase species can be seen in Fig. 9. For all Tgas−pgas points, the concentrations of H2O, TiO2, and SiO2 quickly approach their stationary values (τchem < 1 s). Their chemical timescale is highly pressure dependent and decreases for higher pressures. CH4 and NH3 on the other hand, still show significant differences for t > 105 s for all but the highest pressure (pgas = 2 bar).
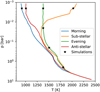 |
Fig. 6 Tgas−pgas profiles of HD 209458 b taken from Schneider et al. (2022). The Tgas−pgas points chosen for our simulations are marked with ★. |
4.1 Time evolution of cloud formation
Our results for the cloud formation within HD 208458 b start from a chemical equilibrium gas phase from which clouds are formed. These simulations can therefore give us an indication of the timescale of nucleation and bulk growth. The predicted cloud particle concentrations for most Tgas − pgas points of HD 209458 b quickly converge to stationary values (τnuc < 1 s). The only exception is the sub-stellar point at pgas = 0.002 bar where no cloud particles are predicted due to the high temperatures. Comparing the chemical timescales (see Fig. 9 or Tsai et al. 2018; Mendonça et al. 2018) to the nucleation timescale shows that nucleation happens on a similar timescale to the chemical species with a shorter chemical timescale (e.g. H2O, TiO2, SiO2). The Tgas − pgas points at pgas = 0.002 bar, other than the sub-stellar point, show only a small temperature dependence of the predicted cloud particle concentrations and nucleation timescale. This is not unexpected for temperatures ranging from 919 K to 1378 K. We have shown that TiO2 nucleation is roughly constant for this temperature range (see Sect. 3.3). Similarly, along the evening terminator we see a decrease in cloud particle concentrations consistent with the findings of Sect. 3.3. At pgas = 2 bar within the evening terminator, the cloud particle concentration reaches only nd/ngas ≈ 10−22. The lower number of cloud particles results in larger cloud particles because the bulk growth material condense onto fewer particles (Helling et al. 2023). Hence, the average cloud particle size reaches up to 0.033 cm.
The peak in bulk growth closely follows the peak in nucleation and also approaches stationary values on timescales shorter than 1 second (τbulk < 1 s). The exception to this is the evening terminator at pgas = 2 bar. The cloud particles still grow at roughly the same speed, but since much more material is available per cloud particle, it takes longer to reach stationary values for the average cloud particle size.
In all cases, the volume fractions start out TiO2 dominated. After bulk growth starts the cloud particles become considerably heterogeneous. In all cases, Mg2SiO4 becomes the dominant bulk material and hence also the dominant Mg and Si bearing species. Around 0.1−1 s, a short increase in the average cloud particle size can be seen for the morning terminator and the antistellar point at pgas = 0.002 bar. This size increase is caused by a temporary increase in SiO[s], SiO2[s], and Fe2SiO4[s] (see also Fig. F.1). Without the SiO-SiO2 cycle the temporary peak of Fe2SiO4 still occurs. This temporary increase is likely a result of feedback between cloud formation and disequilibrium chemistry. Because the cloud formation is directly coupled to the gas phase via the reaction supersaturation ratio, temporary changes in the gas-phase chemistry can be caused by cloud formation and vice versa.
For the dominant Fe bearing species we see a switch from Fe2SiO4 to Fe2O3 for t > 103 s. These are similar timescales of CH4 and NH3 (see Fig. 9 or Tsai et al. 2018; Mendonça et al. 2018). It is important to note that the change in the dominant Fe-bearing species is not related to the SiO-SiO2 cycle. It still occurs even if SiO[s] and SiO2[s] are not considered as bulk growth species. The timescale of the transition is highly pressure dependent and becomes shorter for higher pressures. Furthermore, the change in composition does not significantly affect the cloud particle size. Here, it is important to note that our cloud formation formalism does not include any solid-to-solid composition changes. All changes happen via the gas-phase through bulk growth reactions, as described in Sect. 2.5.
Helling & Woitke (2006) analysed the timescales of cloud formation with a similar cloud model to that used in this work. In contrast to our work, the gas phase is assumed to be in equilibrium (and depleted by cloud formation), MCNT is used to describe nucleation, and fewer surface reactions are used. The nucleation and bulk growth timescales they find are similar to ours (τnuc < 1 s and τbulk < 1 s). Coupling gas-phase chemistry and cloud formation does not seem to impact these timescales. However, secondary effects such as the change in the dominant Fe-bearing species and the SiO–SiO2 cycle only appear once gas-phase chemistry and cloud formation are fully coupled.
Powell et al. (2018) also analysed the timescales of cloud formation using a diffusive approach. Their rates are limited by the time it takes for the key species to diffuse to the cloud particle. They calculated their timescales as the number density of cloud particles divided by the influx of new cloud particles once a stationary solution has been reached. Consequently, their growth and nucleation timescales for TiO2 are larger than ours (τnuc > 10 s and τbulk > 10 s).
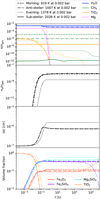 |
Fig. 7 Concentrations of selected gas-phase species (top), cloud particle number density (upper middle), mean cloud particle size (lower middle), and selected volume fractions (bottom) at the sub-stellar point, evening terminator, anti-stellar point, and morning terminator at pgas = 0.002 bar. The sub-stellar point does not form clouds. |
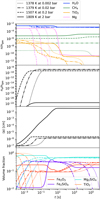 |
Fig. 8 Concentrations of selected gas-phase species (top), cloud particle number density (upper middle), mean cloud particle size (lower middle), and selected volume fractions (bottom) for logarithmically spaced pressures along the evening terminator. |
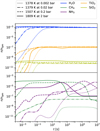 |
Fig. 9 Concentrations of selected gas-phase species along evening terminator starting from solar-like atomic abundances. |
4.2 Comparison to dynamical processes
To find whether cloud formation happens in disequilibrium or is affected by disequilibrium chemistry, we compare our results to different dynamical processes.
4.2.1 Gravitational settling
Cloud particles in exoplanet atmospheres gravitationally settle over time. Whether gravitationally settling timescales are faster than cloud formation timescales depends on many factors, such as the bulk growth speed, bulk growth material replenishment, and the frictional force of cloud particles within the atmosphere (Woitke & Helling 2003). For smaller particles (〈a〉 < 10−4 cm), growth is generally more efficient than gravitational settling (Woitke & Helling 2003; Powell et al. 2018). However, if the conditions favour larger particles and gravitational settling becomes more efficient, ‘cold traps’ can occur (Parmentier et al. 2013, 2016; Powell et al. 2018); this is where most cloud material is concentrated at the cloud base.
Comparing our cloud particle number densities and average radii to Powell et al. (2018) reveals differences that can be explained by gravitational settling and replenishment. In contrast to our work, they generally predict fewer and larger cloud particles. Settling removes cloud particles from the atmosphere thus leading to fewer particles. The replenished material then condenses onto already existing particles. Since fewer particles are present, they become larger. The exception to this is the evening terminator at pgas = 2 bar. Here, nucleation is so inefficient that we predict very large cloud particles (〈a〉 = 0.033 cm). However, these particles would quickly settle, and they are unlikely to persist in a 1D model.
4.2.2 Vertical and horizontal transport
Quenching occurs when the chemical timescale τchem [s] becomes larger than the vertical mixing timescale τdyn [s] (Moses 2014). In low-density environments, chemical timescales typically become longer (Tsai et al. 2018) and dynamical timescales typically become smaller (Parmentier et al. 2013). Therefore, quenching becomes more relevant in the upper atmosphere of exoplanets (Baeyens et al. 2021). Typical vertical mixing timescales are between 103 s < τdyn < 107 s (Agundez et al. 2014; Drummond et al. 2018; Baeyens et al. 2021). Our results show that nucleation happens on much shorter timescales than this (τnuc < 1 s) and is therefore expected to be less affected by quenching. The cloud particle composition on the other hand changes on longer timescales, which are similar to the chemical timescales of CH4 and NH3. Both CH4 and NH3 are known to be gas-phase species affected by quenching (Moses et al. 2011). Therefore, the cloud particle composition might be susceptible to quenching as well.
Similarly to the vertical timescale, one can compare the nucleation and bulk growth timescales to the horizontal mixing timescales, which consist of the latitudinal timescale and the longitudinal timescale. Mendonça et al. (2018) analysed8 WASP-43 b and found that latitudinal mixing happens on similar timescales to the vertical timescale. Longitudinal mixing, on the other hand, can be orders of magnitude shorter. This is mostly due to the strong equatorial wind jets. In their analysis, all (longitudinal, latitudinal, and vertical) mixing timescales are well above 103 s > τdyn. Therefore, similar to quenching, nucleation and the peak in bulk growth might be less affected by horizontal mixing. The cloud particle composition on the other hand might be impacted.
4.2.3 Stellar flares
If periodic effects disturb the chemical abundances, the relaxation timescale τrelax indicates how quickly the chemical abundances return back to pre-disruption values. An example for an effect that temporarily impacts chemistry are stellar flares. They periodically enhance the radiation received by a planet and cause chemical disequilibrium through photochemistry (Tilley et al. 2019; Louca et al. 2022). The chemical relaxation timescale after a stellar flare event can be of the order of hours (τrelax > 103 s; Konings et al. 2022). In the chemical relaxation scheme (Smith 1998; Cooper & Showman 2006; Kawashima & Min 2021), the relaxation timescale is given by the chemical timescale. This scheme typically also finds relaxation timescales of τrelax > 103 s for CH4 and NH3 (see Fig. 9 or Tsai et al. 2018; Mendonça et al. 2018). Nucleation and the peak in bulk growth occur on much shorter timescales than this and therefore can adjust to the temporary chemical disequilibrium. The cloud particle composition on the other hand takes longer to transition and might not adjust to the temporary chemical disequilibrium.
5 Summary
We established a fully kinetic cloud formation description combining disequilibrium chemistry, kinetic nucleation, and bulk growth through condensation and surface reactions. The kinetic gas-phase chemistry network for this study was based on the NCHO thermo-network of VULCAN. This network was expanded with Ti (and Si) reactions to connect the gas-phase chemistry with the kinetic nucleation of TiO2. We considered TiO2 polymer nucleation using cluster data up to cluster size N = 15. For the bulk material, we considered TiO2[s], Al2O3[s], SiO[s], SiO2[s], Mg2SiO4[s], FeO[s], FeS[s] Fe2O3[s], and Fe2SiO4[s]. These materials can grow through 59 bulk growth reactions.
The kinetic polymer nucleation of TiO2 indicates a similar temperature and pressure dependence to previous non-classical studies. We tested different maximum cluster sizes between Nmax = 7 and Nmax = 15 and found differences of the predicted cloud particle number density within a factor of two. For further investigations, thermodynamic data of larger TiO2 clusters is required. Overall, our results suggest that kinetic nucleation is a viable alternative to classical nucleation theory if the cluster data of the nucleating species is available. The required cluster sizes depend on the nucleating species.
The fully kinetic description of surface reactions resulted in a SiO-SiO2 catalytic cycle that dissociates H2 into 2 H. The increase in atomic hydrogen can reduce the CH4 abundance by over an order of magnitude. Whether this catalytic cycle occurs in exoplanet atmospheres remains to be seen.
We simulated the chemistry of various Tgas−pgas points within the atmosphere of HD 209458 b. For all Tgas−pgas points, except the sub-stellar point, nucleation and bulk growth occurred. In all cases where nucleation occurred, nucleation and bulk growth reached a stationary behaviour within 1 s. A comparison to the timescales of quenching and chemical relaxation showed that nucleation can happen on much shorter timescales. Hence, our work confirms that the assumption of localised nucleation is generally justified in exoplanet atmospheres. For the cloud particle composition on the other hand, we found changes on the timescale larger than 103 s. This indicates that the composition of cloud particles can be susceptible to quenching.
Acknowledgements
S.K., H.L.M., Ch.H., and L.D. acknowledge funding from the European Union H2020-MSCA-ITN-2019 under grant agreement no. 860470 (CHAMELEON). N.B. acknowledges financial support from the Austrian Academy of Sciences.
Appendix A Numerical solver
The chemical kinetic network can be described as an ordinary differential equation (ODE). Therefore, a fast and accurate ODE solver is required. Similar to other works (e.g. Agundez et al. 2014; Rimmer & Helling 2016; Molaverdikhani et al. 2019; Baeyens et al. 2021), we chose DLSODES from ODEPACK (Hindmarsh 1983; Radhakrishnan & Hindmarsh 1993).
Combining chemistry, nucleation, and bulk growth through condensation and surface reactions results in a stiff ODE system, especially during the onset of nucleation and the onset of bulk growth. To prevent the solver from getting stuck, we introduce dynamic tolerances. During the iteration, the solver tries to compute a given time step ∆t with a given relative tolerance ζrel and a given absolute tolerance ζabs. If the solver only reaches a percentage χ < 1 of the time step, ζrel and ζabs are increased by a factor of  and
and  , respectively. If the solver reaches the full time step, χ = 1, the relative and absolute tolerances are decreased by a factor of
  and
and  , respectively. To ensure sufficient precision of the ODE, the tolerances have an upper limit,
  and
and  , and a lower limit,
  and
and  , respectively. The schematics of the algorithm are shown in Fig. A.1. In this paper, the following values are used:
 A.1
A.1
 A.2
A.2
 A.3
A.3
 A.4
A.4
 A.5
A.5
 A.6
A.6
The starting tolerance is always equal to the minimum tolerance and was selected depending on the simulation.
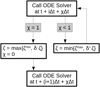 |
Fig. A.1 Dynamic tolerances scheme for the ODE solver. |
Appendix B GGchem
We considered the following species in our chemical equilibrium calculations done with GGchem: OH, H2, H2O, H, O, CH, C, CH2, CH3, CH4, C2, C2H2, C2H, C2H3, C2H4, C2H5, C2H6, CO, CO2, CH2OH, H2CO, HCO, CH3O, CH3OH, CH3CO, O2, H2CCO, HCCO, N, NH, CN, HCN, NO, NH2, N2, NH3, N2H2, N2H, N2H3, N2H4, HNO, H2CN, HNCO, NO2, N2O, C4H2, CH2NH2, CH2NH, CH3NH2, CH3CHO, HNO2, NCO, HO2, H2O2, HC3N, CH3CN, CH2CN, C2H3CN, C3H3, C3H2, C3H4, C4H3, C4H5, C6H6, C6H5, (O)1, (CH2)1, (N2)D, He, Ti, TiO, SO2, SO, TiO2, SiO+, Si+, SiH+, H−, Si, HF, SiF+, He+, SiO2, Na, Na+, SiO, HCO+, P+, P, S+, S, e−, Fe, Fe+, F, (TiO2)2, (TiO2)3, (TiO2)4, (TiO2)5, (TiO2)6, (TiO2)7, (TiO2)8, (TiO2)9, (TiO2)10, (TiO2)11, (TiO2)12, (TiO2)13, (TiO2)14, (TiO2)15, Mg, Al, Ca, Cl, FeO2, Al2O3, AlH2, AlH3, Al(OH)2, Al(OH)3, H2S2, F2, Mg2, Al2, Si2, S2, Cl2, MgH, AlH, SiH, HS, HCl, CaH, TiH, FeH, CF, SiC, CS, CCl, FN, AlN, SiN, SN, NCl, TiN, FO, MgO, AlO, ClO, CaO, FeO, MgF, AlF, SiF, SF, CaF, MgS, AlS, SiS, CaS, TiS, MgCl, AlCl, SiCl, CaCl, FeCl, AlClF, AlClF2, AlOCl, AlCl2, AlCl2F, AlCl3, AlOF, AlF2, AlF2O, AlF3, AlOH, HAlO, AlO2H, AlO2, Al2Cl6, (AlF3)2, Al2O, Al2O2, AlC, CFClO, CClF3, CClN, CClO, CCl2, CCl2F2, COCl2, CCl3, CCl3F, CCl4, CFN, CFO, CF2, CF2O, CF3, CF4, CF4O, CF8S, CHCl, CHCl3, CHF, CHFO, CHF3, CHNO, CH2Cl2, CH2CIF, CH2F2, CH3Cl, CH3F, CNO, CNN, NCN, COS, CS2, Si2C, C2Cl2, C2Cl4, C2Cl6, C2F2, C2F3N, C2F4, C2F6, C2HCl, C2HF, C2H4O, C2N, C2N2, SiC2, C2O, C3, C3O2, C4, C4N2, C5, Fe(CO)5, CaCl2, CaF2, CaOH, Ca(OH)2, Ca2, ClF, MgClF, ClFO2S, ClFO3, ClF3, ClF3Si, ClF5, ClF5S, CHClF2, CHCl2F, OHCl, SiH3Cl, NOCl, NO2Cl, TiOCl, ClO2, ClO3, SCl, ClS2, TiCl, FeCl2, SiH2Cl2, MgCl2, ClOCl, ClClO, TiOCl2, ClO2Cl, ClOClO, SO2Cl2, SCl2, SiCl2, TiCl2, SiFCl3, FeCl3, SiHCl3, SiCl3, TiCl3, Fe2Cl4, Mg2Cl4, SiCl4, TiCl4, (FeCl3)2, FeF, FHO, FHO3S, SiH3F, FNO, FNO2, FNO3, TiOF, OFO, FOO, TiF, FeF2, H2F2, SiH2F2, MgF2, F2N, F2N2(cis), F2N2(trans), F2O, F2OS, SiOF2, TiOF2, F2O2, F2O2S, SF2, FSSF, F2S2, SiF2, TiF2, FeF3, SiHF3, F3H3, NF3, NOF3, SF3, SiF3, TiF3, F4H4, Mg2F4, N2F4, SF4, SiF4, TiF4, F5H5, SF5, F6H6, SF6, F7H7, F10S2, Fe(OH)2, FeS, MgOH, HONO, HNO3, Mg(OH)2, H2SO4, H2S, SiH4, MgN, NO3, Si2N, N2O3, N2O4, N2O5, N3, S2O, O3, SO3, S3, S4, S5, S6, S7, S8, Si3, TiC, Si(CH3)4, SiCH3Cl3, SiH2, SiH3, TiC2, C3H, Si2C2, and TiC4.
Appendix C AI2O3 nucleation
To calculate the nucleation rate of potential nucleation species, thermodynamic data of their clusters need to be available. With TiO2, we are in the fortunate position of having data available up to N = 15 (Sindel et al. 2022). For Al2O3, we only have data up to N = 10 from Gobrecht et al. (2022). They also derived a detailed chemical kinetics network up to (Al2O3)4, including a small C-H-O network for the gas phase.
As in Sect. 3.3, we calculated the predicted cloud particle number densities and nucleation rate of Al2O3 using 5 ≤ Nmax ≤ 10, but the results where inconclusive and no stable nucleation behaviour was found. Neither the cloud particle number density nor the nucleation rate showed any clear trends with Nmax. A possible explanation for this non-convergence could be that the thermally stable cluster is (much) larger than Nmax = 10 or that Al2O3 does not follow homogeneous nucleation. More studies on the formation of Al2O3 clusters are required to model the kinetic nucleation of Al2O3.
Appendix D Comparing chemical networks
The cloud formation model described in this paper can be combined with any chemical kinetics network. Typically, the more extensive the network, the longer individual model runs take. In the development of this model, we first relied on a small C-H-O network taken from Gobrecht et al. (2022) (Gobrecht). Later, we used the chemical network of Tsai et al. (2017) (Vulcan). Here, we compare the two networks.
Throughout this section, we reference multiple reactions from the chemical network of Gobrecht and use the following shorthand:
(G02): H2 + H2 → H + H + H2
(G04): H2 + H → H + H + H
(G06): H2 + He → H + H + He
(G11): OH + H + H2O → H2O + H2O
(G12): H2O + H2O → OH + H + H2O
(G24): OH + H + M → H2O + M
(G25): H2O + M → OH + H + M.
D.1. Gobrecht versus Vulcan
With three exceptions, all reactions of Gobrecht can be found within Vulcan. The first exceptions are reaction G11 and G12, which do not appear in Vulcan. Reaction G12 in particular has a significant impact on the concentration of all species. The reaction rate for G12 and its corresponding forward reaction G11 were derived in supersonic combustion chemistry experiments at 2790 K < T < 3200 K and p = 250 kPa (Javoy et al. 2003). A comparison with other chemical networks for exoplanet atmospheres revealed inconsistencies. Instead of G11 and G12, Vulcan only considers the reactions G24 and G25. These are similar reactions, but they have an arbitrary third body instead of H2O. Venot et al. (2012) included reactions G11 and G12, but did not include G24 and G25. Rimmer & Helling (2016) did not consider any of the reactions G11, G12, G24, and G25. A comparison between the reaction rate coefficients of G12 and G25 can be seen in Fig. D.1.
The second difference between Gobrecht and Vulcan is the reaction G17. This reaction describes the radiative association of CO. Since we did not include any photochemical reactions in Vulcan, we also excluded this reaction for Gobrecht. Hereafter we call the collection of reactions corresponding to the network of Gobrecht without reactions G11, G12, and G17 the ‘base’ network.
The third difference is the description of H+H reactions. In Gobrecht, they are described as three-body reactions with specific collision partners H, H2, and He (G02, G04, and G06). In Vulcan, these reactions are described with a generic third body M. We used each network’s description of H+H reactions and did not adjust them.
Evaluating the base network for T = 1300 K and p = 2000 (Fig. D.2) once with reaction rates from Gobrecht and once with reaction rates from Vulcan only showed minor differences in CO2, OH, and H abundance. The differences are within expected offsets due to slightly different reaction rates and different Gibbs free-energy values. The full network of Gobrecht still produced significantly different abundances.
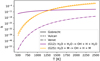 |
Fig. D.1 Comparison of reaction rate coefficients at pgas = 0.01 bar. The unit of k is [cm3 s−1] for G12 and [s−1] for G25. |
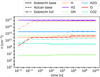 |
Fig. D.2 Comparison of chemical network of Gobrecht and Vulcan. |
D.2. Vulcan
We separated Vulcan’s 780 reactions into three categories:
base: The base Vulcan network as described in Appendix D.1.
won: The reactions of the “NCHO thermo network” of Vulcan without Nitrogen species as reactant or product.
full: The full “NCHO thermo network” of Vulcan.
Comparing the base and won network for pgas = 0.002 bar and T ∈ {500 K, 1300 K, 2000 K} shows little to no differences in H, O, OH, H2, H2O, CO, and CO2 number densities. Using the evaluation from Eq. 50 we find P(A, base, won) < 10−3 or all of these species. Furthermore, the deviations from chemical equilibrium as calculated with GGchem are minimal. Comparing the won and full network for pgas = 0.002 bar and T ∈ {500 K, 1300 K, 2000 K} showed little to no differences in H, O, OH, H2, H2O, CO, and CO2 abundance. Using the evaluation from Eq. 50 we find P(A, won, full) < 10−4 for all of these species.
Our results suggest that the VULCAN network could be used in the base or won configuration as well if a smaller network is desired. The won network in particular might prove useful since it includes the major species H2O, CO, CO2, and CH4 while having only 416 of the 780 reactions of the NCHO thermo network of Vulcan.
Appendix E Data and additional plots
The Ti and Si reactions selected from Boulangier et al. (2019) and Kiefer et al. (2023) are listed in Table E.1. Some backward reactions are derived using detailed balance with the following coefficients:
 (E.1)
(E.1)
 (E.2)
(E.2)
 (E.3)
(E.3)
 (E.4)
(E.4)
 (E.5)
(E.5)
The condensation reactions taken from Helling et al. (2019) and the fitting values for the reaction vapour coefficient (Eq. 43) are listed in Table E.2. In Fig. F.1, the volume fraction of all species from the simulations of Sect. 4 are shown.
Chemical reactions from Boulangier et al. (2019) and Kiefer et al. (2023) added to the NCHO thermo network of VULCAN.
Bulk growth reactions considered for this study. The list of reactions was taken from Helling et al. (2019). s0, s1; s2, and s3 are the fitting parameters of the vapour number density (Eq. 43). ∆V is the volume increase per bulk growth reaction.
Appendix F Additional plots
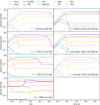 |
Fig. F.1 Volume fractions for Tgas-pgas points of HD 209458 b. The sub-stellar point (pgas = 0.002 bar, Tgas = 2026 K) is not shown since no cloud formation occurs. |
References
- Ackerman, A. S., & Marley, M. S. 2001, ApJ, 556, 872 [Google Scholar]
- Agundez, M., Parmentier, V., Venot, O., Hersant, F., & Selsis, F. 2014, A&A, 564, A73 [NASA ADS] [CrossRef] [EDP Sciences] [Google Scholar]
- Allard, F., Hauschildt, P. H., Alexander, D. R., Tamanai, A., & Schweitzer, A. 2001, ApJ, 556, 357 [Google Scholar]
- Andersson, S., Gobrecht, D., & Valero, R. 2023, Front. Astron. Space Sci., 10 [CrossRef] [Google Scholar]
- Asplund, M., Grevesse, N., Sauval, A. J., & Scott, P. 2009, ARA&A, 47, 481 [NASA ADS] [CrossRef] [Google Scholar]
- Baeyens, R., Decin, L., Carone, L., et al. 2021, MNRAS, 505, 5603 [NASA ADS] [CrossRef] [Google Scholar]
- Bakes, E. L. O., Lebonnois, S., Bauschlicher, C. W., & McKay, C. P. 2003, Icarus, 161, 468 [NASA ADS] [CrossRef] [Google Scholar]
- Barman, T. S., Konopacky, Q. M., Macintosh, B., & Marois, C. 2015, ApJ, 804, 61 [Google Scholar]
- Barth, P., Helling, Ch., Stüeken, E. E., et al. 2021, MNRAS, 502, 6201 [NASA ADS] [CrossRef] [Google Scholar]
- Baxter, C., Désert, J.-M., Tsai, S.-M., et al. 2021, A&A, 648, A127 [NASA ADS] [CrossRef] [EDP Sciences] [Google Scholar]
- Bean, J. L., Miller-Ricci Kempton, E., & Homeier, D. 2010, Nature, 468, 669 [NASA ADS] [CrossRef] [Google Scholar]
- Borsa, F., Fossati, L., Koskinen, T., Young, M. E., & Shulyak, D. 2022, Nat. Astron., 6, 226 [NASA ADS] [CrossRef] [Google Scholar]
- Boulangier, J., Gobrecht, D., Decin, L., de Koter, A., & Yates, J. 2019, MNRAS, 489, 4890 [CrossRef] [Google Scholar]
- Bromley, S. T., Martín, J. C. G., & C. Plane, J. M. 2016, PCCP, 18, 26913 [NASA ADS] [CrossRef] [Google Scholar]
- Campbell, M. L., & McClean, R. E. 1993, J. Phys. Chem., 97, 7942 [CrossRef] [Google Scholar]
- Chadney, J. M., Koskinen, T. T., Galand, M., Unruh, Y. C., & Sanz-Forcada, J. 2017, A&A, 608, A75 [NASA ADS] [CrossRef] [EDP Sciences] [Google Scholar]
- Chang, C., Patzer, A. B. C., Sedlmayr, E., & Sülzle, D. 2005, Phys. Rev. B, 72, 235402 [NASA ADS] [CrossRef] [Google Scholar]
- Chang, C., Patzer, A. B. C., Kegel, W. H., & Chandra, S. 2013, Astrophys. Space Sci., 347, 315 [NASA ADS] [CrossRef] [Google Scholar]
- Chiodo, L., Salazar, M., Romero, A. H., et al. 2011, J. Chem. Phys., 135, 244704 [NASA ADS] [CrossRef] [Google Scholar]
- Cooper, C. S., & Showman, A. P. 2006, ApJ, 649, 1048 [CrossRef] [Google Scholar]
- Courtin, R., Wagener, R., McKay, C. P., et al. 1991, Icarus, 90, 43 [NASA ADS] [CrossRef] [Google Scholar]
- Crossfield, I. J. M. 2015, PASP, 127, 941 [NASA ADS] [CrossRef] [Google Scholar]
- Crowther, P. A. 2003, Ap&SS, 285, 677 [NASA ADS] [CrossRef] [Google Scholar]
- Decin, L., Cherchneff, I., Hony, S., et al. 2008, A&A, 480, 431 [NASA ADS] [CrossRef] [EDP Sciences] [Google Scholar]
- Decin, L., Richards, A. M. S., Waters, L. B. F. M., et al. 2017, A&A, 608, A55 [NASA ADS] [CrossRef] [EDP Sciences] [Google Scholar]
- Decin, L., Danilovich, T., Gobrecht, D., et al. 2018, ApJ, 855, 113 [NASA ADS] [CrossRef] [Google Scholar]
- de Kok, R. J., Brogi, M., Snellen, I. A. G., et al. 2013, A&A, 554, A82 [NASA ADS] [CrossRef] [EDP Sciences] [Google Scholar]
- Demory, B.-O., Wit, J. d., Lewis, N., et al. 2013, ApJ, 776, L25 [CrossRef] [Google Scholar]
- Dishoeck, E. F. v. 2014, Faraday Discuss., 168, 9 [NASA ADS] [CrossRef] [Google Scholar]
- Dominik, C., Sedlmayr, E., & Gail, H.-P. 1993, A&A, 277, 578 [NASA ADS] [Google Scholar]
- Drummond, B., Mayne, N. J., Manners, J., et al. 2018, ApJ, 855, L31 [NASA ADS] [CrossRef] [Google Scholar]
- Espinoza, N., Rackham, B. V., Jordán, A., et al. 2019, MNRAS, 482, 2065 [Google Scholar]
- Ferrarotti, A. S., & Gail, H.-P. 2006, A&A, 447, 553 [CrossRef] [EDP Sciences] [Google Scholar]
- Fleischer, A. J., Winters, J. M., & Sedlmayr, E. 1999, Asymptotic Giant Branch Stars, IAU Symposium, 191, 187 [NASA ADS] [Google Scholar]
- Gail, H.-P., & Sedlmayr, E. 1986, A&A, 166, 225 [NASA ADS] [Google Scholar]
- Gail, H.-P., & Sedlmayr, E. 1988, A&A, 206, 153 [NASA ADS] [Google Scholar]
- Gail, H.-P., Keller, R., & Sedlmayr, E. 1984, A&A, 133, 320 [NASA ADS] [Google Scholar]
- Gauger, A., Gail, H. P., & Sedlmayr, E. 1990, A&A, 235, 345 [NASA ADS] [Google Scholar]
- Gobrecht, D., Cherchneff, I., Sarangi, A., Plane, J. M. C., & Bromley, S. T. 2016, A&A, 585, A6 [NASA ADS] [CrossRef] [EDP Sciences] [Google Scholar]
- Gobrecht, D., Plane, J. M. C., Bromley, S. T., et al. 2022, A&A, 658, A167 [NASA ADS] [CrossRef] [EDP Sciences] [Google Scholar]
- Goumans, T. P. M., & Bromley, S. T. 2013, Phil. Trans. R. Soc. A, 371, 20110580 [CrossRef] [Google Scholar]
- Guillot, T., Fletcher, L. N., Helled, R., et al. 2022, Protostars and Planets VII, submitted [arXiv:2205.04100] [Google Scholar]
- Guilluy, G., Sozzetti, A., Brogi, M., et al. 2019, A&A, 625, A107 [NASA ADS] [CrossRef] [EDP Sciences] [Google Scholar]
- Guilluy, G., Giacobbe, P., Carleo, I., et al. 2022, A&A, 665, A104 [NASA ADS] [CrossRef] [EDP Sciences] [Google Scholar]
- Helling, Ch., & Fomins, A. 2013, Phil. Trans. R. Soc. A, 371, 20110581 [CrossRef] [Google Scholar]
- Helling, Ch., & Rimmer, P. B. 2019, Philos. Trans. Roy. Soc. A: Math. Phys. Eng. Sci., 377, 20180398 [NASA ADS] [CrossRef] [Google Scholar]
- Helling, Ch., & Woitke, P. 2006, A&A, 455, 325 [NASA ADS] [CrossRef] [EDP Sciences] [Google Scholar]
- Helling, Ch., Oevermann, M., Lüttke, M. J. H., Klein, R., & Sedlmayr, E. 2001, A&A, 376, 194 [NASA ADS] [CrossRef] [EDP Sciences] [Google Scholar]
- Helling, Ch., Klein, R., Woitke, P., Nowak, U., & Sedlmayr, E. 2004, A&A, 423, 657 [NASA ADS] [CrossRef] [EDP Sciences] [Google Scholar]
- Helling, Ch., Woitke, P., & Thi, W.-F. 2008, A&A, 485, 547 [NASA ADS] [CrossRef] [EDP Sciences] [Google Scholar]
- Helling, Ch., Tootill, D., Woitke, P., & Lee, E. K. H. 2017, A&A, 603, A123 [NASA ADS] [CrossRef] [EDP Sciences] [Google Scholar]
- Helling, Ch., Gourbin, P., Woitke, P., & Parmentier, V. 2019, A&A, 626, A133 [NASA ADS] [CrossRef] [EDP Sciences] [Google Scholar]
- Helling, Ch., Lewis, D., Samra, D., et al. 2021, A&A, 649, A44 [NASA ADS] [CrossRef] [EDP Sciences] [Google Scholar]
- Helling, Ch., Samra, D., Lewis, D., et al. 2023, A&A, 671, A122 [NASA ADS] [CrossRef] [EDP Sciences] [Google Scholar]
- Herbst, E. 2014, Phys. Chem. Chem. Phys., 16, 3344 [NASA ADS] [CrossRef] [Google Scholar]
- Herbst, E. 2017, Int. Rev. Phys. Chem., 36, 287 [Google Scholar]
- Höfner, S. 2009, Proceedings of the ASP Conference Series, Cosmic Dust – Near and Far, eds. Th. Henning, E. Gruen, & J. Steinacker, 414, 3 [Google Scholar]
- Highberger, J. L., Savage, C., Bieging, J. H., & Ziurys, L. M. 2001, ApJ, 562, 790 [NASA ADS] [CrossRef] [Google Scholar]
- Higuchi, Y., Fukuda, Y., Fujita, Y., Yamakita, N., & Imajo, T. 2008, Chem. Phys. Lett., 452, 245 [NASA ADS] [CrossRef] [Google Scholar]
- Hindmarsh, A. C. 1983, Sci. Comput., 55 [Google Scholar]
- Hobbs, R., Shorttle, O., Madhusudhan, N., & Rimmer, P. 2019, MNRAS, 487, 2242 [NASA ADS] [CrossRef] [Google Scholar]
- Hobbs, R., Shorttle, O., & Madhusudhan, N. 2022, MNRAS, 516, 1032 [NASA ADS] [CrossRef] [Google Scholar]
- Hoeijmakers, H. J., Ehrenreich, D., Heng, K., et al. 2018a, Nature, 560, 453 [CrossRef] [Google Scholar]
- Hoeijmakers, H. J., Schwarz, H., Snellen, I. A. G., et al. 2018b, A&A, 617, A144 [NASA ADS] [CrossRef] [EDP Sciences] [Google Scholar]
- Hoeijmakers, H. J., Seidel, J. V., Pino, L., et al. 2020, A&A, 641, A123 [NASA ADS] [CrossRef] [EDP Sciences] [Google Scholar]
- Hollenbach, D., & Salpeter, E. E. 1971, ApJ, 163, 155 [NASA ADS] [CrossRef] [Google Scholar]
- Huang, J., Seager, S., Petkowski, J. J., Zhan, Z., & Ranjan, S. 2022, ApJ, 933, 6 [NASA ADS] [CrossRef] [Google Scholar]
- Javoy, S., Naudet, V., Abid, S., & Paillard, C. E. 2003, Exp. Therm. Fluid Sci., 27, 371 [CrossRef] [Google Scholar]
- Kammerer, J., Lacour, S., Stolker, T., et al. 2021, A&A, 652, A57 [NASA ADS] [CrossRef] [EDP Sciences] [Google Scholar]
- Kawashima, Y., & Min, M. 2021, A&A, 656, A90 [NASA ADS] [CrossRef] [EDP Sciences] [Google Scholar]
- Kempton, E. M.-R., Bean, J. L., & Parmentier, V. 2017, ApJ, 845, L20 [NASA ADS] [CrossRef] [Google Scholar]
- Köhn, C., Helling, Ch., Enghoff, M. B., et al. 2021, A&A, 654, A120 [NASA ADS] [CrossRef] [EDP Sciences] [Google Scholar]
- Khouri, T., Maercker, M., Waters, L. B. F. M., et al. 2016, A&A, 591, A70 [NASA ADS] [CrossRef] [EDP Sciences] [Google Scholar]
- Kiefer, S., Gobrecht, D., Decin, L., & Helling, Ch. 2023, A&A, 671, A169 [NASA ADS] [CrossRef] [EDP Sciences] [Google Scholar]
- Konings, T., Baeyens, R., & Decin, L. 2022, A&A, 667, A15 [NASA ADS] [CrossRef] [EDP Sciences] [Google Scholar]
- Kreidberg, L., Bean, J. L., Désert, J.-M., et al. 2014, Nature, 505, 69 [Google Scholar]
- Lasserus, M., Schnedlitz, M., Messner, R., et al. 2019, Chem. Sci., 10, 3473 [CrossRef] [Google Scholar]
- Lau, R. M., Hankins, M. J., Han, Y., et al. 2022, Nat. Astron., 6, 1308 [NASA ADS] [CrossRef] [Google Scholar]
- Lazzati, D. 2008, MNRAS, 384, 165 [NASA ADS] [CrossRef] [Google Scholar]
- Lebonnois, S., Bakes, E. L. O., & McKay, C. P. 2003, Icarus, 161, 474 [NASA ADS] [CrossRef] [Google Scholar]
- Lee, E. K. H., Helling, Ch., Giles, H., & Bromley, S. T. 2015, A&A, 575, A11 [NASA ADS] [CrossRef] [EDP Sciences] [Google Scholar]
- Lee, E., Casewell, S. L., Chubb, K. L., et al. 2020, MNRAS, 496, 4674 [NASA ADS] [CrossRef] [Google Scholar]
- Lee, E. K. H., Tsai, S.-M., Hammond, M., & Tan, X. 2023, A&A, 672, A110 [NASA ADS] [CrossRef] [EDP Sciences] [Google Scholar]
- Libby-Roberts, J. E., Berta-Thompson, Z. K., Diamond-Lowe, H., et al. 2022, AJ, 164, 59 [NASA ADS] [CrossRef] [Google Scholar]
- Louca, A. J., Miguel, Y., Tsai, S.-M., et al. 2022, MNRAS, stac1220 [Google Scholar]
- Lundqvist, M. J., Nilsing, M., Persson, P., & Lunell, S. 2006, Int. J. Quantum Chem., 106, 3214 [NASA ADS] [CrossRef] [Google Scholar]
- Maire, A.-L., Baudino, J.-L., Desidera, S., et al. 2020, A&A, 633, A2 [NASA ADS] [CrossRef] [EDP Sciences] [Google Scholar]
- McElroy, D., Walsh, C., Markwick, A. J., et al. 2013, A&A, 550, A36 [NASA ADS] [CrossRef] [EDP Sciences] [Google Scholar]
- Mendonça, J. M., Tsai, S.-m., Malik, M., Grimm, S. L., & Heng, K. 2018, ApJ, 869, 107 [CrossRef] [Google Scholar]
- Molaverdikhani, K., Henning, T., & Mollière, P. 2019, ApJ, 883, 194 [Google Scholar]
- Molaverdikhani, K., Henning, T., & Mollière, P. 2020, ApJ, 899, 53 [CrossRef] [Google Scholar]
- Moses, J. I. 2014, Philos. Trans. Roy. Soc. A, 372, 20130073 [NASA ADS] [CrossRef] [Google Scholar]
- Moses, J. I., Fouchet, T., Bézard, B., et al. 2005, J. Geophys. Res. Planets, 110 [Google Scholar]
- Moses, J. I., Visscher, C., Fortney, J. J., et al. 2011, ApJ, 737, 15 [Google Scholar]
- Niculescu-Duvaz, M., Barlow, M. J., Bevan, A., et al. 2022, MNRAS, 515, 4302 [NASA ADS] [CrossRef] [Google Scholar]
- Parmentier, V., Showman, A. P., & Lian, Y. 2013, A&A, 558, A91 [NASA ADS] [CrossRef] [EDP Sciences] [Google Scholar]
- Parmentier, V., Fortney, J. J., Showman, A. P., Morley, C., & Marley, M. S. 2016, ApJ, 828, 22 [Google Scholar]
- Patzer, A. B. C., Gauger, A., & Sedlmayr, E. 1998, A&A, 337, 847 [Google Scholar]
- Patzer, A. B. C., Chang, C., & Sulzle, D. 2014, Chem. Phys. Lett., 612, 39 [CrossRef] [Google Scholar]
- Peters, B. 2017, in Reaction Rate Theory and Rare Events Simulations, ed. B. Peters (Amsterdam: Elsevier), 147 [CrossRef] [Google Scholar]
- Plane, J. M. C. 2013, Philos. Trans. Royal Soc. A, 371, 20120335 [NASA ADS] [CrossRef] [Google Scholar]
- Plane, J. M. C., & Robertson, S. 2022, Faraday Discuss., 238, 461 [NASA ADS] [CrossRef] [Google Scholar]
- Powell, D., Zhang, X., Gao, P., & Parmentier, V. 2018, ApJ, 860, 18 [Google Scholar]
- Prinoth, B., Hoeijmakers, H. J., Kitzmann, D., et al. 2022, Nat. Astron., 6, 449 [NASA ADS] [CrossRef] [Google Scholar]
- Qu, Z.-w., & Kroes, G.-J. 2006, J. Phys. Chem. B, 110, 8998 [NASA ADS] [CrossRef] [Google Scholar]
- Radhakrishnan, K., & Hindmarsh, A. C. 1993, NASA Reference Publication, 19940030753 [Google Scholar]
- Rimmer, P. B., & Helling, Ch. 2013, ApJ, 774, 108 [NASA ADS] [CrossRef] [Google Scholar]
- Rimmer, P. B., & Helling, Ch. 2016, ApJS, 224, 9 [NASA ADS] [CrossRef] [Google Scholar]
- Ritter, D., & Weisshaar, J. C. 2002, ACS Publ., 93, 1576 [Google Scholar]
- Roman, M., & Rauscher, E. 2017, ApJ, 850, 17 [NASA ADS] [CrossRef] [Google Scholar]
- Roman, M. T., Kempton, E. M.-R., Rauscher, E., et al. 2021, ApJ, 908, 101 [CrossRef] [Google Scholar]
- Sabri, T., Gavilan, L., Jäger, C., et al. 2013, ApJ, 780, 180 [NASA ADS] [CrossRef] [Google Scholar]
- Sande, M. V. d., & Millar, T. J. 2019, ApJ, 873, 36 [CrossRef] [Google Scholar]
- Schneider, A. D., Carone, L., Decin, L., et al. 2022, A&A, 664, A56 [NASA ADS] [CrossRef] [EDP Sciences] [Google Scholar]
- Sekine, Y., Imanaka, H., Matsui, T., et al. 2008, Icarus, 194, 186 [NASA ADS] [CrossRef] [Google Scholar]
- Sindel, J. P., Gobrecht, D., Helling, Ch., & Decin, L. 2022, A&A, 668, A35 [NASA ADS] [CrossRef] [EDP Sciences] [Google Scholar]
- Smith, M. D. 1998, Icarus, 132, 176 [NASA ADS] [CrossRef] [Google Scholar]
- Smolders, K., Acke, B., Verhoelst, T., et al. 2010, A&A, 514, A1 [NASA ADS] [CrossRef] [EDP Sciences] [Google Scholar]
- Spyratos, P., Nikolov, N., Southworth, J., et al. 2021, MNRAS, 506, 2853 [NASA ADS] [CrossRef] [Google Scholar]
- Stock, J. W., Kitzmann, D., Patzer, A. B. C., & Sedlmayr, E. 2018, MNRAS, 479, 865 [NASA ADS] [Google Scholar]
- Swain, M. R., Tinetti, G., Vasisht, G., et al. 2009, ApJ, 704, 1616 [Google Scholar]
- Thompson, M. A., Krissansen-Totton, J., Wogan, N., Telus, M., & Fortney, J. J. 2022, Proc. Natl. Acad. Sci. U.S.A., 119, e2117933119 [NASA ADS] [CrossRef] [Google Scholar]
- Tilley, M. A., Segura, A., Meadows, V. S., Hawley, S., & Davenport, J. 2019, Astrobiology, 19, 64 [CrossRef] [Google Scholar]
- Tinyanont, S., Kasliwal, M. M., Krafton, K., et al. 2019, ApJ, 873, 127 [NASA ADS] [CrossRef] [Google Scholar]
- Toublanc, D., Parisot, J. P., Brillet, J., et al. 1995, Icarus, 113, 2 [NASA ADS] [CrossRef] [Google Scholar]
- Tsai, S.-M., Lyons, J. R., Grosheintz, L., et al. 2017, ApJS, 228, 20 [NASA ADS] [CrossRef] [Google Scholar]
- Tsai, S.-M., Kitzmann, D., Lyons, J. R., et al. 2018, ApJ, 862, 31 [NASA ADS] [CrossRef] [Google Scholar]
- Tsai, S.-M., Malik, M., Kitzmann, D., et al. 2021, ApJ, 923, 264 [NASA ADS] [CrossRef] [Google Scholar]
- Tsai, S.-M., Lee, E. K. H., & Pierrehumbert, R. 2022, A&A, 664, A82 [NASA ADS] [CrossRef] [EDP Sciences] [Google Scholar]
- Tsai, S.-M., Lee, E. K. H., Powell, D., et al. 2023, Nature, 617, 483 [CrossRef] [Google Scholar]
- Venot, O., & Agúndez, M. 2015, Exp. Astron., 40, 469 [NASA ADS] [CrossRef] [Google Scholar]
- Venot, O., Hébrard, E., Agúndez, M., et al. 2012, A&A, 546, A43 [NASA ADS] [CrossRef] [EDP Sciences] [Google Scholar]
- Venot, O., Drummond, B., Miguel, Y., et al. 2018, Exp. Astron., 46, 101 [NASA ADS] [CrossRef] [Google Scholar]
- Venot, O., Cavalié, T., Bounaceur, R., et al. 2020, A&A, 634, A78 [NASA ADS] [CrossRef] [EDP Sciences] [Google Scholar]
- Ward-Duong, K., Patience, J., Follette, K., et al. 2020, ApJ, 161, 5 [Google Scholar]
- Webber, M. W., Lewis, N. K., Marley, M., et al. 2015, ApJ, 804, 94 [NASA ADS] [CrossRef] [Google Scholar]
- Williams, D. A. 2005, J. Phys. Conf. Ser., 6, 1 [NASA ADS] [CrossRef] [Google Scholar]
- Williams, P. M., van der Hucht, K. A., & The, P. S. 1987, A&A, 182, 91 [NASA ADS] [Google Scholar]
- Woitke, P., & Helling, Ch. 2003, A&A, 399, 297 [NASA ADS] [CrossRef] [EDP Sciences] [Google Scholar]
- Woitke, P., & Helling, Ch. 2021, Astrophysics Source Code Library [record ascl:2104.010] [Google Scholar]
- Yung, Y. L., Allen, M., & Pinto, J. P. 1984, ApJS, 55, 465 [NASA ADS] [CrossRef] [Google Scholar]
- Zhai, H.-J., & Wang, L.-S. 2007, J. Am. Chem. Soc., 129, 3022 [CrossRef] [Google Scholar]
- Zhang, X., Wang, X., Sai, H., et al. 2022, MNRAS, 509, 2013 [Google Scholar]
A comparison to the chemical kinetics networks of Decin et al. (2018) and Gobrecht et al. (2022) can be found in Appendix D.
Gravitational settling and other transport processes may be added as source terms to the r.h.s. (Woitke & Helling 2003).
A(N) can be heterogeneous and contain multiple bulk growth materials. To simplify notation, we only note the number of bulk growth units N of the bulk growth material involved in a given reaction.
This Tgas − pgas point corresponds to a location within the evening terminator of HD 209458 b.
All volume fractions can be found in Fig. F.1.
WASP-43 b (Teq = 1400 K) is a hot Jupiter with a slightly colder equilibrium temperature than HD 209458 b (Teq = 1500 K) (Helling et al. 2021).
All Tables
Chemical reactions from Boulangier et al. (2019) and Kiefer et al. (2023) added to the NCHO thermo network of VULCAN.
Bulk growth reactions considered for this study. The list of reactions was taken from Helling et al. (2019). s0, s1; s2, and s3 are the fitting parameters of the vapour number density (Eq. 43). ∆V is the volume increase per bulk growth reaction.
All Figures
|
Fig. 1 Reaction rate coefficients for formation of TiO2 clusters up to (TiO2)4. All solid lines assume pgas = 0.002 bar. Top: association reactions. Bottom: dissociation reactions. |
| In the text | |
|
Fig. 2 Concentrations of selected gas-phase species for pgas = 0.002 bar at Tgas = 1378 K using different chemical kinetics networks. The diamond shaped marker shows GGchem results including equilibrium condensation. |
| In the text | |
|
Fig. 3 Differences in CH4 abundance between chemical equilibrium and the VULCAN+poly network for various temperatures and pressures. |
| In the text | |
|
Fig. 4 Cloud particle number densities (top) and nucleation rates (bottom) for TiO2 nucleation with different Nmax at pgas = 0.02 bar and Tgas = 1379 K. |
| In the text | |
|
Fig. 5 Cloud particle concentrations for TiO2 nucleation for a range of temperatures and pressures. |
| In the text | |
|
Fig. 6 Tgas−pgas profiles of HD 209458 b taken from Schneider et al. (2022). The Tgas−pgas points chosen for our simulations are marked with ★. |
| In the text | |
|
Fig. 7 Concentrations of selected gas-phase species (top), cloud particle number density (upper middle), mean cloud particle size (lower middle), and selected volume fractions (bottom) at the sub-stellar point, evening terminator, anti-stellar point, and morning terminator at pgas = 0.002 bar. The sub-stellar point does not form clouds. |
| In the text | |
|
Fig. 8 Concentrations of selected gas-phase species (top), cloud particle number density (upper middle), mean cloud particle size (lower middle), and selected volume fractions (bottom) for logarithmically spaced pressures along the evening terminator. |
| In the text | |
|
Fig. 9 Concentrations of selected gas-phase species along evening terminator starting from solar-like atomic abundances. |
| In the text | |
|
Fig. A.1 Dynamic tolerances scheme for the ODE solver. |
| In the text | |
|
Fig. D.1 Comparison of reaction rate coefficients at pgas = 0.01 bar. The unit of k is [cm3 s−1] for G12 and [s−1] for G25. |
| In the text | |
|
Fig. D.2 Comparison of chemical network of Gobrecht and Vulcan. |
| In the text | |
|
Fig. F.1 Volume fractions for Tgas-pgas points of HD 209458 b. The sub-stellar point (pgas = 0.002 bar, Tgas = 2026 K) is not shown since no cloud formation occurs. |
| In the text | |
Current usage metrics show cumulative count of Article Views (full-text article views including HTML views, PDF and ePub downloads, according to the available data) and Abstracts Views on Vision4Press platform.
Data correspond to usage on the plateform after 2015. The current usage metrics is available 48-96 hours after online publication and is updated daily on week days.
Initial download of the metrics may take a while.