| Issue |
A&A
Volume 688, August 2024
|
|
|---|---|---|
| Article Number | A201 | |
| Number of page(s) | 16 | |
| Section | Interstellar and circumstellar matter | |
| DOI | https://doi.org/10.1051/0004-6361/202451011 | |
| Published online | 23 August 2024 | |
Investigation of the rotational spectrum of CH3 17OH and its tentative detection toward Sagittarius B2(N)*
1
Astrophysik/I. Physikalisches Institut, Universität zu Köln,
Zülpicher Str. 77,
50937
Köln,
Germany
e-mail: hspm@ph1.uni-koeln.de
2
Institute of Radio Astronomy of NASU,
Mystetstv 4,
61002
Kharkiv,
Ukraine
e-mail: ilyushin@rian.kharkov.ua
3
Max-Planck-Institut für Radioastronomie,
Auf dem Hügel 69,
53121
Bonn,
Germany
Received:
6
June
2024
Accepted:
28
June
2024
Context. Methanol is an abundant and widespread molecule in the interstellar medium. The column density of its 18O isotopolog, CH318OH, is in some star-forming regions so high that the search for CH317OH is promising. But only very few transition frequencies of CH317 OH with a microwave accuracy have been published prior to our investigation.
Aims. We want to extend the very limited rotational line list of CH317OH to be able to search for this isotopolog in the interstellar medium.
Methods. We recorded the rotational spectrum of CH317OH between 38 and 1095 GHz employing a methanol sample enriched in 17O to 20%. A torsion-rotation Hamiltonian model based on the rho-axis method was employed to fit the data, as in our previous studies. We searched for rotational transitions of CH317OH in the imaging spectral line survey ReMoCA obtained with the Atacama Large Millimeter/submillimeter Array (ALMA) toward the high-mass star-forming region Sgr B2(N). The observed spectra were modeled under the assumption of local thermodynamic equilibrium (LTE).
Results. The assignments cover 0 ≤ J ≤ 45, Ka ≤ 16, and mainly the vt = 0 and 1 torsional states. The Hamiltonian model describes our data well. The model was applied to derive a line list for radio-astronomical observations. We report a tentative detection of CH317OH along with secure detections of the more abundant isotopologs of methanol toward Sgr B2(N2b). The derived column densities yield isotopic ratios 12C/13C = 25, 16O/18O = 240, and 18O/17O = 3.3, which are consistent with values found earlier for other molecules in Sgr B2.
Conclusions. The agreement between the 18O/17O isotopic ratio that we obtained for methanol and the 18O/17O ratios reported in the past for other molecules in Sgr B2(N) strongly supports our tentative interstellar identification of CH317OH. The accuracy of the derived line list is sufficient for further radio astronomical searches for this methanol isotopolog toward other star-forming regions.
Key words: astrochemistry / molecular data / methods: laboratory: molecular / techniques: spectroscopic / ISM: molecules / radio lines: ISM
Electronic supplementary material for this work can be found at https://doi.org/10.5281/zenodo.12581728
© The Authors 2024
 Open Access article, published by EDP Sciences, under the terms of the Creative Commons Attribution License (https://creativecommons.org/licenses/by/4.0), which permits unrestricted use, distribution, and reproduction in any medium, provided the original work is properly cited.
This article is published in open access under the Subscribe to Open model. Subscribe to A&A to support open access publication.
1 Introduction
As one of the most abundant molecules in space, interstellar methanol was detected in the early days of radio astronomy (Ball et al. 1970). It has been found in various astronomical objects, and several of its minor isotopic species have been detected as well, see for example the CH3OH documentation on the Molecules in Space page1 of the Cologne Database for Molecular Spectroscopy (CDMS, Müller et al. 2001, 2005; Endres et al. 2016). The 16O/18O ratio is 500 on Earth (Meija et al. 2016), ~560 in the local interstellar medium (ISM), and ~250 in the Galactic center (Wilson & Rood 1994). Nevertheless, the high methanol abundances in star-forming regions led to a detection of CH318OH toward the Galactic molecular cloud Sagittarius (Sgr) B2 fairly early on (Gardner et al. 1989) with a reported 16O/18O ratio of −210. In fact, lines of CH318OH were employed in a line survey with the Atacama Large Millimeter/submillimeter Array (ALMA) to infer the abundance of CH3OH toward the low-mass protostar IRAS 16293–2422 because of the large opacity of CH3OH and 13CH3OH lines (Jørgensen et al. 2016). Some of us carried out a study of alkanols and alkanethiols (Müller et al. 2016) toward Sgr B2(N2). The emission lines of CH318OH were sufficiently strong that the identification of CH317OH lines looked promising. After all, the 18O/17O ratio on Earth is as low as 5.5 (Meija et al. 2016), ~4.1 in the solar neighborhood (Wouterloot et al. 2005), and only ~3.0 in the Galactic center (Zhang et al. 2020). But it was not possible to draw any conclusion because the CH317 OH rest frequencies were very uncertain as a result of a very limited amount of available laboratory data with microwave accuracy. To the best of our knowledge, there is only one such publication with a very limited set of rotational transition frequencies of CH317OH by Hoshino et al. (1991). Somewhat later, Moruzzi et al. (2010) carried out an investigation of the rotational and torsion-rotation spectrum of CH317OH in the far-infrared region, which was extended shortly thereafter into the mid-infrared region, where higher torsional bands and the CO-stretching band were investigated (Moruzzi et al. 2011). The assigned transition frequencies of both studies were provided as supplementary material to the later publication.
We have initiated a program to investigate the torsional manifold of several isotopic species of methanol with one aim to create line lists with reliable frequencies and line strengths for astronomical observations and with the additional aim to analyze the intricate vibration-torsion-rotation interactions in their spectra. Our study on CD3OH led to the detection of torsionally excited CD3OH toward IRAS 16293–2422B (Ilyushin et al. 2022). The following work on CD3OD permitted the identification of some lines of this isotopolog in the same source, suggesting it may be observed unambiguously eventually (Ilyushin et al. 2023). Our subsequent investigation of CH3OD was, for example, instrumental for establishing the excitation conditions of the isotopolog toward IRAS 16293–2422B through emission lines involving higher energy levels because the low-energy transitions in vt = 0 were in part affected by opacity (Ilyushin et al. 2024). The present work deals with a thorough study of the rotational spectrum of CH317OH. We carried out extensive measurements in the lower millimeter region well into the submillimeter region to achieve a good coverage of experimental transition frequencies up to almost 1.1 THz. The new data were combined with previous microwave measurements (Hoshino et al. 1991) and in particular with published far-infrared measurements (Moruzzi et al. 2011). We employed the resulting spectroscopic parameters to generate a line list in the ground and first excited torsional states of CH317OH.
Given the high column densities of the hot molecular cores that are embedded in the high-mass star-forming region Sgr B2(N), it seemed natural to use our newly determined line list of CH317OH to search for this isotopolog in the most sensitive spectral line survey that was carried out toward this region with ALMA so far, which is called Reexploring Molecular Complexity with ALMA (ReMoCA, Belloche et al. 2019).
The rest of the paper is organized as follows. Section 2 provides details on our laboratory measurements. The theoretical model, spectroscopic analysis, and fitting results are presented in Sects. 3 and 4. Section 5 describes our astronomical observations and the results of our search for CH317OH, while Sec. 6 gives the conclusions of our investigation.
2 Experimental details
All measurements were carried out at the Universität zu Köln at room temperature employing a sample of methanol from Sigma-Aldrich Chemie GmbH that was enriched in 17O to 20%; the remaining oxygen was mostly 16O, 18O was only marginally enriched. Three different spectrometers were used which all were equipped with 100 mm inner diameter Pyrex glass cells of various lengths. The sample pressure was usually 1.5 Pa initially. The cells were pumped off and refilled after ~8 h to ~60 h because of pressure rise due to minute leaks. Lower pressures of ~0.5 Pa were employed for remeasurements of selected individual lines showing 17O hyperfine splitting, while some weaker lines were recorded with a higher pressure of ~5 Pa. Frequency multipliers usually from VDI and driven by Rohde & Schwarz SMF 100A or Keysight E8257D synthesizers were utilized as sources above 70 GHz. An Agilent Technologies synthesizer E8257D was used for measurements of individual transitions between 38 and 69 GHz.
Two connected 7 m long absorption cells with Teflon windows were employed for the lowest frequency measurements in the 38–69 GHz region and those covering 70–130 GHz and 123–180 GHz. The frequency multiplier for this last frequency region was from RPG. The spectrometer system is similar to the one described by Ordu et al. (2012). One 5 m long double-path cell equipped with Teflon windows was utilized for investigations in the regions 174–260 GHz, 260–362 GHz, and 370–510 GHz. Diode detectors were employed for the measurements described thus far. This second spectrometer system is identical to the one applied by Martin-Drumel et al. (2015). A study of the rotational spectrum of 2-cyanobutane (Müller et al. 2017) made also use of these two spectrometers and demonstrated that a frequency accuracy of 5 kHz can be achieved for a molecule with a much denser spectrum.
One 5 m long single path cell equipped with high-density polyethylene windows was employed for measurements at 360–504 GHz, 490–750 GHz, and 753–1095 GHz. The frequency multipliers were again from VDI, and a closed cycle liquid Hecooled InSb bolometer (QMC Instruments Ltd) was used as detector with this spectrometer system which is very similar to the one described by Xu et al. (2012). We were able to achieve uncertainties of 10 kHz and even better with this spectrometer system for very symmetric lines with high signal-to-noise ratios (S/N) as demonstrated in recent studies on excited vibrational lines of CH3CN (Müller et al. 2021) or on isotopic oxirane (Müller et al. 2022, 2023). Uncertainties of 5 kHz, 10 kHz, 20 kHz, 30 kHz, 50 kHz, 100 kHz, and 200 kHz were assigned in the present study, depending on the symmetry of the line shape, the S/N, and on the frequency range. Frequency modulation was used with all spectrometer systems, and the demodulation at 2f causes an isolated line to appear close to a second derivative of a Gaussian.
3 Spectroscopic properties of CH317OH and our theoretical approach
The methanol isotopolog CH317OH is a nearly prolate top with κ = (2B − A − C)/(A − C) being −0.9827. It displays a rather high coupling between internal and overall rotations in the molecule (ρ ≈ 0.809) and a torsional potential barrier V3 of about 374 cm−1. The reduced barrier s = 4V3/9F is ~6.04, where F is the rotation constant of the internal rotor, putting its torsion problem to an intermediate barrier category (Lin & Swalen 1959). Substitution of 16O by 18O in methanol changes the spectroscopic parameters only slightly, see, for example, Xu et al. (2008) and Fisher et al. (2007), respectively. Moruzzi et al. (2011) showed that the spectroscopic parameters of CH317OH are quite close to the average of CH316OH and CH318OH, and a small and simple correction improves the estimates of the CH317OH spectroscopic parameters.
The coupling between the hindered rotation of the methyl group and the overall rotational motion adds an oscillatory component to the energies of the K levels, and this oscillatory component increases strongly upon torsional excitation, see for example Fig. 4 of Fisher et al. (2007). This phenomenon is in part responsible for near-degeneracies of K levels between torsional states already at low values of vt that nourishes propagation of intervibrational interactions with non-torsional vibrations down to the lowest torsional states.
The dipole moment components of CH317OH have, to the best of our knowledge, not been determined experimentally. However, accurate values of μa and μb were determined for CH316OH in the ground vibrational as well as torsionally excited states up to vt = 3 by Mukhopadhyay & Sastry (2015). The ground state values are μa = 0.8961 (2) D and μb = 1.4201 (9) D with an increase of almost 1% upon excitation per torsional quantum. The ground state dipole moment components in the ground vibrational state of CH318OH are marginally different from those of CH316OH, namely μa = 0.8992 (8) D and μb = 1.4226 (9) D (Sastry et al. 1996). With the dipole moment components of CH317OH most likely close to the average values of the two isotopologs, its rotational spectrum exhibits both fairly strong a- and b-type transitions. The dipole moment function of Mekhtiev et al. (1999) was employed in our calculations, where the values for the permanent dipole moment components of CH316OH were replaced by averages of the CH316OH and CH318OH dipole moment components, namely μa = 0.89765 D and μb = 1.42135 D. The permanent dipole moment components were rotated from the principal axis system to the rho axis system of our Hamiltonian model.
The nuclear spin I = 5/2 of 17O leads to hyperfine structure (HFS) splitting in the rotational spectrum of CH317OH predominantly caused by its nuclear quadrupole moment. The rotational angular momentum J is coupled with the spin angular momentum I to yield the total angular momentum F. The rotational selection rule ΔJ = 0, ±1 is supplemented with the selection rule ΔF = 0, ±1. The J = 1 ← 0 transitions are split into three components, with the ΔF = 0 component somewhat separated from the ΔF = ±1 components, as is shown in Fig. 1 for the ground state a-type transitions of A and E symmetry, respectively. Energy levels with J ≥ I (here J ≥ 3) are split into 2I + 1 (six in our case) HFS levels with the strong HFS components being those with ΔF = ΔJ selection rules, which give rise to six strong components, as shown in Fig. 2. Components with ΔF ≠ ΔJ are also allowed, but decrease rapidly with J in intensity and thus are observable best for low values of J. Some of these weaker components are separated well enough from the stronger components in Fig. 2, such that they can be identified quite easily. It can also be seen in Fig. 2, that the F = J ± 2.5 components occur fairly close in frequency and somewhat separated from the other two pairs with F = J ± 1.5 and F = J ± 0.5. This general appearance is quite typical for the HFS patterns of CH317OH. The two components of each pair coalesce with decreasing splitting upon increase in J, thus, the HFS pattern collapse to three components. Upon further decrease of the splitting the components with F = J ± 1.5 and F = J ± 0.5 blend, which leads to a simplified pattern with roughly 1 : 2 intensity. Eventually, all six strong HFS components coalesce into one single line.
As in earlier investigations, we apply the rho-axis-method (RAM), which is named because of the choice of its axis system (Hougen et al. 1994). In the rho-axis-method, the z axis is coincident with the ρ vector, which expresses the coupling between the angular momentum of the internal rotation pα and that of the global rotation J. It is based on the work of Kirtman (1962), Lees & Baker (1968), and Herbst et al. (1984) and has proven to be a very effective approach in treating torsional large amplitude motions in methanol-like molecules. The RAM36 code (Ilyushin et al. 2010, 2013) was applied successfully for a number of near prolate tops with rather high ρ and J values, see for example Smirnov et al. (2014), Zakharenko et al. (2019) and, in particular, for the CD3OH isotopolog of methanol (Ilyushin et al. 2022) and for fluoral, CF3CHO, (Bermudez et al. 2022), which have ρ values ~0.89 and ~0.92, respectively. In order to treat the HFS of CH317OH, we resorted to the RAM36hf modification of the RAM36 code that was developed previously to analyze the rotational spectrum of N-methylformamide (Belloche et al. 2017) and was applied successfully to the analysis of methylarsine (Motiyenko et al. 2020). The RAM36 and RAM36hf codes use the two-step diagonalization procedure of Herbst et al. (1984); in the present work, we kept 31 torsional basis functions at the first diagonalization step and 11 torsional basis functions at the second diagonalization step.
The energy levels are labeled in our fits and calculations by the free rotor quantum number m, the overall rotational angular momentum quantum number J, and a signed value of Ka, which is the axial a-component of the overall rotational angular momentum J. In the case of the A symmetry species, the +/− sign of Ka corresponds to the so-called “parity” designation, which is related to the A1/A2 symmetry species in the group G6 (Hougen et al. 1994). The signed value for the E symmetry species reflects the fact that the Coriolis-type interaction between the internal rotation and the global rotation causes |Ka| > 0 levels to split into a Ka > 0 level and a Ka < 0 level. We also provide Kc values for convenience, but they are simply recalculated from the J and Ka values, Kc = J − |Ka| for Ka ≥ 0 and Kc = J − |Ka| + 1 for Ka < 0. The m values 0, −3, and 3 correspond to A symmetry levels of the vt = 0, 1, and 2 torsional states, respectively, while m = 1, −2, and 4 correspond to the respective E symmetry levels. The total angular momentum quantum number F = J + I, J + I − 1, ..., | J − I| designates the HFS components. When the HFS components are not resolved, a hypothetical hyperfine free torsion-rotation transition is used in our fits, which is designated by F = −1.0.
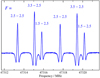 |
Fig. 1 Section of the rotational spectrum of CH317OH displaying the |
![$\[J_{K_a, K_c}=1_{0,1} \leftarrow 0_{0,0}\]$](/articles/aa/full_html/2024/08/aa51011-24/aa51011-24-eq1.png)
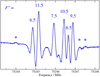 |
Fig. 2 Section of the rotational spectrum of CH317OH showing the |
![$\[v_{\mathrm{t}}=0 ~J_{K_a, K_c}=8_{2,6} \leftarrow 9_{1,8}\]$](/articles/aa/full_html/2024/08/aa51011-24/aa51011-24-eq2.png)
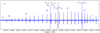 |
Fig. 3 Part of the terahertz spectrum of CH317OH showing the A symmetry vt = 0 Ka = 7 ← 6 Q-branch. Selected J values are indicated. Strong transitions of CH316OH are indicated by their quantum numbers given in black. These are from left to right two blended vt = 0 and 1 transitions of E symmetry and two vt = 0 transitions of A symmetry. Weaker transitions of CH316OH are indicated by black x, one weaker transition of CH317OH is denoted by a blue plus sign. Several of the weak or very weak lines remain unassigned at present. |
4 Spectroscopic results and discussion
Initial spectroscopic parameters of CH317OH were evaluated by averaging the CH316OH (Xu et al. 2008) and CH318OH (Fisher et al. 2007) parameters of second and fourth orders. The quadrupole coupling parameters were taken from Hoshino et al. (1991). Subsequently, quadrupole coupling, rotational, and a few centrifugal distortion parameters plus the parameters ρ, V3J, and D3ac were adjusted through fitting to the very sparse set of published transition frequencies (Hoshino et al. 1991), which were the J = 1 ← 0 and 2 ← 1 a-type transitions and the E symmetry Q-branch with K = 2 ← 1 with 2 ≤ J ≤ 23. The resulting fit was the starting point of our present investigation.
The first round of assignments started from low-J transitions and was straightforward for transitions whose HFS splitting depended mostly or only on χaa, but difficult for those strongly affected by χbb. This was hardly surprising, as Hoshino et al. (1991) stated that their assignments do not constrain χbb well. We tried to evaluate the 17O quadrupole tensor of CH317OH through a quantum chemical calculation with the program Gaussian 16 (Frisch et al. 2019) employing the B3LYP hybrid density functional (Becke 1993; Lee et al. 1988) with the aug-cc-pVTZ basis set (Dunning, Jr. 1989) of triple zeta quality. The calculated value χaa = −8.49 MHz agreed very well with −8.44 ± 0.25 MHz from the fit to the previous data (Hoshino et al. 1991). Therefore, we kept χbb fixed to the calculated value of −2.77 MHz in the second fit, which included our first round assignments. These assignments included the m = 1 00,0 ← 1−1,1 transition along with the m = 1 Ka = 1 ← 0 Q-branch transitions with 1 ≤ J ≤ 8. The calculated value of χbb turned out to be very helpful in the second round of assignments. Not only was it possible to know which transitions should display more or less well resolved HFS splitting, which transitions should have completely collapsed HFS patterns, and which ones are in between, it was also straightforward for a transition consisting of several lines to assign each absorption features to one or more HFS components in most cases. Moreover, the HFS patterns were often very useful in the assignment process.
The assignments in the second round included several transitions with fairly large HFS splitting, which usually had low or somewhat low values of J. We also assigned extensively a-type R-branch transitions without HFS splitting up to J = 14 ← 13 and Ka up to 8. Transitions involving ΔKa = ±1 frequently showed larger deviations of more than 100 MHz even for small absolute values of Ka. Nevertheless, several transitions up to J = 25 and Ka = 2 could be assigned.
The second, quite extensive round of assignments laid the foundation for extensive additional line identifications. The third round already extended identifications of a-type R-branch transitions to the upper frequency limit of 1093 GHz, corresponding to J = 23 ← 22, and included some assignments of vt = 1. Assignments of ΔKa = ±1 transitions were extended up to J = 30 and Ka = 4. Subsequent rounds of assignments enlarged the J and Ka range of vt = 0 and 1 transitions. Particularly useful in this context were ΔKa = ±1 Q-branches which frequently cover a large range of J in a small frequency region, such as the vt = 0 Ka = 7 ← 6 branch shown in Fig. 3. Care was taken to omit blended lines unless it was possible to account for the blending with transitions in the fit of CH317OH.
We experienced difficulties in our previous investigations of CD3OH (Ilyushin et al. 2022), CD3OD (Ilyushin et al. 2023), and CH3OD (Ilyushin et al. 2024) to fit data for the vt = 2 torsional state to within experimental uncertainties. We suspect these difficulties are caused by rovibrational interactions between small amplitude vibrations and higher (vt ≥ 3) torsional states in the molecule. The effects of these interactions trickle down to vt ≤ 2 through torsion-torsion interactions. Since the emphasis of our first studies on various methanol isotopologs was and still is to provide line lists for radio astronomical observations, we limited our analyses largely to vt = 0 and 1 in all instances. The same approach was adopted here for CH317OH. In order to account somewhat for vt = 2, we included transitions pertaining to the three lowest Ka values of A and E symmetry in the fit, as in our previous studies of CD3OH, CD3OD, and CH3OD, assuming that these K levels are perturbed the least by the intervibrational interactions arising from low lying small amplitude vibrations. In the case of CH317OH, these are K = −1, 2, 3 for the E species in vt = 2 and K = − 4, 0, 4 for the A species. Assignments of such vt = 2 a-type R-branch transitions were straightforward at a fairly late stage of the assignments. Subsequently, we also found several vt = 2 E symmetry transition between Ka = 2 and 3, notably a Q-branch with the origin near 715 GHz as shown in Fig. 4.
In the same round, in which we made the first assignments of the a-type R-branch transitions in vt = 2, we also noted several A symmetry transitions between vt = 0 and 1, as shown exemplarily in Fig. 5. The transitions in this figure gain intensity for some J because of the near-degeneracy of vt = 0 Ka = 9 of A symmetry with vt = 1 Ka = 5 also of A symmetry, which can be seen in Fig. 4 of Fisher et al. (2007) for the case of CH318OH. In the case of CH317OH, these Ka get particularly close for J = 24 and 25. This causes a mixing of the energy levels between these Ka for the same J around J of 24 and 25. Transitions between vt = 0 Ka = 9 and vt = 0 Ka = 8 to 10 transfer intensity to respective transitions between vt = 1 Ka = 5 and vt = 0 Ka = 8 to 10, and analogously, transitions between vt = 1 Ka = 5 and vt = 1 Ka = 4 to 6 transfer intensity to respective transitions between vt = 0 Ka = 9 and vt = 1 Ka = 4 to 6. All assigned rovibrational transitions of A symmetry determined with a microwave accuracy are caused by this vt = 0 Ka = 9 / vt = 1 Ka = 5 interaction. An interaction occurs also between vt = 0 Ka = +9 and vt = 1 Ka = +3 of E symmetry, albeit at higher J of 33 and 34. Only one rovibrational transition associated with this perturbation was strong enough to be assigned with sufficient confidence.
Besides near-degeneracies between different Ka of adjacent torsional states, there are also near-degeneracies within one torsional state, such as Ka = − 2 and 4 at J of 29 and 30 as well as Ka = −1 and 3 at J of 31 and 32 in the E species of vt = 1. But the effects of the first near-degeneracy are modest in terms of frequency and intensity alterations. The effects are more pronounced for the second near-degeneracy, as observed, for example, in the relatively weak Ka = −1 ← 2 Q-branch. The J = 31 transition is about a factor of four weaker than the J = 28 transition and shifted down by a few 100 MHz, whereas the J = 32 transition is about a factor of six stronger and shifted up by about 1 GHz with respect to the transitions with J = 29 and 33.
Despite the fact that our enriched methanol sample contains only 20% 17O, which leads to a somewhat limited range of accessible J and Ka quantum numbers, we were able to assign microwave transitions up to J = 45 and Ka = 16. At the final stage, the FIR data from Moruzzi et al. (2011) were added to the fit. Only transitions pertaining to the vt = 0, 1 torsional states and to the three lowest Ka values of A and E symmetry in vt = 2 were added to the line list. Based on our fitting results and on an inspection of the “smoothness” of spectroscopic branches, we have excluded from the fits 146 FIR lines out of 6677 line frequencies which satisfied our vt cutoff criterion. In the majority of cases, the excluded FIR transitions correspond to the last transitions in J-series of ![$\[K_a^{\prime} \leftarrow K_a^{\prime \prime}\]$](/articles/aa/full_html/2024/08/aa51011-24/aa51011-24-eq3.png) branches. Taking into account that our microwave dataset includes much higher J values than the FIR dataset (Jmax = 32), we assume that problems with those excluded “endings” in the J-series of different spectroscopic branches is an artifact of the Taylor-series expansions in powers of J(J + 1) employed in Moruzzi et al. (2011) for the spectral assignment.
branches. Taking into account that our microwave dataset includes much higher J values than the FIR dataset (Jmax = 32), we assume that problems with those excluded “endings” in the J-series of different spectroscopic branches is an artifact of the Taylor-series expansions in powers of J(J + 1) employed in Moruzzi et al. (2011) for the spectral assignment.
Our final CH317OH dataset contains 6531 FIR and 3744 microwave line frequencies. Due to blending, these 10 275 measured frequencies correspond to 12 641 transitions with Jmax = 45 and Ka ≤ 16. A Hamiltonian model consisting of 121 parameters, of which three are quadrupole coupling parameters, provided a fit with a weighted root mean square (rms) deviation of 0.85, which was selected as our “best fit” for this paper. The 121 molecular parameters from our final fit are given in Table A.1. Table 1 demonstrates that the experimental nuclear quadrupole coupling parameters and those from a quantum-chemical calculation agree well. If we put aside quadrupole coupling parameters, the numbers of the terms in the model distributed between the orders nop = 2, 4, 6, 8, 10, 12 are 7, 22, 44, 34, 10, 1, respectively. This is consistent with the limits of determinable parameters of 7, 22, 50, 95, 161, and 252 for these orders, as calculated from the differences between the total number of symmetry-allowed Hamiltonian terms of order nop and the number of symmetry-allowed contact transformation terms of order nop − 1, when applying the ordering scheme of Nakagawa et al. (1987). The final set of the parameters converged perfectly in all three senses: (i) the relative change in the weighted rms deviation of the fit at the last iteration was about ~3 × 10⁻⁷; (ii) the corrections to the parameter values generated at the last iteration are less than ~10−4 of the calculated parameter confidence intervals; (iii) the changes generated at the last iteration in the calculated frequencies are less than 1 kHz even for the FIR data. A summary of the quality of this fit is given in Table 2. In the left part of Table 2, the data are grouped by measurement uncertainty, and all data groups are fit within experimental uncertainties. We see the same good agreement in the right part of Table 2, where the data are grouped by torsional state.
The final Hamiltonian model described above was used to calculate a CH317OH line list in the ground and first excited torsional states for radio-astronomical observations. As in the cases of CD3OH (Ilyushin et al. 2022), CD3OD (Ilyushin et al. 2023), and CH3OD (Ilyushin et al. 2024), the list of CH317OH transitions includes information on transition quantum numbers, transition frequencies, calculated uncertainties, lower state energies, and transition strengths. For convenience, we provide predictions for both hypothetical hyperfine free torsionrotation transitions and torsion-rotation transitions with account of nuclear quadrupole hyperfine splittings. As already mentioned earlier, we label torsion-rotation levels by the free rotor quantum number m, the overall rotational angular momentum quantum number J, a signed value of Ka, and Kc. In the case of hyperfine structure the total angular momentum quantum number F augments the labeling. To avoid unreliable extrapolations far beyond the quantum number coverage of the available experimental dataset, we limited our predictions to vt ≤ 1, J ≤ 50, and |Ka| ≤ 17. The calculations were done from 1 GHz to 1.1 THz. Additionally, we limit our calculations to transitions for which calculated uncertainties are less than 0.1 MHz. The lower state energies are given referenced to the J = 0 A symmetry vt = 0 level. We provide additionally the torsion-rotation part of the partition function Qrt(T) of CH317OH calculated from first principles, that is, via direct summation over the torsion-rotational levels. The maximum J value is 65 for this calculation, and nvt = 11 torsional states were taken into account. Due to the way the line strengths of hyperfine components are calculated (in the RAM36hf code we calculate line strength of a hypothetical hyperfine free torsion-rotation transition which then is multiplied by a relative intensity of a particular hyperfine component, with the sum of all relative intensities of all possible hyperfine components normalized to unity) the presented torsion-rotation part of the partition function should be used as it is both for calculation with and without hyperfine structure (in other words the 2I + 1 degeneracy due to quadrupole hyperfine splitting is already taken into account by the fact that the sum of relative intensities of hyperfine components is normalized to unity). The calculations, including the torsion-rotation part of the partition function, as well as the experimental line list from the present work, can be found in the online Supplementary material with this article2 and is also be available in the Cologne Database for Molecular Spectroscopy3 (CDMS, Müller et al. 2001, 2005; Endres et al. 2016).
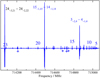 |
Fig. 4 Part of the terahertz spectrum of CH317OH showing a large portion of the E symmetry vt = 2 Ka = 3 ← 2 Q-branch. Selected J values are indicated. Two stronger A symmetry vt = 0 transitions are indicated by their quantum numbers given in blue. A strong E symmetry vt = 0 transition of CH316OH is also indicated with quantum numbers in black. Four weaker transitions of CH317OH are marked with blue plus signs. |
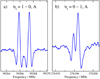 |
Fig. 5 Section of the millimeter-wave spectrum of CH317OH displaying intertorsional transitions of A symmetry. Part a) shows the |
![$\[v_{\mathrm{t}}=1 \leftarrow 0,~J_{K_a}=24_4 \leftarrow 25_9\]$](/articles/aa/full_html/2024/08/aa51011-24/aa51011-24-eq4.png)
![$\[v_{\mathrm{t}}=0 \leftarrow 1, ~J_{K_a}=26_9 \leftarrow 25_6\]$](/articles/aa/full_html/2024/08/aa51011-24/aa51011-24-eq5.png)
Experimental nuclear quadrupole coupling parameters χij (MHz) in comparison to values from a B3LYP/aug-cc-pVTZ quantum-chemical calculation (QCC).
Overview of the dataset and the fit quality.
5 Search for CH317OH toward Sgr B2(N)
We searched for interstellar CH317OH toward the high-mass star-forming protocluster Sgr B2(N) that is located in the Galactic center region at a distance of 8.2 kpc (Reid et al. 2019). We used the imaging spectral line survey Reexploring Molecular Complexity with ALMA (ReMoCA) that was performed toward Sgr B2(N) with ALMA between 84.1 and 114.4 GHz with a spectral resolution of 488 kHz (1.7–1.3 km s−1), a median angular resolution of 0.6″, and a median sensitivity of 0.8 mJy beam−1 (rms) corresponding to 0.27 K at 100 GHz. Details about the data reduction and the method of analysis of this survey can be found in Belloche et al. (2019, 2022). Here we analyzed the spectra toward the position Sgr B2(N2b) that was defined by Belloche et al. (2022) and is located in the secondary hot core Sgr B2(N2) at ![$\[(\alpha, \delta)_{\mathrm{J} 2000}=\left(17^{\mathrm{h}} 47^{\mathrm{m}} ~19^{\mathrm{s}}_.{83},-28^{\circ} 22^{\prime} 13^{\prime \prime}_. {6}\right)\]$](/articles/aa/full_html/2024/08/aa51011-24/aa51011-24-eq6.png) . This position was chosen as a compromise between getting narrow line widths to reduce the level of spectral confusion and keeping a high enough H2 column density to detect less abundant molecules.
. This position was chosen as a compromise between getting narrow line widths to reduce the level of spectral confusion and keeping a high enough H2 column density to detect less abundant molecules.
Before searching for CH317OH toward Sgr B2(N2b), we modeled the rotational emission of methanol and its 13C and 18O isotopologs under the assumption of local thermodynamic equilibrium (LTE) with the software Weeds (Maret et al. 2011). We used version 3 of the spectroscopic entry 32504 of methanol available in the CDMS (Müller et al. 2001, 2005; Endres et al. 2016). The entry is based on Xu et al. (2008); additional details are available in Belloche et al. (2022). To model the emission of the 13C and 18O isotopologs, we used version 2 of the CDMS entry 33502 and version 1 of the CDMS entry 34504, respectively. The entries were derived from Xu & Lovas (1997) and Fisher et al. (2007), respectively. Experimental transition frequencies in the range of our ALMA data are from Kuriyama et al. (1986) and from the privately communicated methanol atlas of the Toyama University by Tsunekawa et al. (1995) in the case of 13CH3OH and mainly from Hoshino et al. (1996) and Ikeda et al. (1998) in the case of CH318OH.
The results of our LTE modeling of the emission of the main isotopolog of methanol toward Sgr B2(N2b) were published in Belloche et al. (2022) and the derived LTE parameters are recalled in Table 3. We assumed the same parameters for the LTE modeling of the 13C and 18O isotopologs, keeping only their column densities as free parameters. Both isotopologs are clearly detected in their torsional ground state and their first torsionally excited state (see Figs. B.1–B.4). Figures B.5 and B.6 show their population diagrams that were constructed using transitions that are not too heavily contaminated by the contribution of other molecules. A fit to each population diagram yields a rotational temperature of 130 ± 3 K and 145 ± 7 K, respectively (see Table 4). Both values are consistent with the temperature derived for methanol toward Sgr B2(N2b) (138 ± 2 K, see Belloche et al. 2022) and with the temperature of 140 K assumed for the LTE modeling of all methanol isotopologs. The best-fit column densities derived for 13CH3OH and CH318OH are reported in Table 3. The red spectra in Figs. B.1–B.4 were computed with these column densities. The column densities listed in Table 3 yield isotopic ratios 12C/13C = 25 and 16O/18O = 240, which are consistent with the values expected for the Galactic center region (Wilson & Rood 1994).
Using the LTE parameters obtained for methanol and its 13C and 18O isotopologs, we computed synthetic spectra for CH317OH and searched for matches in the ReMoCA spectrum of Sgr B2(N2b). Our best-fit model is shown in red in Fig. 6 and the corresponding column density is given in Table 3. Two rotational lines of CH317OH are sufficiently free of contamination and bright enough to be categorized as detected. They are marked with green stars in Fig. 6. The other lines are to some extent contaminated by emission from other molecules, but some of them can still be used to construct a population diagram because we can subtract the contamination from their measured integrated intensities by using our LTE model that contains the contribution of all molecules identified so far. A fit to the population diagram shown in Fig. B.7 yields a temperature of 160 ± 60 K (Table 4), which is not well constrained but is consistent with the temperatures measured for the other methanol isotopologs.
The column density obtained for CH317OH implies isotopic ratios 16O/17O = 800 and 18O/17O = 3.3, with uncertainties on the order of 20% due to the moderate signal-to-noise ratios of the CH317OH lines. The 18O/17O isotopic ratio is consistent with values reported earlier for other molecules in Sgr B2. Wouterloot et al. (2008) obtained a 18O/17O ratio of 2.9 ± 0.1 for Sgr B2(M) from a large velocity gradient (LVG) analysis of single-dish observations of CO isotopologs in the 1–0, 2–1, and 3–2 transitions. Zhang et al. (2020) derived an average ratio of 3.15 ± 0.08 over a 10′ × 10′ single-dish map of the Sgr B2 molecular cloud in the 1–0 transition of C18O and C17O, and a value of 3.25 ± 0.42 from a deeper integration toward a position a bit less than 1′ north of Sgr B2(N). Neill et al. (2014) derived an isotopic ratio of 3.2 ± 0.4 from far-infrared observations of H218O and H217O detected in absorption in the envelope of Sgr B2(N) with the Herschel satellite. All these ratios are consistent with the value of 3.1 ± 0.6 derived four decades ago by Guelin et al. (1982) from single-dish measurements performed toward Sgr B2 in the 1–0 transition of HC18O+ and HC17O+ with an angular resolution of about 2′. The excellent agreement between the 18O/17O isotopic ratio that we derived for methanol and the ratios reported in the past for other molecules in Sgr B2 gives strong support to our tentative interstellar identification of CH317OH toward Sgr B2(N2b).
Parameters of our best-fit LTE model of methanol and its 13C,18O, and 17O isotopologs toward Sgr B2(N2b).
Rotational temperature of the 13C, 18O, and 17O isotopologs of methanol derived from their population diagrams toward Sgr B2(N2b).
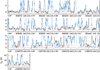 |
Fig. 6 Selection of rotational transitions of CH317OH covered by the ReMoCA survey. The LTE synthetic spectrum of CH317OH used to derive its column density toward Sgr B2(N2b) is displayed in red and overlaid on the observed spectrum shown in black. The blue synthetic spectrum contains the contributions of all molecules identified in our survey so far, including CH317OH. The values written below each panel correspond from left to right to the half-power beam width, the central frequency in MHz, the width in MHz of each panel in parentheses, and the continuum level in K of the baseline-subtracted spectra in brackets. The y-axis is labeled in brightness temperature units (K). The dotted line indicates the 3σ noise level. |
6 Conclusion
An extensive study of the torsion-rotation spectrum of CH317OH was carried out in the broad frequency range from 38 GHz to 1.1 THz. Transitions involving the vt = 0, 1, and 2 torsional states with J up to 45 and Ka up to 16 were assigned and analyzed in the current work employing a torsion-rotation RAM Hamiltonian. We achieved a fit within the experimental uncertainties with a weighted rms deviation of 0.85 for the dataset, which consists of 6531 FIR and 3744 microwave line frequencies. On the basis of the obtained Hamiltonian model, a line list in the ground and first excited torsional states of the CH317OH molecule was calculated to facilitate radio-astronomical searches of this methanol isotopolog.
We report a tentative detection of CH317OH with ALMA toward Sgr B2(N2b) along with detections of the more abundant isotopologs of methanol. The measurements yield isotopic ratios 12C/13C = 25,16O/18O = 240, and 18O/17O = 3.3. The latter value is consistent with isotopic ratios reported earlier for CO, HCO+, and H2O toward Sgr B2, which strongly supports our tentative interstellar identification of CH317OH.
Acknowledgements
We acknowledge support by the Deutsche Forschungsgemeinschaft via the collaborative research centers SFB 956 (project ID 184018867) subproject B3 and SFB 1601 (project ID 500700252) subprojects A4 and Inf as well as the Gerätezentrum SCHL 341/15-1 (“Cologne Center for Terahertz Spectroscopy”). Part of the research in Kharkiv was carried out under support of the Volkswagen foundation. The assistance of the Science and Technology Center in the Ukraine is acknowledged (STCU partner project P756). V.V.I. acknowledges financial support from Deutsche Forschungsgemeinschaft (grant number BA2176/9-1). Our research benefited from NASA’s Astrophysics Data System (ADS). This paper makes use of the following ALMA data: ADS/JAO.ALMA # 2016.1.00074.S. ALMA is a partnership of ESO (representing its member states), NSF (USA) and NINS (Japan), together with NRC (Canada), MOST and ASIAA (Taiwan), and KASI (Republic of Korea), in cooperation with the Republic of Chile. The Joint ALMA Observatory is operated by ESO, AUI/NRAO and NAOJ.
Appendix A Spectroscopic parameters of the RAM Hamiltonian for the CH317OH molecule
Fitted parameters of the RAM Hamiltonian for the CH317OH molecule
Appendix B Additional figures from the ReMoCA survey
Figures B.1–B.4 show the transitions of 13CH3OH v = 0, 13CT3OH vt = 1, CT318OH v = 0, and CT318OH vt = 1, respectively, that are covered by the ReMoCA survey and significantly contribute to the signal detected toward Sgr B2(N2b). Transitions that are too heavily blended with much stronger emission (or absorption) from other molecules and therefore cannot contribute to the identification of these isotopologs are not shown in these figures. Figures B.5–B.7 show the population diagrams obtained for 13CH3OH, CH318OH, and CH317OH, respectively.
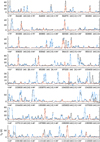 |
Fig. B.1 Selection of rotational transitions of 13CH3OH v = 0 covered by the ReMoCA survey. The LTE synthetic spectrum of 13CH3OH v = 0 is displayed in red and overlaid on the observed spectrum of Sgr B2(N2b) shown in black. The blue synthetic spectrum contains the contributions of all molecules identified in our survey so far, including the contribution of the species shown in red. The values written below each panel correspond from left to right to the half-power beam width, the central frequency in MHz, the width in MHz of each panel in parentheses, and the continuum level in K of the baseline-subtracted spectra in brackets. The y-axis is labeled in brightness temperature units (K). The dotted line indicates the 3σ noise level. |
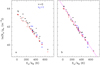 |
Fig. B.5 Population diagram of 13CH3OH toward Sgr B2(N2b). The observed data points are shown in black while the synthetic populations are shown in red. No correction is applied in panel a. In panel b, the optical depth correction has been applied to both the observed and synthetic populations and the contamination by all other species included in the full model has been subtracted from the observed data points. The purple line is a linear fit to the observed populations (in linear-logarithmic space). |
References
- Ball, J. A., Gottlieb, C. A., Lilley, A. E., & Radford, H. E. 1970, ApJ, 162, L203 [NASA ADS] [CrossRef] [Google Scholar]
- Becke, A. D. 1993, J. Chem. Phys., 98, 5648 [Google Scholar]
- Belloche, A., Müller, H. S. P., Garrod, R. T., & Menten, K. M. 2016, A&A, 587, A91 [NASA ADS] [CrossRef] [EDP Sciences] [Google Scholar]
- Belloche, A., Meshcheryakov, A. A., Garrod, R. T., et al. 2017, A&A, 601, A49 [NASA ADS] [CrossRef] [EDP Sciences] [Google Scholar]
- Belloche, A., Garrod, R. T., Müller, H. S. P., et al. 2019, A&A, 628, A10 [NASA ADS] [CrossRef] [EDP Sciences] [Google Scholar]
- Belloche, A., Garrod, R. T., Zingsheim, O., Müller, H. S. P., & Menten, K. M. 2022, A&A, 662, A110 [NASA ADS] [CrossRef] [EDP Sciences] [Google Scholar]
- Bermudez, C., Motiyenko, R. A., Cabezas, C., et al. 2022, Spectrochim. Acta A, 274, 121071 [NASA ADS] [CrossRef] [Google Scholar]
- Dunning, Jr., T. H. 1989, J. Chem. Phys., 90, 1007 [Google Scholar]
- Endres, C. P., Schlemmer, S., Schilke, P., Stutzki, J., & Müller, H. S. P. 2016, J. Mol. Spectrosc., 327, 95 [NASA ADS] [CrossRef] [Google Scholar]
- Fisher, J., Paciga, G., Xu, L.-H., et al. 2007, J. Mol. Spectrosc., 245, 7 [NASA ADS] [CrossRef] [Google Scholar]
- Frisch, M. J., Trucks, G. W., Schlegel, H. B., et al. 2019, Gaussian 16, Revision C.01 (Wallingford, CT: Gaussian, Inc.) [Google Scholar]
- Gardner, F. F., Whiteoak, J. B., Reynolds, J., Peters, W. L., & Kuiper, T. B. H. 1989, MNRAS, 240, 35P [NASA ADS] [CrossRef] [Google Scholar]
- Guelin, M., Cernicharo, J., & Linke, R. A. 1982, ApJ, 263, L89 [CrossRef] [Google Scholar]
- Herbst, E., Messer, J. K., De Lucia, F. C., & Helminger, P. 1984, J. Mol. Spectrosc., 108, 42 [NASA ADS] [CrossRef] [Google Scholar]
- Hoshino, Y., Ohishi, M., & Takagi, K. 1991, J. Mol. Spectrosc., 148, 506 [NASA ADS] [CrossRef] [Google Scholar]
- Hoshino, Y., Ohishi, M., Akabane, K., et al. 1996, ApJS, 104, 317 [NASA ADS] [CrossRef] [Google Scholar]
- Hougen, J. T., Kleiner, I., & Godefroid, M. 1994, J. Mol. Spectrosc., 163, 559 [NASA ADS] [CrossRef] [Google Scholar]
- Ikeda, M., Duan, Y.-B., Tsunekawa, S., & Takagi, K. 1998, ApJS, 117, 249 [NASA ADS] [CrossRef] [Google Scholar]
- Ilyushin, V. V., Kisiel, Z., Pszczółkowski, L., Mäder, H., & Hougen, J. T. 2010, J. Mol. Spectrosc., 259, 26 [NASA ADS] [CrossRef] [Google Scholar]
- Ilyushin, V. V., Endres, C. P., Lewen, F., Schlemmer, S., & Drouin, B. J. 2013, J. Mol. Spectrosc., 290, 31 [NASA ADS] [CrossRef] [Google Scholar]
- Ilyushin, V. V., Müller, H. S. P., Jørgensen, J. K., et al. 2022, A&A, 658, A127 [NASA ADS] [CrossRef] [EDP Sciences] [Google Scholar]
- Ilyushin, V. V., Müller, H. S. P., Jørgensen, J. K., et al. 2023, A&A, 677, A49 [NASA ADS] [CrossRef] [EDP Sciences] [Google Scholar]
- Ilyushin, V. V., Müller, H. S. P., Drozdovskaya, M. N., et al. 2024, A&A, 687, A220 [NASA ADS] [CrossRef] [EDP Sciences] [Google Scholar]
- Jørgensen, J. K., van der Wiel, M. H. D., Coutens, A., et al. 2016, A&A, 595, A117 [Google Scholar]
- Kirtman, B. 1962, J. Chem. Phys., 37, 2516 [NASA ADS] [CrossRef] [Google Scholar]
- Kuriyama, H., Takagi, K., Takeo, H., & Matsumura, C. 1986, ApJ, 311, 1073 [NASA ADS] [CrossRef] [Google Scholar]
- Lee, C., Yang, W., & Parr, R. G. 1988, Phys. Rev. B, 37, 785 [Google Scholar]
- Lees, R. M., & Baker, J. G. 1968, J. Chem. Phys., 48, 5299 [NASA ADS] [CrossRef] [Google Scholar]
- Lin, C. C., & Swalen, J. D. 1959, Rev. Mod. Phys., 31, 841 [NASA ADS] [CrossRef] [Google Scholar]
- Maret, S., Hily-Blant, P., Pety, J., Bardeau, S., & Reynier, E. 2011, A&A, 526, A47 [NASA ADS] [CrossRef] [EDP Sciences] [Google Scholar]
- Martin-Drumel, M. A., van Wijngaarden, J., Zingsheim, O., et al. 2015, J. Mol. Spectrosc., 307, 33 [NASA ADS] [CrossRef] [Google Scholar]
- Meija, J., Coplen, T. B., Berglund, M., et al. 2016, Pure Appl. Chem., 88, 293 [Google Scholar]
- Mekhtiev, M. A., Godfrey, P. D., & Hougen, J. T., 1999, J. Mol. Spectrosc., 194, 171 [NASA ADS] [CrossRef] [Google Scholar]
- Moruzzi, G., Murphy, R. J., Lees, R. M., Predoi-Cross, A., & Billinghurst, B. E., 2010, Mol. Phys., 108, 2343 [NASA ADS] [CrossRef] [Google Scholar]
- Moruzzi, G., Murphy, R. J., Vos, J., et al. 2011, J. Mol. Spectrosc., 268, 211 [NASA ADS] [CrossRef] [Google Scholar]
- Motiyenko, R. A., Ilyushin, V. V., Demaison, J., et al. 2020, J. Mol. Spectrosc., 1213, 128037 [Google Scholar]
- Mukhopadhyay, I., & Sastry, K. V. L. N., 2015, J. Mol. Spectrosc., 312, 51 [NASA ADS] [CrossRef] [Google Scholar]
- Müller, H. S. P., Thorwirth, S., Roth, D. A., & Winnewisser, G. 2001, A&A, 370, L49 [Google Scholar]
- Müller, H. S. P., Schlöder, F., Stutzki, J., & Winnewisser, G. 2005, J. Mol. Struct., 742, 215 [Google Scholar]
- Müller, H. S. P., Belloche, A., Xu, L.-H., et al. 2016, A&A, 587, A92 [NASA ADS] [CrossRef] [EDP Sciences] [Google Scholar]
- Müller, H. S. P., Zingsheim, O., Wehres, N., et al. 2017, J. Phys. Chem. A, 121, 7121 [Google Scholar]
- Müller, H. S. P., Belloche, A., Lewen, F., et al. 2021, J. Mol. Spectrosc., 378, 111449 [CrossRef] [Google Scholar]
- Müller, H. S. P., Guillemin, J.-C., Lewen, F., & Schlemmer, S. 2022, J. Mol. Spectrosc., 384, 111584 [CrossRef] [Google Scholar]
- Müller, H. S. P., Jørgensen, J. K., Guillemin, J.-C., Lewen, F., & Schlemmer, S. 2023, MNRAS, 518, 185 [Google Scholar]
- Nakagawa, K., Tsunekawa, S., & Kojima, T. 1987, J. Mol. Spectrosc., 126, 329 [NASA ADS] [CrossRef] [Google Scholar]
- Neill, J. L., Bergin, E. A., Lis, D. C., et al. 2014, ApJ, 789, 8 [Google Scholar]
- Ordu, M. H., Müller, H. S. P., Walters, A., et al. 2012, A&A, 541, A121 [NASA ADS] [CrossRef] [EDP Sciences] [Google Scholar]
- Reid, M. J., Menten, K. M., Brunthaler, A., et al. 2019, ApJ, 885, 131 [Google Scholar]
- Sastry, K. V. L. N., Mukhopadhyay, I., Gupta, P. K., & VanderLinde, J. 1996, J. Mol. Spectrosc., 176, 38 [NASA ADS] [CrossRef] [Google Scholar]
- Smirnov, I. A., Alekseev, E. A., Ilyushin, V. V., et al. 2014, J. Mol. Spectrosc., 295, 44 [NASA ADS] [CrossRef] [Google Scholar]
- Tsunekawa, S., Ukai, T., Toyama, A., & Takagi, K. 1995, Microwave frequencies of the CH3OH molecule in the frequency range 7 to 200 GHz. Unpublished report, Department of Physics, Toyama University, Toyama, Japan [Google Scholar]
- Wilson, T. L., & Rood, R. 1994, ARA&A, 32, 191 [Google Scholar]
- Wouterloot, J. G. A., Brand, J., & Henkel, C. 2005, A&A, 430, 549 [NASA ADS] [CrossRef] [EDP Sciences] [Google Scholar]
- Wouterloot, J. G. A., Henkel, C., Brand, J., & Davis, G. R. 2008, A&A, 487, 237 [NASA ADS] [CrossRef] [EDP Sciences] [Google Scholar]
- Xu, L.-H., & Lovas, F. J. 1997, J. Phys. Chem. Ref. Data, 26, 17 [Google Scholar]
- Xu, L.-H., Fisher, J., Lees, R. M., et al. 2008, J. Mol. Spectrosc., 251, 305 [NASA ADS] [CrossRef] [Google Scholar]
- Xu, L.-H., Lees, R. M., Crabbe, G. T., et al. 2012, J. Chem. Phys., 137, 104313 [NASA ADS] [CrossRef] [Google Scholar]
- Zakharenko, O., Ilyushin, V. V., Lewen, F., et al. 2019, A&A, 629, A73 [NASA ADS] [CrossRef] [EDP Sciences] [Google Scholar]
- Zhang, J. S., Liu, W., Yan, Y. T., et al. 2020, ApJS, 249, 6 [Google Scholar]
All Tables
Experimental nuclear quadrupole coupling parameters χij (MHz) in comparison to values from a B3LYP/aug-cc-pVTZ quantum-chemical calculation (QCC).
Parameters of our best-fit LTE model of methanol and its 13C,18O, and 17O isotopologs toward Sgr B2(N2b).
Rotational temperature of the 13C, 18O, and 17O isotopologs of methanol derived from their population diagrams toward Sgr B2(N2b).
All Figures
|
Fig. 1 Section of the rotational spectrum of CH317OH displaying the |
| In the text | |
|
Fig. 2 Section of the rotational spectrum of CH317OH showing the |
| In the text | |
|
Fig. 3 Part of the terahertz spectrum of CH317OH showing the A symmetry vt = 0 Ka = 7 ← 6 Q-branch. Selected J values are indicated. Strong transitions of CH316OH are indicated by their quantum numbers given in black. These are from left to right two blended vt = 0 and 1 transitions of E symmetry and two vt = 0 transitions of A symmetry. Weaker transitions of CH316OH are indicated by black x, one weaker transition of CH317OH is denoted by a blue plus sign. Several of the weak or very weak lines remain unassigned at present. |
| In the text | |
|
Fig. 4 Part of the terahertz spectrum of CH317OH showing a large portion of the E symmetry vt = 2 Ka = 3 ← 2 Q-branch. Selected J values are indicated. Two stronger A symmetry vt = 0 transitions are indicated by their quantum numbers given in blue. A strong E symmetry vt = 0 transition of CH316OH is also indicated with quantum numbers in black. Four weaker transitions of CH317OH are marked with blue plus signs. |
| In the text | |
|
Fig. 5 Section of the millimeter-wave spectrum of CH317OH displaying intertorsional transitions of A symmetry. Part a) shows the |
| In the text | |
|
Fig. 6 Selection of rotational transitions of CH317OH covered by the ReMoCA survey. The LTE synthetic spectrum of CH317OH used to derive its column density toward Sgr B2(N2b) is displayed in red and overlaid on the observed spectrum shown in black. The blue synthetic spectrum contains the contributions of all molecules identified in our survey so far, including CH317OH. The values written below each panel correspond from left to right to the half-power beam width, the central frequency in MHz, the width in MHz of each panel in parentheses, and the continuum level in K of the baseline-subtracted spectra in brackets. The y-axis is labeled in brightness temperature units (K). The dotted line indicates the 3σ noise level. |
| In the text | |
|
Fig. B.1 Selection of rotational transitions of 13CH3OH v = 0 covered by the ReMoCA survey. The LTE synthetic spectrum of 13CH3OH v = 0 is displayed in red and overlaid on the observed spectrum of Sgr B2(N2b) shown in black. The blue synthetic spectrum contains the contributions of all molecules identified in our survey so far, including the contribution of the species shown in red. The values written below each panel correspond from left to right to the half-power beam width, the central frequency in MHz, the width in MHz of each panel in parentheses, and the continuum level in K of the baseline-subtracted spectra in brackets. The y-axis is labeled in brightness temperature units (K). The dotted line indicates the 3σ noise level. |
| In the text | |
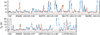 |
Fig. B.2 Same as Fig. B.1, but for 13CH3OH vt = 1. |
| In the text | |
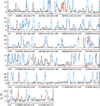 |
Fig. B.3 Same as Fig. B.1, but for CH318OH v = 0. |
| In the text | |
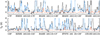 |
Fig. B.4 Same as Fig. B.1, but for CH318OH vt = 1. |
| In the text | |
|
Fig. B.5 Population diagram of 13CH3OH toward Sgr B2(N2b). The observed data points are shown in black while the synthetic populations are shown in red. No correction is applied in panel a. In panel b, the optical depth correction has been applied to both the observed and synthetic populations and the contamination by all other species included in the full model has been subtracted from the observed data points. The purple line is a linear fit to the observed populations (in linear-logarithmic space). |
| In the text | |
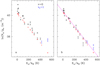 |
Fig. B.6 Same as Fig. B.5, but for CH318OH. |
| In the text | |
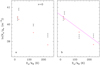 |
Fig. B.7 Same as Fig. B.5, but for CH317OH. |
| In the text | |
Current usage metrics show cumulative count of Article Views (full-text article views including HTML views, PDF and ePub downloads, according to the available data) and Abstracts Views on Vision4Press platform.
Data correspond to usage on the plateform after 2015. The current usage metrics is available 48-96 hours after online publication and is updated daily on week days.
Initial download of the metrics may take a while.