| Issue |
A&A
Volume 685, May 2024
|
|
|---|---|---|
| Article Number | A134 | |
| Number of page(s) | 14 | |
| Section | Catalogs and data | |
| DOI | https://doi.org/10.1051/0004-6361/202348323 | |
| Published online | 17 May 2024 | |
Probing the inner Galactic halo with blue horizontal-branch stars
Gaia DR3-based catalogue with atmospheric and stellar parameters★
1
Institut für Physik und Astronomie, Universität Potsdam,
Haus 28, Karl-Liebknecht-Str. 24/25,
14476
Potsdam-Golm,
Germany
e-mail: This email address is being protected from spambots. You need JavaScript enabled to view it.
2
Department of Physics, University of Warwick,
Coventry
CV4 7AL,
UK
3
Dr. Remeis-Sternwarte & ECAP, Astronomical Institute, FAU Erlangen-Nürnberg,
Sternwartstr. 7,
96049
Bamberg,
Germany
4
Astronomical Institute AS CR,
Fričova 298,
251 65
Ondřejov,
Czech Republic
Received:
19
October
2023
Accepted:
8
March
2024
Abstract
Context. Stars that are found on the blue horizontal-branch (BHB) evolved from low-mass stars that have completed their core hydrogen-burning main sequence (MS) stage and undergone the helium flash at the end of their red giant phase. Hence, they are very old objects that can be used as markers in studying galactic structure and formation history. The fact that their luminosity is virtually constant at all effective temperatures also makes them good standard candles.
Aims. We have compiled a catalogue of BHB stars with stellar parameters calculated from spectral energy distributions (SEDs) constructed using data from multiple large-scale photometric surveys. In addition, we update our previous Gaia Early Data Release 3 (EDR3) catalogue of BHB stars with parallax errors less than 20% by using the SED results to define the selection criteria. The purpose of these catalogues is to create a set of BHB star candidates with reliable stellar parameters. In addition, they provide a more complete full-sky catalogue with candidate objects found along the whole BHB from where RR-Lyrae are found on the instability strip to the extreme horizontal-branch (EHB).
Methods. We selected a large dataset of Gaia Data Release 3 (DR3) objects based only on their position on the colour-magnitude diagram (CMD), along with the tangential velocity and parallax errors. The SEDs were then used to evaluate contamination levels in the dataset and derive optimised data quality acceptance constraints. This allowed us to extend the Gaia DR3 colour and absolute magnitude criteria further towards the EHB. The level of contamination found using SED analysis was confirmed by acquiring spectra using the Ondrejov Echelle spectrograph, attached to the Perek 2m telescope at the Astronomical Institute of the Czech Academy of Sciences.
Results. We present a catalogue of 9172 Galactic halo BHB candidate stars with atmospheric and stellar parameters calculated from synthetic SEDs. We also present an extended Gaia DR3-based catalogue of 22 335 BHB candidate stars with a wider range of effective temperatures and Gaia DR3 parallax errors of less than 20%. This represents an increase of 33% compared to the our 2021 catalogue, with a contamination level of 10%.
Key words: catalogs / Hertzsprung-Russell and C–M diagrams / stars: horizontal-branch
The catalogue is available at the CDS via anonymous ftp to cdsarc.cds.unistra.fr (130.79.128.5) or via https://cdsarc.cds.unistra.fr/viz-bin/cat/J/A+A/685/A134
© The Authors 2024
 Open Access article, published by EDP Sciences, under the terms of the Creative Commons Attribution License (https://creativecommons.org/licenses/by/4.0), which permits unrestricted use, distribution, and reproduction in any medium, provided the original work is properly cited.
This article is published in open access under the Subscribe to Open model. This email address is being protected from spambots. You need JavaScript enabled to view it. to support open access publication.
1 Introduction
The term horizontal-branch (HB) was coined to describe a horizontal structure observed in the colour-magnitude diagram (CMD) in globular clusters. The horizontal-branch extends from the red clump at the red end through the instability strip where RR-Lyrae are found to the extreme horizontal-branch (EHB) at the blue end (Catelan 2009). Thus, HB stars are what remains of low-metallicity, ~0.8 M⊙ to ~2.3 M⊙, main sequence (MS) stars that have evolved past the helium flash at the end of the red giant phase. The extent of the HB varies from cluster to cluster, which has led to the distinction of red HB stars redwards of the instability strip and blue HB stars bluewards. As such, these are early-type stars are already billions of years old when they move to the BHB. A more detailed description of BHB stars, their properties and their evolution from MS stars can be found in Moehler (2001); Catelan (2009) and references therein. Observationally, the photometry of cooler, A-type, BHB stars places them in the same colour-magnitude space as MS A- and B-type stars. The cooler A-type BHB stars fall on the bluer side of the instability strip where RR-Lyrae are found (Montenegro et al. 2019). The hotter B-type BHB stars fall on the redder side of the EHB stars, also called hot subdwarf stars (Heber 2009). The spectra of BHB stars are similar to A-type subgiant or late B-type MS stars. Because BHB stars rotate slowly (Behr 2003; Xue et al. 2008), their spectral lines are usually sharper than MS A-and B-type stars.
These classifications rely on an accurate and precise determinations of colour and absolute magnitude. Gaia has enabled immense progress to be made in this field; however, even with Gaia Data Release 3 (DR3), the uncertainties in parallax, colour, apparent magnitude, and proper motions still lead to a degree of misplacement among some stars in the CMD. This can cause contamination in catalogues that are based on Gaia DR3 data alone, presenting the additional challenge of removing such contaminants. The main categories of stars that plot closest to the BHB in the CMD (as illustrated in Fig. 1) are hot subdwarfs (see e.g. Culpan et al. 2022), extremely low-mass (ELM) white dwarfs and pre-ELM dwarfs (as compiled by Pelisoli & Vos 2019), and RR-Lyrae (see Eyer et al. 2023). Further contamination is caused by blue straggler stars, normal MS stars that have been rejuvenated through the accretion of additional hydrogen (McCrea 1964; Shara et al. 1997; Chen & Han 2009; Ekanayake & Wilhelm 2018). They follow the part of the MS that is brighter and bluer than the MS turnoff of the Galactic halo, namely, where normal MS A-type and B-type stars would no longer be present in older stellar populations. The brightest blue stragglers can be up to three magnitudes brighter than the MS turnoff (Rain et al. 2021).
Blue stragglers, because of their somewhat higher gravities, can be distinguished from A-type BHB stars spectroscopically (Xue et al. 2008, and references therein), while this is difficult for B-type stars because of their similar gravities (Hunger & Heber 1987; Raddi et al. 2021). Main-sequence stars of spectral types A and B (see e.g. Silva & Napiwotzki 2011; Raddi et al. 2021; Liu et al. 2023) are also found in this region of the CMD, but are not expected in the Galactic halo because their expected MS lifetime is shorter than the age of this region. However, low numbers of younger runaway MS stars that have been ejected from the Galactic Disc are found in this region.
Here, we present a new release of the Gaia DR3-based catalogue of halo BHB stars that is more complete than the original version of the catalogue (Culpan et al. 2021) based on Gaia Early Data Release 3 (EDR3) in crowded regions, particularly close to the Galactic Plane, and at the bluer end of the HB where late B-type BHB stars are expected. The catalogue of Galactic halo BHB candidate stars with stellar parameters derived from their spectral energy distributions (SEDs) is a subset of the newly released Gaia DR3 based catalogue. The SEDs were generated using photometric data from multiple large-scale surveys. We used the SED results to modify the Gaia DR3 selection criteria to populate the catalogue. They were further combined with newly acquired spectra to estimate the level of contamination in the catalogue. As such, the process to define the BHB selection criteria has been an iterative one. Only the final result is described in this paper.
The contents of this paper are as follows. In Sect. 2, we explain the generation of stellar parameters using SEDs and apply this method to the 16 794 BHB candidates in the parallax selection of Culpan et al. (2021) and use the results to revise and extend the Gaia DR3 CMD selection criteria. Section 3 describes how we selected and verified the applicability of various astrometric, photometric, and blending quality criteria when applied to our particular Gaia DR3 data set. In, we estimate the contamination levels and completeness of the Gaia DR3 catalogue using the stellar parameters from the SEDs, as well as the acquired spectra. Section 5 covers the apparent magnitude range, distances, and sky coverage of the Gaia DR3 catalogue. In Sect. 6, we summarise our findings and draw our conclusions.
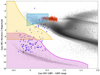 |
Fig. 1 Gaia DR3 CMD for 30 000 randomly selected objects with parallax errors less than 10% and tangential velocities greater than 145 km s−1 (grey dots). Shown: BHB CMD selection region from Culpan et al. (2021) (turquoise shading); a selection of RR-Lyrae from Gaia DR3 Clementini et al. (2022) (red dots); hot-subdwarf CMD-selection region from Culpan et al. (2022) (yellow shading); white dwarf CMD-selection region from Gentile Fusillo et al. (2021) (pink shading); (pre-)ELM white dwarfs from Pelisoli & Vos (2019) (blue circles). |
2 Spectral energy distribution analysis of BHB candidates
We used all of the 16794 BHB star candidates with parallax errors <20% found by Culpan et al. (2021) as the starting point for the SED analysis. The SED of a star is defined as the observed spectral flux density as a function of wavelength. This involved retrieving the photometric data from 66 surveys, when they were available (see Appendix B). The photometric data were only used in SED generation if they had no error flags set and thereby conformed to all the quality criteria for the survey from which they came.
The grids of synthetic SEDs were calculated with an amended version of the ATLAS12 (Kurucz 1996; Irrgang et al. 2018) code. A detailed description of the SED fit method used here can be found in Heber et al. (2018) and Latour et al. (2023). An example is shown in Fig. 2 and Table B.1 lists photometic data used for the full sample. Free parameters in this χ2 fit were the star's effective temperature (Teff), surface gravity (log g), and angular diameter (Θ), as well as the colour excess caused by interstellar extinction. The latter was treated using the extinction law of Fitzpatrick et al. (2019) for a reddening parameter of R55 = 3.01, the mean value for the Milky Way. Because the metallicity could not be determined from the SED alone, we assumed [Fe/H] = −1.7, a standard value for cool BHB stars in the Galactic field (Behr 2003). Stars hotter than the Grundahl jump (11500 K, Grundahl et al. 1999) were assigned a solar metallicity because their metal abundances are increased as a result of diffusion.
Latour et al. (2023) successfully used this approach for BHB stars in globular clusters, as shown in their Fig. 7. The angular diameter allows for a measurement of the stellar radius R when combined with a distance measurement: R = Θ/(2ϖ), where ϖ is the parallax. Here, we used the Gaia DR3 parallax measurements, corrected for zero-point offsets following Lindegren et al. (2020).
We found that the SEDs for stars where photometric data were available over the full range of wavelengths (from ultraviolet to infra-red) gave the most reliable results on the Teff versus log g and the Teff versus R plots with the BHB candidates plotting close to the BaSTI zero-age horizontal-branch (ZAHB) and the terminal-age horizontal-branch (TAHB) lines, as defined in Pietrinferni et al. (2004) and updated in Hidalgo et al. (2018). More details are given in our Fig. 3. The BHB candidate stars with full range wavelength photometry available plotted in a well-defined cloud in the BHB region of the Gaia DR3 CMD (see Fig. 4). We defined the full range of wavelengths as having data available from less than 2000 Å to over 8000 Å.
To ensure that no selection effects were distorting our results, we verified that the BHB candidates with full range photometric data were not clustered within a particular colour, parallax, or apparent magnitude range. The full range photometric data was available for Galactic halo objects across all of the sky, including regions of high apparent stellar density (see Fig. 5), giving us confidence that our results from the SED analysis were applicable to the entire BHB candidate catalogue.
We plotted the SED results for Teff versus log g and Teff versus stellar radius to identify which of the BHB candidate stars with photometric data over a wide wavelength range plotted between the ZAHB and the TAHB lines (see Fig. 3). We found that the BHB candidate CMD selection of Culpan et al. (2021) was largely restricting the upper limit of the Teff, thus excluding hotter BHB stars with B-type spectra. In particular we noted that the known BHB star Feige 86 with Teff around 15 000 K (Németh 2017) was not present in the Culpan et al. (2021) catalogue (see Fig. 4).
We found that the interstellar reddening that was calculated for the SED generation was a critical issue. When we included the objects that had reddening values greater than 0.2 mag in the candidate selection, we found a greatly increased scatter in the CMD plots (see Fig. 4).
We also found that the MS contamination levels increased where the BHB candidates with high reddening overlapped with the MS in the CMD. In this way, we used the reddening as calculated in the SED generation to define the Gaia DR3 CMD selection criteria and the upper limit on absolute magnitude was taken to be 0.2 mag extinction line when plotted on the Gaia DR3 CMD.
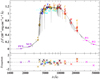 |
Fig. 2 Example of the results of an SED generated for the BHB candidate star Gaia DR3 6305433829332391168 with the photometric data labelled. The grey line is the best-fit SED solution for the available photometric data. The bottom panel showing the residuals between the best fit solution and the photometric data. |
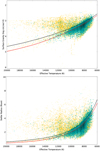 |
Fig. 3 Stellar parameters calculated by the synthetic SEDs from photometric data. All SED results are shown as yellow circles, the SED results for objects with full wavelength range photometric data available are shown as turquoise triangles. The Red line is the BaSTI ZAHB line. The black line is the BaSTI TAHB. Upper panel: Teff versus log g. Lower panel: Teff versus R. |
3 Revising the BHB star candidate catalogue from Gaia DR3 with SED results
In order to raise the upper limit on the Teff we extended the Gaia DR3 CMD search criteria towards the cluster of hot subdwarfs found in Culpan et al. (2022). The resulting overlap (see Fig. 6) means that 643 of the BHB candidates found are also hot subdwarf candidates as found in Culpan et al. (2022).
Based on Gaia DR3 data we calculated the absolute
G magnitude (Gabs), tangential velocity (VT), proper motion error (σpm), and tangential velocity error (σVT) as:
 (1)
(1)
 (2)
(2)
 (3)
(3)
 (4)
(4)
The Gaia DR3 CMD search criteria were also revised to follow the BaSTI theoretical Gabs versus (GBP − GRP) lines relating to the 0 mag and 0.2 mag reddening (Pietrinferni et al. 2004; Hidalgo et al. 2018). The actual selection criteria used (see Table 1 and Appendix C) were somewhat wider than the 0 mag and 0.2 mag reddening lines (see Fig. 7) to allow for errors in the calculated absolute magnitude arising from uncertainties of up to 20% in the Gaia DR3 parallax measurements.
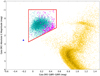 |
Fig. 4 Gaia DR3 CMD showing a sample of stars with tangential velocities greater than 145 km s−1 (yellow dots), Culpan et al. (2021) objects with full range SEDs (cyan dots), Culpan et al. (2021) objects with full range SEDs and a modelled reddening greater than 0.2 mag (magenta squares) and the known BHB Feige 86 (blue triangle) with a Teff value around 15 000K (Németh 2017), which lies outside the Gaia DR3 CMD BHB region from Culpan et al. (2021). |
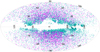 |
Fig. 5 Sky distribution of Gaia DR3 BHB candidate stars (cyan dots) and the catalogue of BHB stars with stellar parameters based on SEDs using full photometric range data (magenta dots). |
3.1 Determination of the Gaia DR3 data quality filtering criteria
Since the release of Gaia DR3 many studies were made using many different quality selection criteria. We have used the stellar parameters generated using SEDs to quantify the effect that different criteria have on the levels of contamination found in this catalogue and thus support our own quality criteria selection. We have defined contaminants as being stars that do not plot in the BHB region of the Teff versus R and the Teff versus log g plots. It should be noted that our quality criteria selection findings apply to our BHB star catalogue and may not necessarily be transferable to other situations using Gaia DR3 data.
The selection of the parallax quality criterion was examined by looking at the scatter observed in the CMD as the parallax error cutoff was varied. We observed an increase in scatter in the cloud of BHB candidates on the CMD as the parallax error cutoff was increased but there was no obvious point (e.g. a sudden increase or drop) at which a best value could be justified. We have, thus, continued to use the parallax error of <20% as the parallax quality criterion for the sake of consistency with the Culpan et al. (2021, 2022) catalogues. Relaxing the parallax quality criterion will consequently increase the possible errors of the absolute magnitude and the tangential velocity calculations (see Eqs. (1) and (2)), which will have the effect of increasing contamination levels within the catalogue.
The effect of applying the astrometric quality selection criterion used in Culpan et al. (2021), astrometric_sigma5d_max <1.5, which was taken from Lindegren et al. (2020) was compared to the fidelity_v2 criterion from Rybizki et al. (2021). We found that Rybizki et al. (2021) removed an additional 92 sources from the parallax error <20% candidates compared to Lindegren et al. (2020). This represents less than 1% of the candidates. An examination of the SEDs for these 92 objects showed no benefit in their removal in terms of reduction of contamination levels. We retained the use of the Lindegren et al. (2020) criterion.
We applied the photometry quality criterion from Riello et al. (2021, Sect. 9.4), which calculates the astrometric_excess_noise_corrected = C* and suggests a fitted scatter line of:
 (5)
(5)
Varying the value of N in Eq. (5) between 1 and 5 merely changes the number of sources selected by 25 (in a population of over 13 000) and as such, this was deemed to be of negligible significance. We have retained the value of 5 as recommended in Riello et al. (2021, Sect. 9.4).
We compared the crowded region filter from Culpan et al. (2022) to the blending criterion from Riello et al. (2021, Sect. 9.3). The Culpan et al. (2022) criterion requires that the BHB candidate's G flux must make up at least 70% of the G flux detected within a 5 arcsec radius around that candidate. The blending criterion from Riello et al. (2021) is defined as the number of transits where the Gbp or Grp photometry is likely blended with nearby sources, compared to the total number of transits used for the photometry measurements. We found that the (beta < 0.1) criterion from Riello et al. (2021) removed an additional 8639 BHB candidates compared to the Culpan et al. (2022) criterion. Once again, the contamination level found from the SED analysis was not reduced by applying the more restrictive criterion. Thus, we retained the crowded region filter from Culpan et al. (2022). The application of the data quality filters as described above to the Gaia DR3 data set resulted in 23 415 BHB candidates (see Table 1).
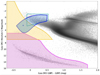 |
Fig. 6 Gaia DR3 CMD for 30 000 randomly selected objects with parallax errors less than 10% and tangential velocities greater than 145 km s−1 (grey dots). Shown: BHB CMD selection region from Culpan et al. (2021) (turquoise outline); extended BHB CMD selection region (blue shading); hot-subdwarfs CMD selection region from Culpan et al. (2022) (yellow shading); white dwarfs CMD selection region from Gentile Fusillo et al. (2021) (pink shading); and Feige 86 (blue triangle). |
Criteria for selecting the BHB candidate stars.
3.2 Sources of catalogue contamination
There is a compromise needed between completeness and contamination in our Gaia DR3 based catalogue of BHB stars. The contamination levels found may be reduced by placing tighter quality and selection criteria but this will also reduce the number of candidate stars found. We considered two types of contaminants to our catalogue.
The first type of contaminant is given by stars that should not be seen plotted in the same Gaia DR3 colour-magnitude space as BHB stars, but are in fact shown because of erroneous Gaia DR3 measurements. The main contaminants in this category will be those objects that plot closest to the BHB in Gaia DR3 colour-magnitude space. The main contaminants of this type are hot subdwarfs, pre-ELM white dwarfs, and RR-Lyrae stars. The closer the true proximity of these objects to the BHB region and the larger the population the greater the expected contamination.
The most common contaminants of this type are RR-Lyrae stars. The low temperature end of the BHB meets the instability strip where RR-Lyrae are found on the CMD (see Fig. 1). Our aim is to generate a catalogue of non-intrinsically variable stars that lie between the instability strip and the EHB, making these variable stars a significant contaminant in the catalogue. We cross-matched our BHB candidate stars with the SIMBAD database and the Gaia DR3 variability RR-Lyrae catalogue (Eyer et al. 2023; Clementini et al. 2022) to find known RR-Lyrae. Of our BHB candidates we found 1004 known RR-Lyrae from the SIMBAD database and 1136 in the Gaia catalogue. It should be noted that only a small fraction of the Clementini et al. (2022) RR-Lyrae that satisfy the parallax quality criterion, the tangential velocity selection criterion, and the BHB CMD selection criteria. We then calculated the excess flux error as defined in Gentile Fusillo et al. (2021) and Culpan et al. (2022) for all BHB candidates. The excess flux error is calculated by comparing the phot_g_flux_error of each candidate object to the median G flux error of 500 similar objects in terms of colour (bp_rp), G flux (log10 phot_g_mean_flux), and the number of observations (phot_g_n_obs) taken from the full Gaia DR3 catalogue. The flux error method is sensitive to any variable stars within the limits of the Gaia exposure time and the timescale of repeat observations. We found that over 90% of the known RR-Lyrae had an excess flux error greater than 6.0 (see Fig. 8). This was later used as a criterion for the removal of a further 189 candidate variable stars that are not found among those that are known in SIMBAD or in the Gaia DR3 variability RR-Lyrae catalogue. The fact that the remaining BHB candidates that were not identified as being variable have an average excess flux error of 0.4 demonstrates that excess flux error is an effective differentiator for variability.
The second type of contaminant is stars that are not BHB stars but correctly plot in the same region in Gaia DR3 colour-magnitude space. This category includes young A-type and B-type MS stars and blue stragglers. As previously stated, we focus on the Galactic halo to remove contamination from MS A-and B-type stars by setting a lower limit on the tangential velocity. This criterion will, however, not filter out high proper motion disk objects. Furthermore, a 20% error on parallax will lead to a scatter in tangential velocities of up to 40 km s−1 around a mean value, allowing for further contamination from MS disk objects with higher errors on their parallax measurement. It should be noted that the tangential velocity that is calculated from pmra and pmdec is calculated in the heliocentric reference frame and not the Galaxy centered reference frame. Stars in the Galactic halo may have a high radial velocity along the line of sight and therefore exhibit a low tangential velocity in the heliocentric reference frame. Thus, such stars may not end up selected. This effect is more prevalent in the direction of motion of the heliocentric system.
We applied the extended Gaia DR3 CMD selection criteria for BHB stars while applying the astrometric, photometric, crowded region, and RR-Lyrae rejection criteria given above (see Table 1). This resulted in 22 335 BHB candidate stars.
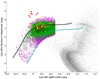 |
Fig. 7 SED based catalogue of Galactic halo BHB candidate stars. Gaia DR3 CMD showing objects with a tangential velocity greater than 145 km s−1 (grey dots). The Gaia DR3 based catalogue of BHB stars (magenta dots), the SED confirmed BHB stars (green dots), spectrally confirmed BHB stars (yellow triangles), and spectrally confirmed MS stars (red squares). Zero mag extinction (black line) and 0.2 mag extinction (cyan line) theoretical tracks are superimposed. |
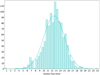 |
Fig. 8 Distribution of excess flux error for known SIMBAD and Gaia DR3 RR Lyrae found among our catalogue of BHB candidates. A bestfit Gaussian distribution (cyan line) is superimposed. |
4 Catalogue contamination estimation
To estimate the levels of contamination in the Gaia DR3 catalogue of BHB stars, we used two independent methods that were not dependent on Gaia DR3 data: the SED method as described in Sect. 3 as well as the analysis of spectra acquired specifically for this project using the Astronomical Institute of the Czech Academy of Sciences’ Perek 2m telescope located at Ondrejov in the Czech Republic.
4.1 Contamination estimation using SED results
As stated in Sect. 2, the BHB candidate stars with a full wavelength range of photometric data available give the most reliable SEDs. Full range photometric data were used in generating the SED for 10604 of the 22 335 (53%) BHB candidates found (see Table 1). Since we found no apparent selection effects with regard to Gaia DR3 colour, parallax, or apparent magnitude, we consider the BHB candidates with full range photometric data to be representative of the catalogue as a whole.
When plotting the Teff against the log g (see Fig. 9) we found that 9172 of the 10 604 objects with full photometric range data plotted within the horizontal-branch region, defined by the cutoff lines:
 (6)
(6)
 (7)
(7)
These lines are based on the ZAHB and TAHB isochrones from BaSTI models given in Pietrinferni et al. (2004), but somewhat widened to include the coherent cloud of BHBs. This gave an estimated contamination level of 14%. We confirmed these selection criteria by plotting the same BHB candidates in Teff versus R space, as well as the Teff versus L space, where they also occupy a coherent region around the ZAHB and TAHB isochrones (see Fig. 9).
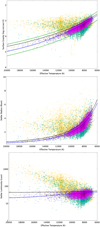 |
Fig. 9 Teff versus log g as calculated from the 22 335 BHB candidate objects where an SED calculation was made (yellow dots); 10 604 SEDs where the full frequency range is available (cyan dots), of which 9172 (magenta dots) lie within the horizontal-branch region as marked by the green lines defined by Eq. (6) and (7) (upper panel). The BaSTI ZAHB (blue line) and TAHB (black line) are also shown. Middle panel: Teff versus R. Lower panel: Teff versus L for the same subsets. |
4.2 Contamination estimation from spectral analysis
Spectra were acquired for BHB candidates with a Gaia DR3 apparent G magnitude of brighter than 11.0 mag at the Ondře-jov Observatory in the Czech Republic over a 18 month period. The spectra were acquired using the Perek 2m telescope through an Echelle spectrograph with a resolving power of R = 51 600 around Ha. The resulting spectra were reduced using the IRAF1 (Tody 1986, 1993) package and a dedicated semi-automatic pipeline Cabezas (2023), which incorporates a full range of standard procedures for echelle spectra reduction, including bias correction, flat-fielding, wavelength calibration, heliocentric calibration, and continuum normalization.
The criteria used to differentiate between spectra from BHB stars and from MS stars were the width and the depth of the Balmer series hydrogen spectral lines in a similar fashion to Xue et al. (2008). Examples of BHB and MS spectra are shown in Fig. 10. Over an 18 month period, we acquired spectra for 69 BHB candidates; of these, 6 were found to be MS stars giving a 9 ± 3% contamination level, similar to what was found with the SED analyses (Sect. 4.1), albeit with a far smaller sample.
5 Sky coverage, magnitude, and distance
The extended catalogue of BHB candidate stars presented here covers a similar apparent magnitude range and, thus, a similar distance range as the Culpan et al. (2021) predecessor; however, it contains 32% more BHB candidates. Thus, the level of completeness of the catalogue has been improved (see Fig. 11).
The catalogue of BHB candidates with stellar parameters calculated from SEDs using full photometry range data contains 9172 stars with a the same sky coverage given in Fig. 5, along with a distance range of 235 pc to 7435 pc, as shown in Fig. 12, calculated from the zero-point corrected parallax (Bailer-Jones et al. 2021) and an apparent magnitude range of 7.6 mag to 15.5 mag (as shown in Fig. 11).
6 Summary and conclusions
The Gaia DR3 catalogue of BHB star candidates is an update to the parallax selected catalogue presented in Culpan et al. (2021). This latest version of the catalogue has improved coverage at the hotter end of the BHB at Teff greater than 10 500 K. The data quality of Gaia DR3 permits less restrictive criteria being applied in regions of high apparent stellar density allowing more BHB candidates to be found. The final parallax selection in the Culpan et al. (2021) catalogue had 16794 candidate objects. The extended catalogue presented here (see Fig. 5 and Appendix A) contains 22 335 BHB candidates. This represents an increase of 32%.
We have used photometric data from 66 large scale surveys to generate synthetic SEDs and associated stellar parameters for a large number of BHB candidates, where no spectra are available. The use of such a rich dataset has allowed reliable stellar parameters to be computed. The modelled SEDs have then been used to refine the Gaia DR3 CMD selection criteria and to demonstrate contamination levels of less than 12% in the catalogue. This contamination level has also been observationally conflrmed using spectra acquired in the Ondrejov Observatory in the Czech Republic (see Fig. 7).
We have demonstrated that the use of theoretically interpolated SEDs is a powerful tool in constructing a richer, more complete and less contaminated catalogue than was done in the past. This increase of 32% in the number of BHB candidate stars compared to Culpan et al. (2021), albeit within the same volume and apparent magnitude range, represents another step in generating a more complete full-sky catalogue of BHB stars in the inner Galactic halo.
We then generated the SEDs as described above and used the results to extinction correct the Gaia DR3 (Gbp − Grp) and Gabs values. This was then used to define the lower absolute magnitude limit of the Gaia DR3 CMD BHB candidate selection region.
A further iteration was made using these newly defined Gaia DR3 CMD selection criteria and, as a result, 22 335 BHB candidates (see Fig. 7) were found. Of these candidates 10222 (46%) had photometric data available that supported the generation of stellar- and atmospheric parameters from SEDs. The stellar- and atmospheric parameters generated indicate that 9172 (41%) of these objects lie in the parameter space expected for BHBs.
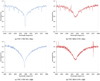 |
Fig. 10 Reduced spectra for a BHB star TYC 1738-745-1 (left panels) and a high proper-motion MS star TYC 3655-1179-1 (right panels) for Ha (upper panels) and Hβ (lower panels). |
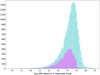 |
Fig. 11 Comparison of the Culpan et al. (2021) Gaia DR3 apparent magnitude distribution of the BHB candidate objects from the SED based catalogue (magenta) and the Gaia DR3 based catalogue (cyan). The peak values of these two histograms are found at similar values indicating that both catalogues are investigating similar volumes. Finding additional BHB candidates in the same volume indicates increased completeness of the new catalogue. |
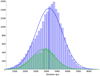 |
Fig. 12 Histogram of the geometric distance (Bailer-Jones et al. 2021) to BHB candidates from the Gaia DR3 based catalogue (blue) and the SED based catalogue of BHB candidates with stellar parameters (green). |
Acknowledgements
We thank Andreas Irrgang (University of Erlangen-Nüenberg) for amending the ATLAS12 code and developing the SED fitting tool. I.P. acknowledges funding by the UK's Science and Technology Facilities Council (STFC), grant ST/T000406/1, and from a Warwick Astrophysics prize post-doctoral fellowship made possible thanks to a generous philanthropic donation. B.K. and M.C. acknowledge the support from the Grant Agency of the Czech Republic (GACR 22-34467S) and RVO:67985815 and the Stellar Department of the Astronomical Institute of the Czech Academy of Science. This research made use of TOPCAT, an interactive graphical viewer and editor for tabular data Taylor (Taylor 2005). This research made use of the SIMBAD database, operated at CDS, Strasbourg, France; the VizieR catalogue access tool, CDS, Strasbourg, France. Some of the data presented in this paper were obtained from the Mikulski Archive for Space Telescopes (MAST). STScI is operated by the Association of Universities for Research in Astronomy, Inc., under NASA contract NAS5-26555. Support for MAST for non-HST data is provided by the NASA Office of Space Science via grant NNX13AC07G and by other grants and contracts. This research has made use of the services of the ESO Science Archive Facility. This work has made use of data from the European Space Agency (ESA) mission Gaia (https://www.cosmos.esa.int/gaia), processed by the Gaia Data Processing and Analysis Consortium (DPAC, https://www.cosmos.esa.int/web/gaia/dpac/consortium). Funding for the DPAC has been provided by national institutions, in particular the institutions participating in the Gaia Multilateral Agreement. This work has made use of BaSTI web tools.
Appendix A Gaia DR3 catalogues of BHB candidate stars
Catalogue columns.
Appendix B Photometric surveys used for synthetic SED generation
66 Surveys used in SED calculations.
Appendix C ADQL query for BHB candidates
The following query can be used on the https://gea.esac.esa.int/archive/ website to get a file containing the 30 228 BHB candidates from the Gaia DR3 data set:
SELECT *
FROM gaiadr3.gaia_source
WHERE parallax_over_error >= 5
AND parallax > 0
AND (4.74 / parallax * pm) >= 145
AND phot_g_mean_mag + 5 + 5*log10(parallax/1000) < 138.07*power(bp_rp,6) - 153.85*power(bp_rp,5)
   −40.727*power(bp_rp,4) + 73.368*power(bp_rp,3) - 7.4054*power(bp_rp,2) - 9.5575*bp_rp + 3.8459
AND phot_g_mean_mag + 5 + 5*log10(parallax/1000) > −3.2382*power(bp_rp,3) + 7.1259*power(bp_rp,2)
   −3.583*bp_rp - 0.2
AND bp_rp < 0.5 AND bp_rp > −0.4
References
- Abbott, T. M. C., Abdalla, F. B., Allam, S., et al. 2018, ApJS, 239, 18 [Google Scholar]
- Abbott, T. M. C., Adamów, M., Aguena, M., et al. 2021, ApJS, 255, 20 [NASA ADS] [CrossRef] [Google Scholar]
- Alam, S., Albareti, F. D., Allende Prieto, C., et al. 2015, ApJS, 219, 12 [Google Scholar]
- Anguiano, B., Majewski, S. R., Hayes, C. R., et al. 2020, AJ, 160, 1 [Google Scholar]
- Arp, H. C., Baum, W. A., & Sandage, A. R. 1952, AJ, 57, 4 [CrossRef] [Google Scholar]
- Bailer-Jones, C. A. L., Rybizki, J., Fouesneau, M., et al. 2021 AJ, 161, 147 [NASA ADS] [CrossRef] [Google Scholar]
- Behr, B. B. 2003, ApJS, 149, 67 [NASA ADS] [CrossRef] [Google Scholar]
- Bellini, A., Piotto, G., Bedin, L. R., et al. 2009, A&A, 493, 959 [NASA ADS] [CrossRef] [EDP Sciences] [Google Scholar]
- Bianchi, I., Shiao, B., & Thilker, D. 2017, ApJS, 230, 24 [NASA ADS] [CrossRef] [Google Scholar]
- Boyer, M. L., McDonald, I., van Loon, J. T., et al. 2008, AJ, 135, 1395 [NASA ADS] [CrossRef] [Google Scholar]
- Cabezas, M., Slechta, M., Skoda, P., & Kubátová, B., 2023 https://zenodo.org/records/10024183 [Google Scholar]
- Carollo, D., Beers, T. C., Placco, V.M., et al. 2016 Nature, 12, 1170 [Google Scholar]
- Catelan, M. 2009 Ap&SS, 320, 261 [Google Scholar]
- Chambers, K. C., Magnier, E. A., Metcalfe, N., et al. 2016 [arXiv:1612.05560] [Google Scholar]
- Chen, X., & Han, Z. 2009, MNRAS, 395, 1822 [Google Scholar]
- Chen, X., Wang, S., Deng, L., et al. 2020, ApJS, 249, 18 [NASA ADS] [CrossRef] [Google Scholar]
- Cioni, M.-R. L., Clementini, G., Girardi, L., et al. 2011, A&A, 527, A116 [CrossRef] [EDP Sciences] [Google Scholar]
- Clementini, G., Ripepi, V., Garofalo, A., et al. 2022, A&A, 674, A18 [Google Scholar]
- Clewley, L., & Jarvis, M. J. 2006, MNRAS, 368, 310 [NASA ADS] [Google Scholar]
- Cohen, R. E., Hempel, M., Mauro, F., et al. 2006, MNRAS, 368, 310 [Google Scholar]
- Computer Science Corporation 1985, NASA Contractor Report 177873 [Google Scholar]
- Culpan, R., Geier, S., & Pelisoli, I. 2021, A&A, 654, A107 [NASA ADS] [CrossRef] [EDP Sciences] [Google Scholar]
- Culpan, R., Geier, S., Reindl, N., et al. 2022, A&A, 662, A40 [NASA ADS] [CrossRef] [EDP Sciences] [Google Scholar]
- Cutri, R. M., Wright, E. L., Conrow, T., et al. 2021, VizieR Online Data Catalog: II/328 [Google Scholar]
- De Angeli, F., Weiler, M., Montegriffo, P., et al. 2023, A&A, 674, A2 [NASA ADS] [CrossRef] [EDP Sciences] [Google Scholar]
- de Jong, J. T. A., Verdoes Kleijn, G. A., Boxhoorn, D. R., Buddelmeijer, H., et al. 2015 A&A, 582, A62 [NASA ADS] [CrossRef] [EDP Sciences] [Google Scholar]
- DENIS Consortium 2005, VizieR Online Data Catalog: B/denis [Google Scholar]
- Dixon, W. V. & Kruk, J. W., 2009, AIPC, 1135, 218 [NASA ADS] [Google Scholar]
- Drlica-Wagner, A., Ferguson, P. S., Adamów, M., et al. 2022, ApJS, 261, 38 [NASA ADS] [CrossRef] [Google Scholar]
- Ducati, J. R. 2002, VizieR Online Data Catalog: Catalogue of Stellar Photometry in Johnson’s 11-color system, CDS/ADC Collection of Electronic Catalogues, 2237, 0 [Google Scholar]
- Edge, A., Sutherland, W., Kuijken, K., 2013, The Messenger, 154, 32 [NASA ADS] [Google Scholar]
- Eilers, A.-C., Hogg, D. W., Rix, H.-W., et al. 2019, ApJ, 871, 120 [Google Scholar]
- Ekanayake, G., & Wilhelm, R. 2018, MNRAS, 479, 2623 [NASA ADS] [CrossRef] [Google Scholar]
- Eyer, L., Audard, M., Holl, B., et al. 2023, A&A, 674, A13 [NASA ADS] [CrossRef] [EDP Sciences] [Google Scholar]
- Fitzpatrick, E. L., Massa, D., Gordon, K. D., et al. 2019, ApJ, 886, 108 [NASA ADS] [CrossRef] [Google Scholar]
- Flewelling, H. 2018, AAS, 231, 436.01 [NASA ADS] [Google Scholar]
- Gaia Collaboration (Vallenari, A., et al.) 2023, A&A, 674, A1 [NASA ADS] [CrossRef] [EDP Sciences] [Google Scholar]
- Gentile Fusillo, N. P., Tremblay, P.-E., Cukanovaite, E., et al. 2021, MNRAS, 508, 3877 [NASA ADS] [CrossRef] [Google Scholar]
- Girard, T. M., van Altena, W. F., Zacharias, N., & Vieira, K. 2011, AJ, 142, 15 [NASA ADS] [CrossRef] [Google Scholar]
- Greiss, S., Steeghs, D., Gänsicke, B. T., et al. 2012, AJ, 144, 24 [NASA ADS] [CrossRef] [Google Scholar]
- Grundahl, F., Catelan, M., Landsman, W. B., et al. 1999, ApJ, 524, 242 [NASA ADS] [CrossRef] [Google Scholar]
- Hauck, M., & Merlilliod, B. 1998, A&AS, 129, 431 [NASA ADS] [CrossRef] [EDP Sciences] [Google Scholar]
- Heber, U. 2009, ARA&A, 47, 211 [Google Scholar]
- Heber, U., Irrgang, A., & Schaffenroth, J. 2018, Open Astron., 27, 35 [Google Scholar]
- Henden, A. A., Levine, S., Terrell, D., & Welch, D. L. 2015, AAS, 225, 336.16 [NASA ADS] [Google Scholar]
- Hidalgo, S. L., Pietrinferni, A., Cassisi, S., et al. 2018, ApJ, 856, 125 [Google Scholar]
- Høg, E. & Fabricius, C., & Makarov, V. V. 2000, A&A, 355, L27 [NASA ADS] [Google Scholar]
- Hunger, K., & Heber, U. 1987, Planetary and Proto-Planetary Nebulae: From IRAS to ISO, 135, 137 [NASA ADS] [CrossRef] [Google Scholar]
- Irrgang, A., Przybilla, N., Heber, U., et al. 2014, A&A, 565, A63 [NASA ADS] [CrossRef] [EDP Sciences] [Google Scholar]
- Irrgang, A., Kreuzer, S., Heber, U., et al. 2018, A&A, 615, A5 [NASA ADS] [CrossRef] [EDP Sciences] [Google Scholar]
- Jarvis, M. J., Bonfield, D. G., Bruce, V. A., et al. 2013, MNRAS, 428, 1281 [Google Scholar]
- Jofré, P., & Weiss, A. 2012, A&A, 533, A59 [Google Scholar]
- Kalirai, J. 2012, Nature, 486, 90 [NASA ADS] [CrossRef] [Google Scholar]
- Kato, D., Nagashima, C., Nagayama, T., et al. 2008, VizieR Online Data Catalog: II/288 [Google Scholar]
- Kilkenny, D., Heber, U., & Drilling, J. S. 1988, SAAOC, 12, 1K [NASA ADS] [Google Scholar]
- Kilkenny, D., O’Donoghue, D., Koen, C., Stobie, R. S., & Chen, A. 1997, MNRAS, 287, 867 [NASA ADS] [CrossRef] [Google Scholar]
- Kilkenny, D., O’Donoghue, D., Worters, H. L., et al. 2015a, MNRAS 453, 1879 [NASA ADS] [CrossRef] [Google Scholar]
- Kilkenny, D., Worters, H. L., O’Donoghue, D., et al. 2015b, MNRAS, 459, 4343 [Google Scholar]
- Kravtsov, V., Alcaino, G., Marconi, G., & Alvarado, F. 2016, VizieR Online Data Catalog: J/ApJ/783/56 [Google Scholar]
- Kurucz, R. L. 1996, Model Atmos. Spectrum Synth., 108, 160 [NASA ADS] [Google Scholar]
- Lamontagne, R., Demers, S., Wesemael, F., Fontaine, G., & Irwin, M. J. 2000, AJ, 119, 241 [Google Scholar]
- Landolt, A. U. 2007, AJ, 133, 2502 [Google Scholar]
- Latour, M., Hämmerich, S., Heber, U., et al. 2023, A&A, 677, A86 [NASA ADS] [CrossRef] [EDP Sciences] [Google Scholar]
- Lawrence, A., Warren, S. J., Almaini, O., et al. 2007, MNRAS, 379, 1599 [Google Scholar]
- Lawrence, A., Warren, S. J., Almaini, O., et al. 2013, VizieR Online Data Catalog: II/319 [Google Scholar]
- Lindegren, L., Hernandez, J., Bombrun, A., et al. 2018, A&A, 616, A2 [NASA ADS] [CrossRef] [EDP Sciences] [Google Scholar]
- Lindegren, L., Bastian, U., Biermann, M., et al. 2020, A&A, 649, A4 [Google Scholar]
- Lindegren, L., Klioner, S. A., Hernandez, J., et al. 2021, A&A, 649, A2 [NASA ADS] [CrossRef] [EDP Sciences] [Google Scholar]
- Liu, Z., Cui, W., Zhao, G., et al. 2023, MNRAS 519, 995 [Google Scholar]
- Magnier, E. A., Sweeney, W. E., Chambers, K. C., et al. 2020, ApJS, 251, 5 [NASA ADS] [CrossRef] [Google Scholar]
- Marocco, F., Eisenhardt, P. R. M., Fowler, J. W., et al. 2021, ApJS, 253, 8 [Google Scholar]
- McCrea, W. 1964, MNRAS, 128, 147 [NASA ADS] [CrossRef] [Google Scholar]
- McMahon, R. G., Banerji, M., Gonzalez, E., et al. 2021, The Messenger, 154, 35 [NASA ADS] [Google Scholar]
- Meixner, M., Gordon, K. D., Indebetouw, R., et al. 2006, AJ, 132, 2268 [NASA ADS] [CrossRef] [Google Scholar]
- Mendes de Oliveira, C., Ribeiro, T., Schoenell, W., et al. 2019, MNRAS, 489, 241 [NASA ADS] [CrossRef] [Google Scholar]
- Mermilliod, J. C. 2006, VizieR Online Data Catalog: II/168 [Google Scholar]
- Minniti, D., Lucas, P., Hempel, M., & The Vvv Science Team 2023, VizieR Online Data Catalog: II/376 [Google Scholar]
- Moehler, S. 2001, PASP, 113, 788 [Google Scholar]
- Monaco, L., Bellazzini, M., Ferraro, F. R., & Pancino, E. 2003, ApJ, 597, L25 [NASA ADS] [CrossRef] [Google Scholar]
- Monguió, M., Greimel, R., Drew, J. E., et al. 2020, A&A, 638, A18 [NASA ADS] [CrossRef] [EDP Sciences] [Google Scholar]
- Montenegro, K., Minniti, D., Alonso-García, J., et al. 2019, ApJ, 872, 206 [NASA ADS] [CrossRef] [Google Scholar]
- Morel, M., & Magnenat, P. 1978, A&AS, 34, 477 [NASA ADS] [Google Scholar]
- Németh, P. 2017, OA, 26, 280 [Google Scholar]
- Nidever, D. L., Olsen, K., Walker, A. R., et al. 2017, AJ, 154, 199 [Google Scholar]
- Niederste-Ostholt, M., Belokurov, V., Evans, N. W., & Peñarrubia, J. 2010, ApJ, 712, 516 [NASA ADS] [CrossRef] [Google Scholar]
- Norris, J. E., Ryan, S. G., & Beers, T. C. 1999, ApJS, 123, 639 [NASA ADS] [CrossRef] [Google Scholar]
- O’Donoghue, D., Kilkenny, D., Koen, C., et al. 2013, MNRAS, 431, 240 [CrossRef] [Google Scholar]
- Onken, C. A., Wolf, C., Bessell, M. S., et al. 2019, PASA, 36, 33 [NASA ADS] [CrossRef] [Google Scholar]
- Page, M. J., Brindle, C., Talavera, A., et al. 2012, MNRAS, 426, 903 [NASA ADS] [CrossRef] [Google Scholar]
- Pietrinferni, A., Cassisi, S., Salaris, M., & Castelli, F. 2004, ApJ, 612, 168 [Google Scholar]
- Pelisoli, I., & Vos, J. 2019, MNRAS, 488, 2892 [Google Scholar]
- Raddi, R., Irrgang, A., Heber, U., et al. 2021, A&A, 645, A108 [NASA ADS] [CrossRef] [EDP Sciences] [Google Scholar]
- Rain, M. J., Ahumada, J. A., & Carraro, G. 2021, A&A, 650, A67 [NASA ADS] [CrossRef] [EDP Sciences] [Google Scholar]
- Riello, M., De Angeli, F., Evans, D. W., et al. 2021, A&A, 649, A3 [NASA ADS] [CrossRef] [EDP Sciences] [Google Scholar]
- Rufener, F. 1999, VizieR Online Data Catalog: II/169 [Google Scholar]
- Rybizki, J., Green, G. M., Rix, H-W., et al. 2022, MNRAS, 510, 2597 [NASA ADS] [CrossRef] [Google Scholar]
- Sandage, A. R. 1953, AJ, 58, 61 [Google Scholar]
- Santucci, R., Beers, T. C., Placco, V.M., et al. 2015 ApJ, 813, L16 [NASA ADS] [CrossRef] [Google Scholar]
- Schlafly, E. F., Green, G. M., Lang, D., et al. 2018, ApJS, 234, 39 [Google Scholar]
- Schlafly, E. F., Meisner, A. M., & Green, G. M. 2019, ApJS, 240, 30 [Google Scholar]
- Shanks, T., Metcalfe, N., Chehade, B., et al. 2015, MNRAS, 451, 4238 [NASA ADS] [CrossRef] [Google Scholar]
- Shara, M. M., Saffer, R. A., & Livio, M. 1997, ApJ, 489, L59 [NASA ADS] [CrossRef] [Google Scholar]
- Silva, M. D. V., & Napiwotzki, R. 2011, MNRAS, 411, 2596 [Google Scholar]
- Skrutskie, M. F., Cutri, R. M., Stiening, R., et al. 2006, AJ, 131, 1163 [NASA ADS] [CrossRef] [Google Scholar]
- Spitzer Science Center 2009, VizieR Online Data Catalog: II/293 [Google Scholar]
- Starkenburg, E., Youakim, K., Martin, N., et al. 2019, MNRAS, 490, 5757 [Google Scholar]
- Stetson, P. B., Pancino, E., Zocchi, A., Sanna, N., & Monelli, M. 2019, MNRAS, 485, 3042 [Google Scholar]
- Taylor, M. B. 2005, ASP Conf. Ser., 347, 29 [Google Scholar]
- Thompson, G. I., Nandy, K., Jamar, C., et al. 1978, Catalogue of stellar ultraviolet fluxes (TD1): A compilation of absolute stellar fluxes measured by the Sky Survey Telescope (S2/68) aboard the ESRO satellite TD-1 (The Science Research Council, UK) [Google Scholar]
- Tody, D. 1986, Instrumentation in Astronomy VI; Proceedings of the Meeting, Tucson, AZ, Mar. 4–8, 1986. Part 2 (A87-36376 15-35) [Google Scholar]
- Tody, D. 1993, Astronomical Data Analysis Software and Systems II, ASP Conference Ser., 52, 173 [Google Scholar]
- Udalski, A., Szymanski, M., Kubiak, M. D., et al. 2000, Acta Astron., 50, 307 [NASA ADS] [Google Scholar]
- UKIDSS Consortium 2012, VizieR Online Data Catalog: II/316 [Google Scholar]
- van Leeuwen, F. 2007, A&A, 474, 653 [CrossRef] [EDP Sciences] [Google Scholar]
- von Marttens, R., Marra, V., Quartin, M., et al. 2024, MNRAS, 527, 3347 [Google Scholar]
- Werner, M. W., Gorjian, V., Morales, F. Y., et al. 2021, ApJS, 254, 11 [NASA ADS] [CrossRef] [Google Scholar]
- Whitmore, B. C., Allam, S. S., Budavári, T., et al. 2016, AJ, 151, 134 [NASA ADS] [CrossRef] [Google Scholar]
- Whitten, D. D., Beers, T. C., Placco, V. M., et al. 2019, ApJ, 884, 67 [CrossRef] [Google Scholar]
- Xiang, M., Rix, H.-W., Ting, Y.-S., et al. 2021, ApJS, 253, 22 [NASA ADS] [CrossRef] [Google Scholar]
- Xiang, M., Rix, H.-W., Ting, Y.-S., et al. 2022, A&A, 662, A66 [NASA ADS] [CrossRef] [EDP Sciences] [Google Scholar]
- Xu, Z., & Zhaoji, J. 2005, VizieR Online Data Catalog: II/262 [Google Scholar]
- Xue, X. X., Rix, H. W., Zhao, G., et al. 2008, AJ, 684, 1143 [CrossRef] [Google Scholar]
- Yanny, B., Newberg, H. J., Johnson, J. A., et al. 2009, ApJ, 700, 1282 [NASA ADS] [CrossRef] [Google Scholar]
- Yershov, V. N. 2014, Ap&SS, 354, 97 [NASA ADS] [CrossRef] [Google Scholar]
- Zaritsky, D., Harris, J., Thompson, I. B., & Grebel, E. K. 2004, AJ, 128, 1606 [Google Scholar]
IRAF is distributed by the National Optical Astronomy Observatories, which are operated by the Association of Universities for Research in Astronomy, Inc., under cooperative agreement with the National Science Foundation.
All Tables
All Figures
|
Fig. 1 Gaia DR3 CMD for 30 000 randomly selected objects with parallax errors less than 10% and tangential velocities greater than 145 km s−1 (grey dots). Shown: BHB CMD selection region from Culpan et al. (2021) (turquoise shading); a selection of RR-Lyrae from Gaia DR3 Clementini et al. (2022) (red dots); hot-subdwarf CMD-selection region from Culpan et al. (2022) (yellow shading); white dwarf CMD-selection region from Gentile Fusillo et al. (2021) (pink shading); (pre-)ELM white dwarfs from Pelisoli & Vos (2019) (blue circles). |
| In the text | |
|
Fig. 2 Example of the results of an SED generated for the BHB candidate star Gaia DR3 6305433829332391168 with the photometric data labelled. The grey line is the best-fit SED solution for the available photometric data. The bottom panel showing the residuals between the best fit solution and the photometric data. |
| In the text | |
|
Fig. 3 Stellar parameters calculated by the synthetic SEDs from photometric data. All SED results are shown as yellow circles, the SED results for objects with full wavelength range photometric data available are shown as turquoise triangles. The Red line is the BaSTI ZAHB line. The black line is the BaSTI TAHB. Upper panel: Teff versus log g. Lower panel: Teff versus R. |
| In the text | |
|
Fig. 4 Gaia DR3 CMD showing a sample of stars with tangential velocities greater than 145 km s−1 (yellow dots), Culpan et al. (2021) objects with full range SEDs (cyan dots), Culpan et al. (2021) objects with full range SEDs and a modelled reddening greater than 0.2 mag (magenta squares) and the known BHB Feige 86 (blue triangle) with a Teff value around 15 000K (Németh 2017), which lies outside the Gaia DR3 CMD BHB region from Culpan et al. (2021). |
| In the text | |
|
Fig. 5 Sky distribution of Gaia DR3 BHB candidate stars (cyan dots) and the catalogue of BHB stars with stellar parameters based on SEDs using full photometric range data (magenta dots). |
| In the text | |
|
Fig. 6 Gaia DR3 CMD for 30 000 randomly selected objects with parallax errors less than 10% and tangential velocities greater than 145 km s−1 (grey dots). Shown: BHB CMD selection region from Culpan et al. (2021) (turquoise outline); extended BHB CMD selection region (blue shading); hot-subdwarfs CMD selection region from Culpan et al. (2022) (yellow shading); white dwarfs CMD selection region from Gentile Fusillo et al. (2021) (pink shading); and Feige 86 (blue triangle). |
| In the text | |
|
Fig. 7 SED based catalogue of Galactic halo BHB candidate stars. Gaia DR3 CMD showing objects with a tangential velocity greater than 145 km s−1 (grey dots). The Gaia DR3 based catalogue of BHB stars (magenta dots), the SED confirmed BHB stars (green dots), spectrally confirmed BHB stars (yellow triangles), and spectrally confirmed MS stars (red squares). Zero mag extinction (black line) and 0.2 mag extinction (cyan line) theoretical tracks are superimposed. |
| In the text | |
|
Fig. 8 Distribution of excess flux error for known SIMBAD and Gaia DR3 RR Lyrae found among our catalogue of BHB candidates. A bestfit Gaussian distribution (cyan line) is superimposed. |
| In the text | |
|
Fig. 9 Teff versus log g as calculated from the 22 335 BHB candidate objects where an SED calculation was made (yellow dots); 10 604 SEDs where the full frequency range is available (cyan dots), of which 9172 (magenta dots) lie within the horizontal-branch region as marked by the green lines defined by Eq. (6) and (7) (upper panel). The BaSTI ZAHB (blue line) and TAHB (black line) are also shown. Middle panel: Teff versus R. Lower panel: Teff versus L for the same subsets. |
| In the text | |
|
Fig. 10 Reduced spectra for a BHB star TYC 1738-745-1 (left panels) and a high proper-motion MS star TYC 3655-1179-1 (right panels) for Ha (upper panels) and Hβ (lower panels). |
| In the text | |
|
Fig. 11 Comparison of the Culpan et al. (2021) Gaia DR3 apparent magnitude distribution of the BHB candidate objects from the SED based catalogue (magenta) and the Gaia DR3 based catalogue (cyan). The peak values of these two histograms are found at similar values indicating that both catalogues are investigating similar volumes. Finding additional BHB candidates in the same volume indicates increased completeness of the new catalogue. |
| In the text | |
|
Fig. 12 Histogram of the geometric distance (Bailer-Jones et al. 2021) to BHB candidates from the Gaia DR3 based catalogue (blue) and the SED based catalogue of BHB candidates with stellar parameters (green). |
| In the text | |
Current usage metrics show cumulative count of Article Views (full-text article views including HTML views, PDF and ePub downloads, according to the available data) and Abstracts Views on Vision4Press platform.
Data correspond to usage on the plateform after 2015. The current usage metrics is available 48-96 hours after online publication and is updated daily on week days.
Initial download of the metrics may take a while.