Fig. 9
Download original image
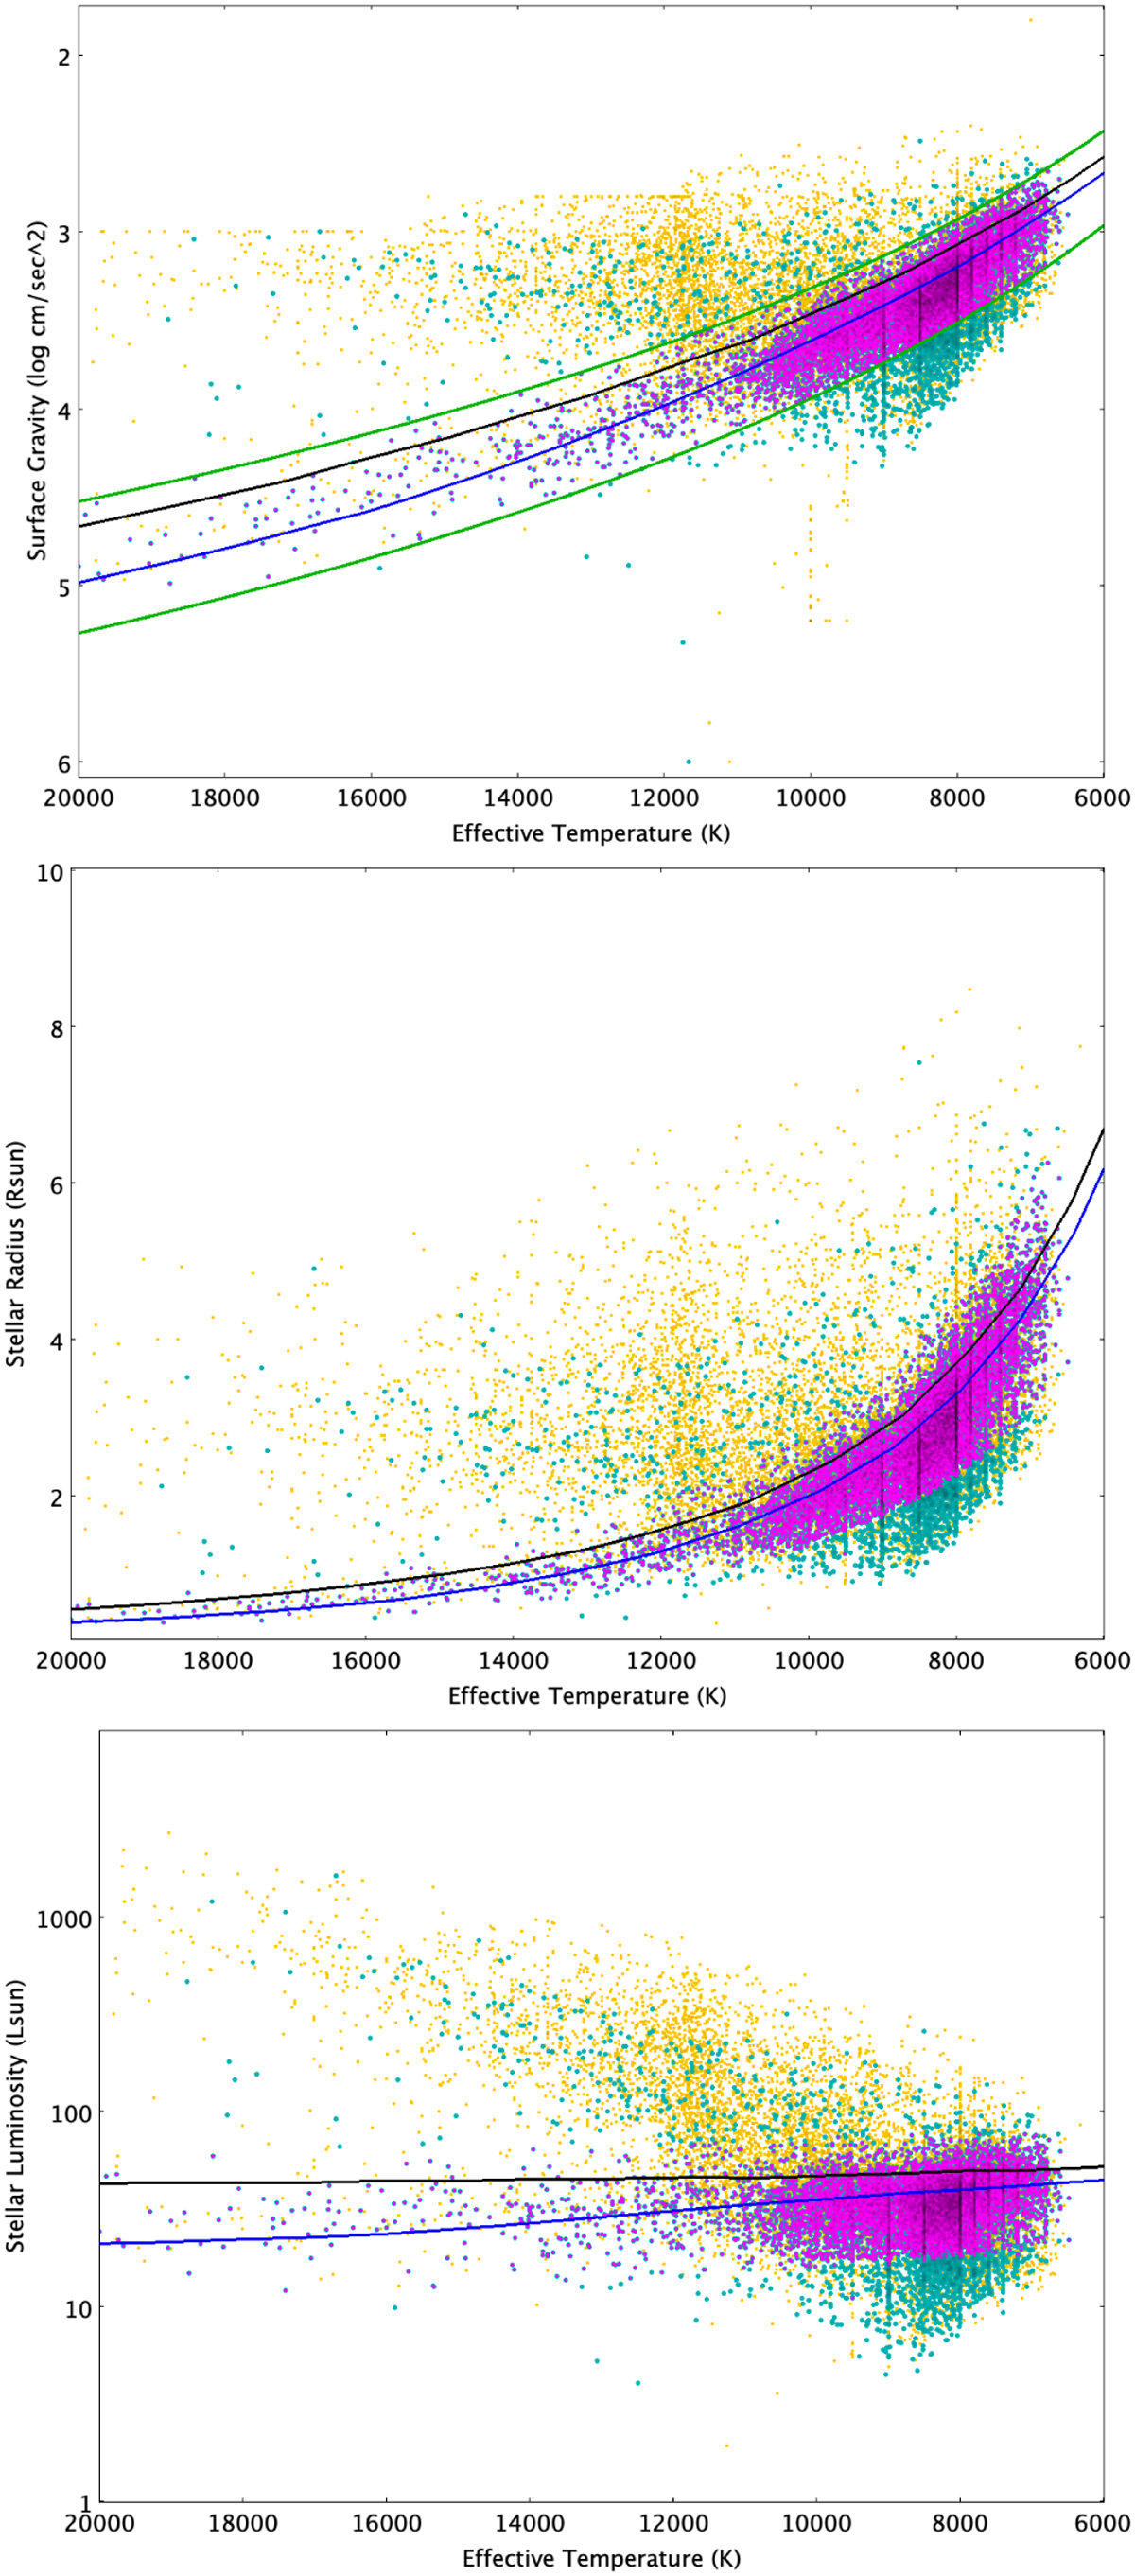
Teff versus log g as calculated from the 22 335 BHB candidate objects where an SED calculation was made (yellow dots); 10 604 SEDs where the full frequency range is available (cyan dots), of which 9172 (magenta dots) lie within the horizontal-branch region as marked by the green lines defined by Eq. (6) and (7) (upper panel). The BaSTI ZAHB (blue line) and TAHB (black line) are also shown. Middle panel: Teff versus R. Lower panel: Teff versus L for the same subsets.
Current usage metrics show cumulative count of Article Views (full-text article views including HTML views, PDF and ePub downloads, according to the available data) and Abstracts Views on Vision4Press platform.
Data correspond to usage on the plateform after 2015. The current usage metrics is available 48-96 hours after online publication and is updated daily on week days.
Initial download of the metrics may take a while.