| Issue |
A&A
Volume 678, October 2023
|
|
|---|---|---|
| Article Number | A161 | |
| Number of page(s) | 10 | |
| Section | Stellar structure and evolution | |
| DOI | https://doi.org/10.1051/0004-6361/202347141 | |
| Published online | 17 October 2023 | |
Plausible association of distant late M dwarfs with low-frequency radio emission⋆,⋆⋆
1
Leiden Observatory, Leiden University, PO Box 9513 2300 RA Leiden, The Netherlands
e-mail: gloudemans@strw.leidenuniv.nl
2
ASTRON, Netherlands Institute for Radio Astronomy, Oude Hoogeveensedijk 4, Dwingeloo 7991 PD, The Netherlands
3
Institute for Astronomy, Royal Observatory, Blackford Hill, Edinburgh EH9 3HJ, UK
4
Department of Physics, University of Oxford, Denys Wilkinson Building, Keble Road, Oxford OX1 3RH, UK
5
Department of Physics and Astronomy, University College London, Gower Street, London WC1E 6BT, UK
6
Institute for Cosmic Ray Research, The University of Tokyo, 5-1-5 Kashiwa-no-Ha, Kashiwa City, Chiba 277-8582, Japan
7
McDonald Observatory, University of Texas at Austin, 2515 Speedway, Stop C1402, Austin, TX 78712, USA
8
Department of Astronomy, University of Texas at Austin, 2515 Speedway, Stop C1400, Austin, TX 78712, USA
9
Hobby Eberly Telescope, University of Texas, 2515 Speedway, Stop C1402, Austin, TX 78712, USA
10
Centre for Astrophysics Research, University of Hertfordshire, College Lane, Hatfield AL10 9AB, UK
11
University of Colorado Boulder, Laboratory for Atmospheric and Space Physics, 3665 Discovery Drive, Boulder, CO 80303, USA
12
Max-Planck Institut für Radioastronomie, Auf dem Hügel 69, 53121 Bonn, Germany
Received:
9
June
2023
Accepted:
8
August
2023
We present the serendipitous discovery of eight distant (> 50 pc) late M dwarfs with plausible associated radio emission at 144 MHz. The M-dwarf nature of our sources has been confirmed with optical spectroscopy performed using HET/LRS2 and Subaru/FOCAS, and their radio flux densities are within the range of 0.5−1.0 mJy at 144 MHz. Considering the radio-optical source separation and source densities of the parent catalogues, we suggest that it is statistically probable that the M dwarfs are associated with the radio emission. However, it remains plausible that for some of the sources the radio emission originates from an optically faint and red galaxy hiding behind the M dwarf. The isotropic radio luminosities (∼1017 − 18 erg s−1 Hz−1) of the M dwarfs suggest that if the association is real, the radio emission is likely driven by a coherent emission process produced via plasma or electron-cyclotron maser instability processes, which is potentially caused by binary interaction. Long-term monitoring in the radio and high-resolution radio follow-up observations are necessary to search for any variability and pinpoint the radio emission to determine whether our tentative conclusion that these ultracool dwarfs are radio emitting is correct. If the low-frequency radio emission is conclusively associated with the M dwarfs, this would reveal a new population of optically faint and distant (> 50 pc) radio-emitting M dwarfs.
Key words: stars: low-mass / radio continuum: stars / techniques: spectroscopic
The spectra and photometric measurements are available at the CDS via anonymous ftp to cdsarc.cds.unistra.fr (130.79.128.5) or via https://cdsarc.cds.unistra.fr/viz-bin/cat/J/A+A/678/A161
Based on observations obtained with the Hobby-Eberly Telescope (HET), which is a joint project of the University of Texas at Austin, Pennsylvania State University, Ludwig-Maximillians-Universitaet Muenchen, and Georg-August Universitaet Goettingen. The HET is named in honor of its principal benefactors, William P. Hobby and Robert E. Eberly.
© The Authors 2023
 Open Access article, published by EDP Sciences, under the terms of the Creative Commons Attribution License (https://creativecommons.org/licenses/by/4.0), which permits unrestricted use, distribution, and reproduction in any medium, provided the original work is properly cited.
This article is published in open access under the Subscribe to Open model. Subscribe to A&A to support open access publication.
1. Introduction
M dwarfs are the most common stellar objects in our Milky Way (Bochanski et al. 2010), and they exhibit strong signatures of magnetic activity all the way to the smallest masses, despite significant changes in the internal structure requiring different dynamo mechanisms from the solar case (e.g. Reiners & Christensen 2010; Cohen et al. 2015). The population of M dwarfs partly overlaps with the population of ultracool dwarfs, which have a spectral type ≥M7, and consists of both very low-mass stars (≲0.1 M⊙) and brown dwarfs (≲0.072 M⊙), which are unable to fuse hydrogen in their core. The properties of brown dwarfs are consistent with behaviours spanning stellar to planetary regimes. For example, such objects have been shown to exhibit optical and radio auroral emission in their stellar coronae, which can directly probe magnetospheric properties of the objects (e.g. Hallinan et al. 2015; Pineda et al. 2017; Kao et al. 2018; Vedantham et al. 2020; Callingham et al. 2021a; Bastian et al. 2022).
Because of their low luminosities, ultracool dwarfs are difficult to detect at large distances. Wide-area infrared surveys, such as the Two-Micron All-Sky Survey (2MASS; Skrutskie et al. 2006), UKIRT Infrared Deep Sky Survey (UKIDSS; Lawrence et al. 2007), and Wide-field Infrared Survey Explorer (WISE; Wright et al. 2010), have been crucial in uncovering ultracool dwarf populations. Infrared wide-area surveys remain the main resource for finding new cool dwarfs. However, compiling unbiased samples of these sources without spectroscopic observing campaigns remains challenging (e.g. West et al. 2011; dal Ponte et al. 2023). Alternative search methods outside of the infrared, such as radio and X-ray observations, offer the potential for finding distinct populations of ultracool dwarfs with particular properties (e.g. Vedantham et al. 2020; De Luca et al. 2020).
Radio observations of cool dwarfs can be used to study the strength and topology of their magnetic fields (Berger et al. 2001; Hallinan et al. 2007; Route & Wolszczan 2012; Kao et al. 2016), with low-frequency radio observations (≤200 MHz) being sensitive to the conditions of the outer corona and magnetosphere. Only recently have the first discoveries of low-frequency radio detections of M dwarfs been reported by Lynch et al. (2017) using the Murchison Widefield Array (MWA; Tingay et al. 2013) and Vedantham et al. (2020) and Callingham et al. (2021b) using the Low Frequency Array (LOFAR; van Haarlem et al. 2013). Callingham et al. (2021b) and Vedantham et al. (2020) partially attribute the radio emission to plasma emission from the active chromospheres of the stars. However, the origin of radio emission for the quiescent stars in their sample is potentially driven by star-planet interactions generated via the electron-cyclotron maser instability (ECMI; Hallinan et al. 2007; Route & Wolszczan 2016; Kao et al. 2018), meaning low-frequency radio observations could potentially be used to find and study exoplanet magnetospheres as well. These radio processes have been seen as well in early M types such as CR Draconis (Callingham et al. 2021a) and YZ Ceti (Trigilio et al. 2023). Also, close stellar binaries, such as RS Canum Venaticorum (RS CVn) systems, have also been observed to generate radio emission via similar processes observed on chromospherically active stars (e.g. Toet et al. 2021; Vedantham et al. 2022).
M dwarfs are well-known contaminants of optical or near-infrared high redshift quasar selection techniques because of their similar colours (e.g. Hewett et al. 2006; Findlay et al. 2012; Bañados et al. 2016; Wagenveld et al. 2022). In a campaign searching for radio-detected high-redshift quasars, Gloudemans et al. (2022) serendipitously discovered a sample of late M dwarfs that were plausibly associated with low-frequency radio emission. This sample has been selected from a combination of the LOFAR Two Metre Sky Survey (LoTSS-DR2; Shimwell et al. 2022) and the DESI Legacy Imaging Survey (Dey et al. 2019), which is reaching over a magnitude deeper in the optical g, r, and z band than previous all-sky optical surveys such as PANSTARRS-1 (PS1; Chambers et al. 2016) and the Sloan Digital Sky Survey (SDSS; York et al. 2000). If the radio emission is associated with the M dwarfs, this would reveal a new population of distant (> 50 pc) radio-emitting M dwarfs. In this paper, we therefore present the observations and measured optical/radio properties of the M-dwarf sample, the probability of association between the optical and radio sources, and discuss the potential origin of the radio emission.
This paper is structured as follows. In Sect. 2, we describe the optical and radio catalogues and the cross-matching procedure to obtain the M-dwarf sample, which we use to investigate the possibility of the radio sources being random chance associations. In Sect. 3, we present the optical spectra and photometry of the M-dwarf sample, which allows for the spectral type to be determined and distance estimates to be obtained, and we provide their measured radio properties. Finally, in Sect. 4 we discuss the possible physical origin of the radio emission and in Sect. 5 we summarise the results and outline the future prospects. Throughout this work, we use the AB magnitude system (Oke & Gunn 1983).
2. Description of catalogues
The late M dwarfs in this work have been identified in a sample of high-z quasar candidates using a Lyman break colour selection combined with a photometric redshift analysis (see Duncan 2022 for more information) using the DESI Legacy Imaging Survey (Dey et al. 2019). In summary, the selection required a photometric redshift zphot > 3.5, a LoTSS-DR2 detection within 2″, and a colour redder than ≥1.4 mag between the Legacy r and z band. Additional spectral energy distribution (SED) fitting using the photometric redshift code EAZY (Brammer et al. 2011) and visual inspection resulted in a sample of 142 candidates for follow-up spectroscopic observations.
Between 2020 and 2022, optical spectroscopic observations were conducted for 80 sources from this sample, primarily using the Faint Object Camera and Spectrograph (FOCAS; Kashikawa et al. 2002) on the Subaru Telescope and LRS2 (Chonis et al. 2016) on the Hobby Eberly Telescope (HET; Ramsey et al. 1998; Hill et al. 2021). These observations led to the discovery of 24 new quasars at 4.9 < z < 6.6 and 56 other sources (see Gloudemans et al. 2022). Out of these 56 other sources, we have identified 28 late M dwarfs. The other 56 sources are potentially low-z star-forming galaxies or dwarfs that are difficult to classify due to low signal-to-noise. Upon further consideration of the radio-optical cross-match, we show in the following section that eight have a significant probability of association. We note that the other 20 M dwarfs do not show any notable differences in their optical or radio properties, such as colour, brightness, and estimated distance (see Sect. 3.2). This highlights the potential of this selection method and deep surveys to uncover new populations of M dwarfs. However, to provide a statistically motivated clean sample (based on their positional offsets) of radio-associated M dwarfs, we do not include them. In this section, we discuss the construction of this sample and the possibility of false chance associations between the optical and radio sources. The observational and physical properties of the M dwarfs are presented in Sect. 3. Further details on the initial target selection and data reduction are presented in Gloudemans et al. (2022).
2.1. Cross-matching procedure
As briefly mentioned before, our initial candidate sample has been obtained by cross-matching the LoTSS-DR2 catalogue (∼4.4 million sources) with an optical catalogue from the Legacy surveys (∼1.6 million sources) using the nearest-neighbour algorithm with a 2″ radius. To calculate the probability of each radio source being the true counterpart of the optical source, we used the likelihood ratio with an important parameter being the normalised radio-optical position difference given by the r statistic (Sutherland & Saunders 1992), which can be explained as an uncertainty normalised angular separation metric (similar to a 2D Gaussian probability space). The r value is given by
where αO/R and δO/R are the RA and Dec of the optical and radio source, respectively, and σα,O/R represents their individual positional uncertainties, which we assume to be Gaussian (see also Callingham et al. 2019). The positional uncertainties are completely dominated by the radio – ranging from 0.06−1.3″ and 0.06−0.8″ for the RA and Dec positions, respectively. For the r-value calculation, we used the radio uncertainties for each source separately. For the positional uncertainty of the optical source positions in the Legacy surveys, we assume 0.02″ (Dey et al. 2019). An r value of 2.0 corresponds to a reliability of ∼80−90% (see Sutherland & Saunders 1992) and therefore we conservatively retained only those targets within r < 2 and radio-optical source separations of < 1″, as the most closely matched associations with the best confidence.
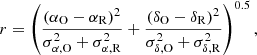
Our final sample contains eight M dwarfs with their radio-optical source separations and r statistic values shown in Fig. 1. For comparison, we also show the rejected candidates and their r values are given in Appendix B. The radio-optical source separations of our final sample range from 0.1−0.8″ and r statistic values range from 0.4 to 1.9. Their median uncertainties are 0.68″ and 0.49″ for the RA and Dec positions, respectively. Sampling the radio position uncertainties in a simple Monte-Carlo simulation yields an expected offset distribution shown by the black line in the top panel of Fig. 1, when assuming no physical intrinsic offset between the radio and optical emission. This distribution is comparable to the offsets of our M-dwarf sample and a KS test yields a p value of 0.16, meaning they could have been drawn from the same underlying distribution.
 |
Fig. 1. Radio-optical source separation of our M-dwarf sample and rejected candidates versus the r statistic (see Eq. (1)). Our criteria of r < 2 and radio-optical source separation of < 1″ are indicated with the black dashed line. The expected separation distribution from random sampling from the median positional uncertainties is given by the black dashed line in the top panel. The M-dwarf sample roughly follows the expected distribution, but with a tail to larger separations. |
We note that the offset between the radio and optical source could be partially due to proper motion. However, these M dwarfs are very distant (see Sect. 3.2) and the images are generally taken only a couple years apart. Even if these are some of the fastest moving stars (such as Barnard’s star with ∼10″ yr−1 at 1.8 pc; Gaia Collaboration 2023), it would take at least 5 yr to get a 1″ offset due to proper motion.
2.2. Probability of chance association
We can also estimate the chance association rate using the optical and radio source densities of the parent catalogues, which is given by
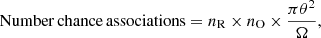
where nR/O are the number densities of the radio and optical sources, respectively, θ the matching radius (set to 1″), and Ω/italic> the overlapping survey area (5230 deg2). Cross-matching the two parent catalogues, which are the LoTSS-DR2 and the Legacy survey catalogue with colour cuts applied, within 1″ results in 128 matches and this random chance association calculation suggests that 320 sources could be falsely associated, which is more than the number of matches we find. However, this calculation is purely based on the average source density. It does not take the astrometric uncertainties of the radio and optical catalogues into account, and also not the variation in optical and radio source densities across the surveys, which differ significantly (∼100 − 1000 deg−2).
Another approach to investigate chance alignments is to perform simple Monte Carlo simulations using all the sources in the optical catalogue (∼1.6 million sources), which were used for cross-matching with the LoTSS-DR2 catalogue (of ∼4.4 million sources). To determine the number of chance associations between these two catalogues, we determined the number densities of radio and optical sources in a ∼5 deg2 box around each of our 128 matched candidates. Subsequently, we randomly generated the same number of optical source positions in the same sky area (1000 times) and cross-matched them again to the radio sources within a 1″ radius. This resulted in a median expected number of random matches of ∼130 in the total LoTSS-DR2 area of 5230 deg2, which is comparable to the 128 DESI-LoTSS candidates found within 1″.
Therefore, we conclude that it is possible that the detections are chance associations purely based on the source density and astrometric accuracy of the radio and optical catalogues. However, in the case of false associations, the only plausible explanation for this radio emission would be a radio-bright galaxy hiding behind the ultracool dwarf. Since there is no evidence for spectral signatures (e.g. emission lines or continuum) of galaxies in the M-dwarf spectra (see Fig. 2), a potential galaxy hiding behind the M dwarfs should be red and/or optically faint. We can therefore take a prior that for the associations to be purely based on chance, we need to hide a passive, red radio-bright galaxy closely aligned behind the ultracool dwarf. Given the measured radio flux densities of our sources (< 1 mJy), we expect most of the radio emission to originate from star formation if there is a galaxy hiding behind the M dwarf (see Best et al. 2023). We discuss this probability in the next section.
 |
Fig. 2. Observed-frame optical spectra obtained with Subaru/FOCAS and HET/LRS2 of the M-dwarf sample. The best-fitting template spectra (from PyHammer; Roulston et al. 2020) are shown in blue with the M-dwarf type indicated in the top left of each panel. We have binned each spectrum to reduce the noise level and enable a qualitative assessment of the template fits. All spectra are publicly available at the CDS. |
2.3. Chance of hiding a faint galaxy
To get an estimate of the number density of optically faint and radio bright galaxies that could be producing similar radio flux densities and remain non-detected in the obtained spectra, we utilised the LoTSS Deep Fields data in the ELAIS-N1 and Lockman Hole fields (Kondapally et al. 2021; Tasse et al. 2021; Sabater et al. 2021; Duncan et al. 2021). The radio images reach a sensitivity of 20 and 22 μJy beam−1 for the ELAIS-N1 and Lockman Hole fields, respectively. Multi-wavelength catalogues created by Kondapally et al. (2021) contain PS1 photometry (g, r, i, z, y band) from the Medium Deep Survey (MDS; Chambers et al. 2016) in ELAIS-N1 in an overlap area of 8.05 deg2. The Lockman Hole field catalogue contains Spitzer Adaptation of the Red-sequence Cluster Survey (SpARCS; Wilson et al. 2009) photometry (g, r, z band) in a 13.32 deg2 area. The LoTSS-DR2 RMS noise is ∼83 μJy beam−1 and, therefore, to obtain a number density of faint radio-emitting galaxies in LoTSS-DR2, we set a lower limit of 5 × 83 μJy radio flux for sources in the ELAIS-N1 and Lockman Hole catalogues. Furthermore, we required a g-band non-detection with > 24.6 mag (5σ limit from the Legacy surveys) as well as r- and z-band magnitudes of > 24.2 and > 20.8, which are the median magnitudes of our M dwarfs. This resulted in a total number of 1307 and 2130 galaxies in the ELAIS-N1 and Lockman Hole area, respectively, and number densities of 152 and 147 deg−2 with the great majority of sources having a zphot ∼ 1 − 3.
To get an estimate of the sky densities of ultracool dwarfs (M, L, and T dwarfs), we took the same approach as Wagenveld et al. (2022) and used a galactic model derived by Chen et al. (2001) to calculate the theoretical number densities of ultracool dwarfs in the Milky Way. To convert this to an observed number density, we utilised the magnitude ranges of different dwarf types listed by Best et al. (2018) and integrated the spatial density over a cone, representing an observed sky area, for different magnitude bins (see Wagenveld et al. 2022 for further details). Since the ultracool dwarf number density is highly dependent on the sky location, we calculated the local densities for each dwarf in our sample individually in a 1 deg2 area and integrated the magnitude bins up to the Legacy z-band 5σ depth of 23.4 mag, which gives a median number density of 110 deg−2.
Finally, to determine the chance association of these two populations, we again used Eq. (2), which resulted in expected random chance associations of 0.0040 and 0.0039 deg−2 for ELAIS-N1 and the Lockman Hole, respectively. This result suggests that we can expect ∼22 ultracool dwarfs to hide a radio-bright galaxy, existing in the total LoTSS-DR2 area. The sky density of M dwarfs alone (without the L and T dwarfs) yields a similar expected number of 20 M dwarfs hiding a radio-bright galaxy, since the M dwarfs are more abundant. Therefore, we cannot rule out that some of our M dwarfs do indeed have a faint radio galaxy hiding behind them. However, when performing the same SED fitting procedure with EAZY (using the PS1 g, r, i, z, y band, UKIDSS J band, and WISE W1 and W2 photometry) on 9948 known M, L, and T dwarfs, we find that only ∼5% result in a photometric redshift solution of zphot > 3.5. These sources are an almost equal combination of M, L, and T dwarfs; however, since the dwarf sample contained only 359 T dwarfs (compared to 8381 M dwarfs and 1206 L dwarfs), the T dwarfs are most likely to have a high redshift solution. From this calculation, we expect that the vast majority (21/22) of these 22 ultracool dwarfs with a background radio-bright galaxy would not have made it to our final candidate sample. Also, considering that we have conducted spectroscopic observations of only ∼56% of our high-z quasar candidate sample, we conclude it remains plausible that (at least part of) the ultracool dwarf sample we present has radio emission associated with the star.
3. Sample properties
Our high-redshift quasar search has therefore led to the identification of a sample of eight M dwarfs with a plausible radio association. In this section, we present their spectral and photometric properties, which can be used to estimate their distances, and we discuss their radio properties.
3.1. Optical spectra and photometric properties
The spectra of the eight late M dwarfs are shown in Fig. 2. In short, the Subaru/FOCAS observations have been carried out using the VPH850 grating and SO58 filter (5800 − 10 350 Å) with a slit width of 1″ and a spectral resolution of R ∼ 600. The HET spectra have been obtained using the LRS2 integral field spectrograph, which comprises a blue and red arm: LRS2-B (3650−6950 Å) and LRS2-R (6450−10 500 Å). The raw LRS2 data were initially processed with Panacea1, which carries out fibre extraction, wavelength calibration, and relative fibre normalisation. The absolute flux calibration comes from default response curves and measures of the mirror illumination as well as the exposure throughput from guider images. The data were then processed using LRS2Multi2 to perform sky subtraction following the procedures described in Gloudemans et al. (2022) as well as 1D spectral extraction. The Subaru/FOCAS spectra have been reduced following the standard procedure using the Image Reduction and Analysis Facility software (IRAF; Tody 1986), which includes the standard bias subtraction, flat fielding, wavelength and flux calibration, and sky subtraction.
To investigate the properties of our sample, we performed stellar spectral classification on our optical spectra (10× binned to reduce the noise) using the software tool PyHammer (Roulston et al. 2020), which automatically matches spectral types ranging from O- to L-type stars in the wavelength range of 3650−10 200 Å. To avoid the noise from telluric contamination affecting the fit, we cut off our spectra at 9000 Å. All of our sources are classified as late M dwarfs by PyHammer. We adjusted the subtype of five sources to visually fit the spectral features better. These adjustments are taken into account in the error on the spectral type, which is generally ±1. The final template fits are plotted in the spectra in Fig. 2. We do not detect significant Hα emission lines for any of these M dwarfs. However, we only have the sensitivity to detect the most active sources with these spectra, and a typical population of chromospherically active M dwarfs has equivalent widths (see Reiners & Basri 2010) that would have been within the noise. The possible origin of the radio emission is discussed in Sect. 4.
The M-dwarf nature of our sample is strengthened by their optical and near-infrared colours. In Fig. 3, we compare their colours to observed stellar M, L, and T dwarfs with lower limits on iPS1 − z given for three sources that are non-detected in the PS1 i band. The colours of our sample are similar to the known M-dwarf population.
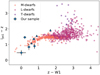 |
Fig. 3. Optical colours of our sample compared to a literature sample of M, L, and T dwarfs (https://docs.google.com/spreadsheets/d/1i98ft8g5mzPp2DNno0kcz4B9nzMxdpyz5UquAVhz-U8/edit?usp=sharing). The colours of our sample are compatible with the known M-dwarf population. Three M dwarfs from our sample have a non-detection in the i band and are therefore shown as lower limits. |
3.2. Distances
To estimate the distances to the M dwarfs in our sample, we used the absolute J-band magnitude versus spectral type relation derived by Filippazzo et al. (2015). This relation is derived for ultracool dwarfs (M6–T9) and is obtained using the optical and infrared spectra of known dwarfs together with their parallaxes and kinematic distances. We obtained the apparent J-band magnitudes of our sources from the UKIDSS Hemisphere Survey (UHS; Dye et al. 2018), which range from 19.3−20.4. Two of our sources (ILTJ1004+3424 and ILTJ1755+3937) were not detected in the UHS survey with a 3σJ-band detection limit of 21.01 and 20.86, respectively, obtained from forced photometry with a 1.5″ aperture radius. One source (ILTJ1101+6507) is not available in the UHS footprint and therefore no distance estimate is given. The resulting distances of 420−870 pc are shown in Fig. 4 with lower limits for the non-detected M dwarfs. The error bars give the range of distances consistent with our knowledge of their spectral types and J-magnitude errors. Their large sizes are mainly caused by the uncertainty as to their spectral type. Due to the faint nature of our sources, the distances to these sources are likely significantly higher than the distances found by Callingham et al. (2021b) of 4 to ∼50 pc. We note that if these sources are equal-mass binaries (see Sect. 4), we could be underestimating the distances and the distances reported here would provide a lower limit in that case.
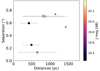 |
Fig. 4. Estimated distances of our M-dwarf sample versus optical-radio separation and J-band magnitude. These distances have been obtained using the relation derived by Filippazzo et al. (2015) for ultracool dwarfs. The large error bars are mainly due to uncertainty as to the spectral classification. Lower limits (3σ) on the distances are given for the two M dwarfs without a significant J-band detection. The M dwarf ILTJ1101+6507 is outside of the UHS footprint and therefore not included in this figure. |
The observed and measured properties of our M-dwarf sample are summarised in Table 1. All of the spectra as well as optical and radio photometric measurements are publicly available3.
Properties of the radio-bright M-dwarf sample.
3.3. Radio properties
Since our initial sample has been selected using LOFAR, all sources in our M-dwarf sample have radio detections at 144 MHz from the LoTSS-DR2 survey with total fluxes within the range of ∼0.5−1.0 mJy and estimated 144 MHz spectral luminosities of ∼1−9 × 10¹⁷ erg Hz−1 s−1 (assuming isotropic emission, see Table 1). These radio luminosities are comparable to the radio luminosity observed by Callingham et al. (2021a) of a flaring M-dwarf binary CR Draconis. However, we note that the uncertainties on the radio luminosity are more than 100%, since the distances are highly uncertain.
None of our M dwarfs have been detected in either the VLA FIRST survey at 1.4 GHz (Becker et al. 1994; five out of eight in the footprint), NRAO VLA Sky Survey (NVSS; Condon et al. 1998; eight out of eight in the footprint), or the Very Large Array Sky Survey (VLASS; Lacy et al. 2020; eight out of eight in the footprint) at 2−4 GHz. Their optical/infrared images with radio contours are shown in Appendix A. The M dwarfs are also not detected in the circularly polarised Stokes-V images of the LoTSS-DR2 survey (V-LoTSS; see Callingham et al. 2023), unlike the M dwarfs discovered by Callingham et al. (2021b). However, it is not surprising that they have not been detected in V-LoTSS since even the total intensity (Stokes-I) fluxes are close to the noise limit of the survey (see Table 1), and therefore only nearly 100% circular polarised sources would have been detected. The median circularly polarised fraction of the M-dwarf population identified by Callingham et al. (2021b) is ≈60%.
Furthermore, we investigated potential source variability by examining the single epoch LoTSS images (two to six epochs per source). If no variability is observed, that would imply that the origin of the emission is more consistent with an extragalatic origin. However, since all of our sources are close to the detection limit of the mosaic (∼0.4 mJy beam−1 for a 5σ detection), none are detected (signal-to-noise < 3) in the single epoch images (with ∼2.5−7.5 mJy beam−1 for a 5σ detection).
4. Discussion
We have presented an M-dwarf sample with plausible associated radio emission. If the low-frequency radio emission is conclusively associated with the M dwarfs, this would reveal a new population of radio-emitting M dwarfs, since they are ∼6 − 12 mag fainter in the optical bands than the M dwarfs found by Callingham et al. (2021b). Also, if this is the case, we would expect there to be a much larger population since less than 5% of the known M dwarfs survived our photometric redshift cut (see Sect. 2.3). In this section, we discuss the possible physical origin of this radio emission.
Radio emission from ultracool dwarfs can be produced by either coherent or incoherent processes (Dulk 1985). Incoherent radio emission is generated by the gyrosynchrotron process, resulting in low (≲20%) circularly polarised light and brightness temperatures ≲1012 K. In comparison, coherent radio emission can be highly circularly polarised and can reach much higher brightness temperatures as it is produced via plasma or electron-cyclotron maser instability processes.
The non-detection of our sample in circular polarisation implies that the circularly polarised fraction of all of the sources are < 70%. Such a limit is not a constraint to differentiate between the different emission mechanisms, especially since the median circularly polarised fraction of the nearby M-dwarf population identified by Callingham et al. (2021b) was ≈60%. However, taking the reported distances at face value, the luminosity and implied brightness temperatures of the sample are high. For example, the reported 144 MHz luminosities reach similar values as observed from the M-dwarf system CR Draconis during its bursting phase (Callingham et al. 2021a). If we assume the entire photosphere of the stars to be emitting, which itself is a conservative estimate since the emission regions are likely smaller (Zarka 1998), the brightness temperatures would be ≳1013 K. This implies that a coherent emission process is likely driving the radio emission. However, we note that the large uncertainties on the size of the ECMI emission region and distances to the sources does allow for a small parameter space in which an incoherent mechanism could produce the radio emission. Follow-up observations to reduce the uncertainty as to the distance to the objects would be useful to conclusively determine the emission mechanism.
We note that the properties of our population of late M dwarfs appear peculiar, in terms of their optical faintness and large distances, in light of what has been studied before for radio detected ultracool dwarfs (e.g. Villadsen & Hallinan 2019; Osten et al. 2005). However, there is some precedence that our low-frequency selection from a wide field survey selects for populations of objects not previously isolated. For example, Vedantham et al. (2020) identified a late T-dwarf object at ≈70 pc, making it the most distant ultracool dwarf detected with radio emission. The radio luminosity is over an order of magnitude brighter than the ultracool dwarfs previously detected in the radio (e.g. Kao et al. 2016; Zic et al. 2019). Because of this high radio luminosity, it is unlikely for the radio emission to be driven by a potential star-planet interaction, which was suggested by Callingham et al. (2021b) to be a possible explanation for some of their radio-loud M dwarfs. This is because the suggested luminosity is too high for standard sub-Alfvénic star-planet interaction models.
One hypothesis for this increased radio luminosity is that the object identified by Vedantham et al. (2020) is a magnetically interacting binary, which allows the radio emission to be boosted to the observed luminosities. It is possible that the ultracool dwarfs we have detected are actually similar mass binaries, helping explain why the radio luminosity can reach such high levels, keeping in mind the significant uncertainty of the distance of these objects. In such a case, the hypothesis is that closely interacting binaries, such as RS CVn systems, are generating the coherent radio emission via similar processes observed on chromospherically active stars, which can produce high-brightness temperature-radio emission that is relatively constant in time (e.g. Toet et al. 2021; Vedantham et al. 2022). Similarly, Vedantham et al. (2023) recently discovered radio pulsations from a T-dwarf binary with the radio emission potentially powered by this dwarf binary interaction. Their work also highlights the capabilities of new low-frequency radio surveys in discovering radio-loud objects at planetary mass scales.
5. Summary and conclusion
In a campaign searching for high-z quasars, we serendipitously discovered eight M dwarfs with potentially associated low-frequency radio emission at 144 MHz. The optical spectra taken with Subaru/FOCAS and HET/LRS2 reveal they are likely late M dwarfs. These M dwarfs are optically faint (∼20 mag in the J band) from which we have estimated distances of 420−870 pc using a spectral-type distance relation. Their radio luminosities of ∼1017 − 18 erg s−1 Hz−1 are comparable to previously observed radio stellar flares. However, since we do not see any variability in the single epoch images, the radio emission is likely emitted over a longer period of time than a single 8 h epoch. To investigate the association between the optical and radio source, we calculated the random chance association rate analytically and using Monte Carlo simulations, which suggests it is possible these are chance associations purely based on the source density and astrometric accuracy of the radio and optical catalogues. However, the only other plausible origin of the radio emission is from an optically faint and radio-bright galaxy hiding behind the M dwarf. Our ultracool dwarf and radio galaxy sky density calculations using the LOFAR Deep Fields suggest it remains plausible (at least in part) that our ultracool dwarf sample has true radio emission associated to it.
The radio luminosities of our sample suggest the radio emission is possibly driven by a coherent emission process, which can produce much higher brightness temperatures than incoherent emission. These objects are potentially similar mass binaries, which allows the emission to be boosted to the observed luminosities. This sample remains peculiar (in terms of their optical faintness and distance) in light of previously discovered ultracool dwarfs and, if the radio emission is proven to be associated, this would reveal a new population of distant late M dwarfs. This work highlights the utility of wide-area surveys and knowledge exchange between different fields within astronomy for serendipitous discoveries. Long-term monitoring of these objects in the radio to search for any variability or proper motion is required to determine whether our tentative conclusion that these ultracool dwarfs are radio emitting is correct.
Acknowledgments
We would like to thank Prof. S. Mahadevan for a fruitful discussion that helped guide the focus of this paper. We are grateful for the support of Kentaro Aoki and Ichi Tanaka during our Subaru/FOCAS observations (proposal ID S21B-003). The Low Resolution Spectrograph 2 (LRS2) was developed and funded by the University of Texas at Austin McDonald Observatory and Department of Astronomy, and by Pennsylvania State University. We thank the Leibniz-Institut fur Astrophysik Potsdam (AIP) and the Institut fur Astrophysik Goettingen (IAG) for their contributions to the construction of the integral field units. We thank the Board of the Hobby-Eberly Telescope for the allocation of Guaranteed Time for the LRS2 instrument, which was important in enabling this investigation. This paper is based (in part) on data obtained with the International LOFAR Telescope (ILT) under project codes LC0 015, LC2 024, LC2 038, LC3 008, LC4 008, LC4 034 and LT10 01. LOFAR (van Haarlem et al. 2013) is the Low Frequency Array designed and constructed by ASTRON. It has observing, data processing, and data storage facilities in several countries, which are owned by various parties (each with their own funding sources), and which are collectively operated by the ILT foundation under a joint scientific policy. The ILT resources have benefited from the following recent major funding sources: CNRS-INSU, Observatoire de Paris and Université d’Orléans, France; BMBF, MIWF-NRW, MPG, Germany; Science Foundation Ireland (SFI), Department of Business, Enterprise and Innovation (DBEI), Ireland; NWO, The Netherlands; The Science and Technology Facilities Council, UK; Ministry of Science and Higher Education, Poland. This research made use of the Dutch national e-infrastructure with support of the SURF Cooperative (e-infra 180169) and the LOFAR e-infra group. The Jülich LOFAR Long-Term Archive and the German LOFAR network are both coordinated and operated by the Jülich Supercomputing Centre (JSC), and computing resources on the supercomputer JUWELS at JSC were provided by the Gauss Centre for Supercomputing e.V. (grant CHTB00) through the John von Neumann Institute for Computing (NIC). This research made use of the University of Hertfordshire high-performance computing facility and the LOFAR-UK computing facility located at the University of Hertfordshire and supported by STFC [ST/P000096/1], and of the Italian LOFAR IT computing infrastructure supported and operated by INAF, and by the Physics Department of Turin university (under an agreement with Consorzio Interuniversitario per la Fisica Spaziale) at the C3S Supercomputing Centre, Italy.
References
- Bañados, E., Venemans, B. P., Decarli, R., et al. 2016, ApJS, 227, 11 [Google Scholar]
- Bastian, T. S., Cotton, W. D., & Hallinan, G. 2022, ApJ, 935, 99 [NASA ADS] [CrossRef] [Google Scholar]
- Becker, R. H., White, R. L., & Helfand, D. J. 1994, in Astronomical Data Analysis Software and Systems III, eds. D. R. Crabtree, R. J. Hanisch, & J. Barnes, ASP Conf. Ser., 61, 165 [NASA ADS] [Google Scholar]
- Berger, E., Ball, S., Becker, K. M., et al. 2001, Nature, 410, 338 [NASA ADS] [CrossRef] [Google Scholar]
- Best, W. M. J., Magnier, E. A., Liu, M. C., et al. 2018, ApJS, 234, 1 [Google Scholar]
- Best, P. N., Kondapally, R., Williams, W. L., et al. 2023, MNRAS, 523, 1729 [NASA ADS] [CrossRef] [Google Scholar]
- Bochanski, J. J., Hawley, S. L., Covey, K. R., et al. 2010, AJ, 139, 2679 [NASA ADS] [CrossRef] [Google Scholar]
- Brammer, G. B., Whitaker, K. E., van Dokkum, P. G., et al. 2011, ApJ, 739, 24 [NASA ADS] [CrossRef] [Google Scholar]
- Callingham, J. R., Vedantham, H. K., Pope, B. J. S., Shimwell, T. W., & the LoTSS Team 2019, Res. Notes Am. Astron. Soc., 3, 37 [Google Scholar]
- Callingham, J. R., Pope, B. J. S., Feinstein, A. D., et al. 2021a, A&A, 648, A13 [EDP Sciences] [Google Scholar]
- Callingham, J. R., Vedantham, H. K., Shimwell, T. W., et al. 2021b, Nat. Astron., 5, 1233 [NASA ADS] [CrossRef] [Google Scholar]
- Callingham, J. R., Shimwell, T. W., Vedantham, H. K., et al. 2023, A&A, 670, A124 [NASA ADS] [CrossRef] [EDP Sciences] [Google Scholar]
- Chambers, K. C., Magnier, E. A., Metcalfe, N., et al. 2016, arXiv e-prints [arXiv:1612.05560] [Google Scholar]
- Chen, B., Stoughton, C., Smith, J. A., et al. 2001, ApJ, 553, 184 [Google Scholar]
- Chonis, T. S., Hill, G. J., Lee, H., et al. 2016, in Ground-based and Airborne Instrumentation for Astronomy VI, eds. C. J. Evans, L. Simard, & H. Takami, SPIE Conf. Ser., 9908, 99084C [NASA ADS] [Google Scholar]
- Cohen, O., Ma, Y., Drake, J. J., et al. 2015, ApJ, 806, 41 [NASA ADS] [CrossRef] [Google Scholar]
- Condon, J. J., Cotton, W. D., Greisen, E. W., et al. 1998, AJ, 115, 1693 [Google Scholar]
- Cutri, R. M., Wright, E. L., Conrow, T., et al. 2021, VizieR Online Data Catalog: II/328 [Google Scholar]
- dal Ponte, M., Santiago, B., Rosell, A. C., et al. 2023, MNRAS, 522, 1951 [NASA ADS] [CrossRef] [Google Scholar]
- De Luca, A., Stelzer, B., Burgasser, A. J., et al. 2020, A&A, 634, L13 [NASA ADS] [CrossRef] [EDP Sciences] [Google Scholar]
- Dey, A., Schlegel, D. J., Lang, D., et al. 2019, AJ, 157, 168 [Google Scholar]
- Dulk, G. A. 1985, ARA&A, 23, 169 [Google Scholar]
- Duncan, K. J. 2022, MNRAS, 512, 3662 [NASA ADS] [CrossRef] [Google Scholar]
- Duncan, K. J., Kondapally, R., Brown, M. J. I., et al. 2021, A&A, 648, A4 [EDP Sciences] [Google Scholar]
- Dye, S., Lawrence, A., Read, M. A., et al. 2018, MNRAS, 473, 5113 [Google Scholar]
- Filippazzo, J. C., Rice, E. L., Faherty, J., et al. 2015, ApJ, 810, 158 [Google Scholar]
- Findlay, J. R., Sutherland, W. J., Venemans, B. P., et al. 2012, MNRAS, 419, 3354 [NASA ADS] [CrossRef] [Google Scholar]
- Gaia Collaboration (Vallenari, A., et al.) 2023, A&A, 674, A1 [NASA ADS] [CrossRef] [EDP Sciences] [Google Scholar]
- Gloudemans, A. J., Duncan, K. J., Saxena, A., et al. 2022, A&A, 668, A27 [NASA ADS] [CrossRef] [EDP Sciences] [Google Scholar]
- Hallinan, G., Bourke, S., Lane, C., et al. 2007, ApJ, 663, L25 [NASA ADS] [CrossRef] [Google Scholar]
- Hallinan, G., Littlefair, S. P., Cotter, G., et al. 2015, Nature, 523, 568 [NASA ADS] [CrossRef] [Google Scholar]
- Hewett, P. C., Warren, S. J., Leggett, S. K., & Hodgkin, S. T. 2006, MNRAS, 367, 454 [Google Scholar]
- Hill, G. J., Lee, H., MacQueen, P. J., et al. 2021, AJ, 162, 298 [NASA ADS] [CrossRef] [Google Scholar]
- Kao, M. M., Hallinan, G., Pineda, J. S., et al. 2016, ApJ, 818, 24 [NASA ADS] [CrossRef] [Google Scholar]
- Kao, M. M., Hallinan, G., Pineda, J. S., Stevenson, D., & Burgasser, A. 2018, ApJS, 237, 25 [NASA ADS] [CrossRef] [Google Scholar]
- Kashikawa, N., Aoki, K., Asai, R., et al. 2002, PASJ, 54, 819 [NASA ADS] [Google Scholar]
- Kondapally, R., Best, P. N., Hardcastle, M. J., et al. 2021, A&A, 648, A3 [EDP Sciences] [Google Scholar]
- Lacy, M., Baum, S. A., Chandler, C. J., et al. 2020, PASP, 132, 035001 [Google Scholar]
- Lawrence, A., Warren, S. J., Almaini, O., et al. 2007, MNRAS, 379, 1599 [Google Scholar]
- Lynch, C. R., Lenc, E., Kaplan, D. L., Murphy, T., & Anderson, G. E. 2017, ApJ, 836, L30 [Google Scholar]
- Oke, J. B., & Gunn, J. E. 1983, ApJ, 266, 713 [NASA ADS] [CrossRef] [Google Scholar]
- Osten, R. A., Hawley, S. L., Allred, J. C., Johns-Krull, C. M., & Roark, C. 2005, ApJ, 621, 398 [Google Scholar]
- Pineda, J. S., Hallinan, G., & Kao, M. M. 2017, ApJ, 846, 75 [Google Scholar]
- Ramsey, L. W., Engel, L., Rhoads, B., et al. 1998, Am. Astron. Soc. Meet. Abstr., 193, 10.07 [NASA ADS] [Google Scholar]
- Reiners, A., & Basri, G. 2010, ApJ, 710, 924 [Google Scholar]
- Reiners, A., & Christensen, U. R. 2010, A&A, 522, A13 [NASA ADS] [CrossRef] [EDP Sciences] [Google Scholar]
- Roulston, B. R., Green, P. J., & Kesseli, A. Y. 2020, ApJS, 249, 34 [NASA ADS] [CrossRef] [Google Scholar]
- Route, M., & Wolszczan, A. 2012, ApJ, 747, L22 [NASA ADS] [CrossRef] [Google Scholar]
- Route, M., & Wolszczan, A. 2016, ApJ, 830, 85 [NASA ADS] [CrossRef] [Google Scholar]
- Sabater, J., Best, P. N., Tasse, C., et al. 2021, A&A, 648, A2 [EDP Sciences] [Google Scholar]
- Shimwell, T. W., Hardcastle, M. J., Tasse, C., et al. 2022, A&A, 659, A1 [NASA ADS] [CrossRef] [EDP Sciences] [Google Scholar]
- Skrutskie, M. F., Cutri, R. M., Stiening, R., et al. 2006, AJ, 131, 1163 [NASA ADS] [CrossRef] [Google Scholar]
- Sutherland, W., & Saunders, W. 1992, MNRAS, 259, 413 [Google Scholar]
- Tasse, C., Shimwell, T., Hardcastle, M. J., et al. 2021, A&A, 648, A1 [EDP Sciences] [Google Scholar]
- Tingay, S. J., Goeke, R., Bowman, J. D., et al. 2013, PASA, 30, e007 [Google Scholar]
- Tody, D. 1986, in Instrumentation in Astronomy VI, ed. D. L. Crawford, SPIE Conf. Ser., 627, 733 [NASA ADS] [CrossRef] [Google Scholar]
- Toet, S. E. B., Vedantham, H. K., Callingham, J. R., et al. 2021, A&A, 654, A21 [NASA ADS] [CrossRef] [EDP Sciences] [Google Scholar]
- Trigilio, C., Biswas, A., Leto, P., et al. 2023, ApJL, submitted [arXiv:2305.00809] [Google Scholar]
- van Haarlem, M. P., Wise, M. W., Gunst, A. W., et al. 2013, A&A, 556, A2 [NASA ADS] [CrossRef] [EDP Sciences] [Google Scholar]
- Vedantham, H. K., Callingham, J. R., Shimwell, T. W., et al. 2020, ApJ, 903, L33 [Google Scholar]
- Vedantham, H. K., Callingham, J. R., Shimwell, T. W., et al. 2022, ApJ, 926, L30 [NASA ADS] [CrossRef] [Google Scholar]
- Vedantham, H. K., Dupuy, T. J., Evans, E. L., et al. 2023, A&A, 675, L6 [NASA ADS] [CrossRef] [EDP Sciences] [Google Scholar]
- Villadsen, J., & Hallinan, G. 2019, ApJ, 871, 214 [Google Scholar]
- Wagenveld, J. D., Saxena, A., Duncan, K. J., Röttgering, H. J. A., & Zhang, M. 2022, A&A, 660, A22 [NASA ADS] [CrossRef] [EDP Sciences] [Google Scholar]
- West, A. A., Morgan, D. P., Bochanski, J. J., et al. 2011, in 16th Cambridge Workshop on Cool Stars, Stellar Systems, and the Sun, eds. C. Johns-Krull, M. K. Browning, & A. A. West, ASP Conf. Ser., 448, 1407 [Google Scholar]
- Wilson, G., Muzzin, A., Yee, H. K. C., et al. 2009, ApJ, 698, 1943 [Google Scholar]
- Wright, E. L., Eisenhardt, P. R. M., Mainzer, A. K., et al. 2010, AJ, 140, 1868 [Google Scholar]
- York, D. G., Adelman, J., Anderson, J. E., Jr., et al. 2000, AJ, 120, 1579 [NASA ADS] [CrossRef] [Google Scholar]
- Zarka, P. 1998, J. Geophys. Res., 103, 20159 [Google Scholar]
- Zic, A., Lynch, C., Murphy, T., Kaplan, D. L., & Chandra, P. 2019, MNRAS, 483, 614 [NASA ADS] [CrossRef] [Google Scholar]
Appendix A: Cutouts of M-dwarf sample
The optical, infrared, and radio cutouts of our M dwarfs are shown in Fig. A.1. They have been selected as high-z quasar candidates by Gloudemans et al. (2022) and are non-detected in both the Legacy g and r band.
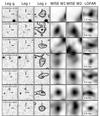 |
Fig. A.1. 20″ × 20″ Legacy DR8 (Dey et al. 2019), AllWISE (Cutri et al. 2021), and LOFAR (LoTSS-DR2; Shimwell et al. 2022) cutouts for our brown dwarf sample. Radio contours are drawn at 2-6 times the rms noise level. |
Appendix B: Rejected candidates
The rejected M dwarfs are summarised in Table B.1 including their optical coordinates, radio source separation, and r-statistic value. In this paper, we conservatively retain only the M dwarfs within r < 2 and radio-optical source separations of < 1″, as the most closely matched associations with the best confidence.
Properties of the rejected candidates.
All Tables
All Figures
|
Fig. 1. Radio-optical source separation of our M-dwarf sample and rejected candidates versus the r statistic (see Eq. (1)). Our criteria of r < 2 and radio-optical source separation of < 1″ are indicated with the black dashed line. The expected separation distribution from random sampling from the median positional uncertainties is given by the black dashed line in the top panel. The M-dwarf sample roughly follows the expected distribution, but with a tail to larger separations. |
| In the text | |
|
Fig. 2. Observed-frame optical spectra obtained with Subaru/FOCAS and HET/LRS2 of the M-dwarf sample. The best-fitting template spectra (from PyHammer; Roulston et al. 2020) are shown in blue with the M-dwarf type indicated in the top left of each panel. We have binned each spectrum to reduce the noise level and enable a qualitative assessment of the template fits. All spectra are publicly available at the CDS. |
| In the text | |
|
Fig. 3. Optical colours of our sample compared to a literature sample of M, L, and T dwarfs (https://docs.google.com/spreadsheets/d/1i98ft8g5mzPp2DNno0kcz4B9nzMxdpyz5UquAVhz-U8/edit?usp=sharing). The colours of our sample are compatible with the known M-dwarf population. Three M dwarfs from our sample have a non-detection in the i band and are therefore shown as lower limits. |
| In the text | |
|
Fig. 4. Estimated distances of our M-dwarf sample versus optical-radio separation and J-band magnitude. These distances have been obtained using the relation derived by Filippazzo et al. (2015) for ultracool dwarfs. The large error bars are mainly due to uncertainty as to the spectral classification. Lower limits (3σ) on the distances are given for the two M dwarfs without a significant J-band detection. The M dwarf ILTJ1101+6507 is outside of the UHS footprint and therefore not included in this figure. |
| In the text | |
|
Fig. A.1. 20″ × 20″ Legacy DR8 (Dey et al. 2019), AllWISE (Cutri et al. 2021), and LOFAR (LoTSS-DR2; Shimwell et al. 2022) cutouts for our brown dwarf sample. Radio contours are drawn at 2-6 times the rms noise level. |
| In the text | |
Current usage metrics show cumulative count of Article Views (full-text article views including HTML views, PDF and ePub downloads, according to the available data) and Abstracts Views on Vision4Press platform.
Data correspond to usage on the plateform after 2015. The current usage metrics is available 48-96 hours after online publication and is updated daily on week days.
Initial download of the metrics may take a while.