| Issue |
A&A
Volume 685, May 2024
|
|
|---|---|---|
| Article Number | A49 | |
| Number of page(s) | 10 | |
| Section | Stellar structure and evolution | |
| DOI | https://doi.org/10.1051/0004-6361/202244896 | |
| Published online | 03 May 2024 | |
Nova 1670 (CK Vulpeculae) was a merger of a red giant with a helium white dwarf
1
Nicolaus Copernicus Astronomical Center, Polish Academy of Sciences, Rabiańska 8, 87-100 Toruń, Poland
e-mail: tylenda@ncac.torun.pl; tomkam@ncac.torun.pl
2
Nicolaus Copernicus Astronomical Center, Polish Academy of Sciences, Bartycka 18, 00-716 Warszawa, Poland
e-mail: smolec@camk.edu.pl
Received:
6
September
2022
Accepted:
8
December
2023
Context. Nova 1670 is a historical transient bearing strong similarities to a recently recognized type of stellar eruption known as the red nova, which is thought to be powered by stellar mergers. The remnant of the transient, CK Vul, is observable today mainly through cool circumstellar gas and dust, and recombining plasma, but we have no direct view on the stellar object.
Aims. Within the merger hypothesis, we aim to infer the most likely configuration of the progenitor system that resulted in Nova 1670.
Methods. We collected the literature data on the physical properties of the outburst and the remnant (including their energetics), and on the chemical composition of the circumstellar material (including elemental and isotopic abundances). These data, which result from optical and submillimeter observations of the circumstellar gas of CK Vul, are summarized here. We performed simple simulations to analyze the form and the level of mixing within the material associated with the merger. We identified products of nuclear burning, among which we find ashes of hydrogen burning in the CNO cycles and in the MgAl chain, as well as signs of partial helium burning.
Results. Based primarily on the luminosity and chemical composition of the remnant, we find that the progenitor primary had to be an evolutionarily advanced red giant branch star of a mass of 1–2 M⊙. The secondary was either a very similar giant, or –more likely– a helium white dwarf. While the eruption event was mainly powered by accretion, we estimate that about 12% of total energy is likely to have come from helium burning activated during the merger. The coalescence of a first-ascent giant with a helium white dwarf created a star with a rather unique internal structure and composition, which resemble those of early R-type carbon stars.
Conclusions. Nova 1670 is the result of a merger between a helium white dwarf and a first-ascent red giant and is likely now evolving to become an early R-type carbon star.
Key words: stars: activity / stars: individual: CK Vul / stars: individual: Nova 1670 / stars: variables: general / stars: winds / outflows
© The Authors 2024
 Open Access article, published by EDP Sciences, under the terms of the Creative Commons Attribution License (https://creativecommons.org/licenses/by/4.0), which permits unrestricted use, distribution, and reproduction in any medium, provided the original work is properly cited.
This article is published in open access under the Subscribe to Open model. Subscribe to A&A to support open access publication.
1. Introduction
On 20 June 1670, Anthelme Voituret (Dom Anthelme), a Carthusian monk in Dijon (France), spotted a new star of ∼3 mag in the constellation of Cygnus. A month later, the star was independently found by Johannes Hevelius in Gdańsk (Poland). Since then, the object has been gradually fading, and in October it became invisible to the naked eye. In March 1671, the star reappeared and on 30 April attained its maximum brightness of ∼2.6 mag. Subsequent fading lasted until the end of August, when the star became invisible again. The following year, in March–May 1672, the object was observable for a third time, but now as a much fainter star of ∼5.4 mag. A detailed description of historical data on Nova 1670 can be found in Shara et al. (1985). In modern astronomy, Nova 1670 is known as CK Vulpeculae1.
Numerous attempts to find a remnant of Nova 1670 date back to the 17th century (for references, see Shara et al. 1985), but all failed to detect any stellar-like object. Shara et al. (1985) claimed to see a very faint star at the expected position, but later observations were not able to confirm that sighting (Naylor et al. 1992). All that was found in the optical was a faint nebulosity emitting mainly in the [N II] and Hα lines (e.g., Shara et al. 1985; Hajduk et al. 2007); this is shown in Fig. 1.
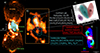 |
Fig. 1. Components of the nebula surrounding CK Vul. (a) Optical hourglass nebula (orange and white) seen in the combined emission of Hα and [N II] lines (from Hajduk et al. 2013). Millimeter-wave emission of CO 1–0 is overlaid in cyan (from Kamiński et al. 2020). Green markers and labels show the characteristic velocities of these components. (b) Zoomed-in central portion of the components shown in (a). The structure of the optical nebula is seen more clearly. The red ellipse indicates the central region where many O-bearing molecules and strong dust emission are observed. The gray rectangle shows the region within the northern optical “jet” observed spectrally in the optical–near-infrared with X-shooter at a very high sensitivity (Tylenda et al. 2019). (c) The inset shows dispersed emission of a spectral line within the northern jet and illustrates that the emission is composed of at least three distinct morpho-kinematical components. (d) Combined emission of SiO (green), N2H+ (blue), and mm-wave continuum define the molecular nebula (from Kamiński et al. 2020). The central region, bright in dust emission, is marked with a red ellipse. |
Until the end of the 20th century, Nova 1670 was primarily considered to be a classical nova, that is, an event resulting from thermonuclear runaway on the surface of a white dwarf (WD) accreting H-rich matter in a binary system. This false identification of Nova 1670 as a classical nova was claimed despite the obvious problem that the light curve clearly did not resemble that of a classical nova (this group includes slow novae). Indeed, it had two well-defined peaks separated by almost a year, followed by a much dimmer peak the following year (see Fig. 2 in Shara et al. 1985). Moreover, it appeared that CK Vul was relatively bright in the far-infrared (FIR) and submillimeter (submm) range (Evans et al. 2002). With the absence of any stellar emission in the optical, this implies that the remnant of Nova 1670 is embedded in a thick, dusty envelope. Nothing of the sort has been observed in any of the historical classical novae (cf. Kamiński et al. 2022).
These findings have prompted some authors to postulate that Nova 1670 was a (very) late He-shell flash in a post-asymptotic giant branch (post-AGB) star, similar to V605 Aql or V4334 Sgr (Harrison 1996; Evans et al. 2002). However, there are fundamental problems with the luminosity evolution in this scenario. Namely, Nova 1670 had ∼107 L⊙ at maximum, while CK Vul has only a few tens of solar units at present (see Sect. 2.4), that is, the object faded by more than five orders of magnitude over ∼340 years. This is to be compared to a typical luminosity of a post-AGB star, which is of the order of 104 L⊙ and does not change significantly during the He-shell flash. Even if one neglects the absolute values (e.g., arguing that the distance to CK Vul is uncertain), within the post-AGB hypothesis the luminosity drop would mean that CK Vul is below 0.1 L⊙. First, the evolution of a post-AGB star to that luminosity would take a million years or more (e.g., Blöcker 1995; Miller Bertolami 2016), which is orders of magnitude more than the age of CK Vul. Second, it would imply a distance of a few tens of parsecs (pc), well below any distance estimate existing in the literature. Therefore, Nova 1670 could not result from a late He-shell flash in a post-AGB star.
The eruption of V838 Mon in 2002 (Munari et al. 2002; Kimeswenger et al. 2002; Crause et al. 2003) was one of the most exciting and intriguing events in stellar astrophysics in recent decades. Astrophysicists began to realize that there exists a class of stellar outbursts that does not fit any of the known and understood mechanisms of stellar eruptions. The eruptions of this new type, named red novae or red transients, show a particular spectral evolution: in the course of the outburst, the spectrum evolves towards progressively later types, down to a late M-type in the declining phase. Following the idea outlined in Soker & Tylenda (2003), Tylenda & Soker (2006) showed that the principal characteristics of red novae can be understood in terms of a hypothesis that these eruptions result from stellar mergers. Soon after, this hypothesis received strong observational support; in particular from Tylenda et al. (2011), who showed that V1309 Sco was a contact binary just before its red nova outburst in 2008.
Following the idea of Soker & Tylenda (2003), Kato (2003) suggested that Nova 1670 might have also resulted from a stellar merger. The author drew attention to similarities between the light curve of Nova 1670 and that of V838 Mon. Although the light curves of both objects display three brightness peaks, the timescale of the outburst of Nova 1670 is an order of magnitude longer than that of V838 Mon, and indeed of any other red nova known at that time. This raised certain objections against Kato’s interpretation of Nova 1670. Later, Tylenda et al. (2013) discovered a red nova in the archives of the OGLE project, OGLE-2002-BLG360, whose light curve showed multiple peaks on a timescale similar to that of Nova 1670. This revived the interest in Nova 1670 as a probable red nova.
Following the finding of Tylenda et al. (2013), an extensive study of CK Vul in the (sub)millimeter range was undertaken (Kamiński et al. 2015, 2017, 2018a, 2020). The project provided data that strongly support the hypothesis of the red-nova nature of Nova 1670. In the present paper, we summarize the results of this project and of other studies. We then show that they can be consistently interpreted in terms of the merger of a red giant branch (RGB) star with a helium white dwarf (HeWD).
2. Observational results
2.1. The remnant
At present, the remnant of Nova 1670 (CK Vul) is observed at optical and submm wavelengths as a bipolar nebula. Figure 1 summarizes its components. In the optical, a faint emission-line nebula of an hourglass shape is visible, mainly in Hα and [N II] lines (Shara et al. 1985; Hajduk et al. 2007). The bipolar lobes extend up to ∼36″ from the center of the hourglass. Detailed optical spectroscopy of the brightest clump close to the center of the nebula revealed a rich, low-excitation nebular spectrum (Tylenda et al. 2019). No central stellar-like object has been identified so far. Evidently, it is hidden in a dense, dusty central region of the remnant (see below).
In the submm range, the object displays a very rich spectrum of molecular emission lines (Kamiński et al. 2015, 2017). The emission region again shows a bipolar structure, although it is more compact than the optical nebula. The submm emission of molecules and dust extend only up to ∼8″ from the center (Kamiński et al. 2020). Also, the axis of symmetry of the bipolar structure is slightly different from that of the optical hourglass. Contrary to the optical structure, the emission region of the molecular lines (at least in some of them) and dust shows a well-defined central component of ∼2″ in size. It appears that most of the molecular mass (∼60%) is concentrated in this compact central region (Kamiński et al. 2021).
2.2. Distance
Until recently, CK Vul was assumed to be at a distance of ∼0.7 kpc. This value was obtained in Hajduk et al. (2013) from an analysis of images and the kinematical structure of the nebula probed by the Hα and [N II] lines. However, as pointed out in Kamiński et al. (2021), Hajduk et al. (2013) made a mistake in their calculations. Instead of the inclination angle of the nebula of i = 25° (relative to the sky plane), which resulted from fitting their model image to the observations, they took i = 65° (presumably taken as 90°–25°) when deriving the distance. If Hajduk et al. (2013) had taken i = 25°, they would have obtained a distance of ∼3.2 kpc (see also Banerjee et al. 2020). Kamiński et al. (2021) showed that the inclination cannot be larger than ∼35° and consequently the distance cannot be lower than ∼2.6 kpc. With their measurements of the radial velocity difference between the outermost tips of the optical hourglass nebula, that is, ∼1640 km s−1, and adopting i = 25°, Kamiński et al. (2021) derived a distance of ∼3.5 kpc.
The above distance values rely on the observed radial velocity difference between the northern and southern tips of the nebula (see Fig. 1 in Hajduk et al. 2013) and on the assumption that the line joining the tips has the same inclination as the main body of the hourglass nebula. The latter assumption may not be valid, given the fact that there are several bipolar structures in the inner nebula that are not perfectly aligned with the axis of the large hourglass (Kamiński et al. 2015, 2021; Eyres et al. 2018).
Both the inclination angle and the distance can be constrained from modeling the shape of the Hα line seen through a long slit and shown in Figs. 3 and 4 of Hajduk et al. (2013). We attempted such a determination and used almost the same model as that in Kamiński et al. (2021). In particular, we assume a linear (“Hubble law”-like) expansion of the nebula,

where v is the expansion velocity at a radial distance r from the center of the nebula. Simulating long-slit observations at the position shown in Fig. 3 of Hajduk et al. (2013), we were able to reproduce the observed shape of Hα as displayed in their Fig. 4. The best fit was obtained for i = 24° and v0 = 1200 km s−1 at r0 = 30″. Assuming that the nebular expansion started 340 years ago, the obtained value of v0 (at r0 = 30″) results in a distance of 2.9 kpc. We note that the observed radial-velocity difference between the tips implies, in our model, that the inclination of the line joining the tips is ∼30°.
Finally, Kamiński et al. (2021) derived a distance of ∼3.8 kpc by modeling the kinematical structure of the molecular lobes seen in interferometric ALMA images of the molecular component of the remnant of CK Vul. Henceforth, we adopt a distance to CK Vul of 3.3 kpc, which is a mean value from the above determinations.
2.3. Kinematics
CK Vul displays a wide range of outflow velocities. The central region expands relatively slowly, with a typical velocity of ∼50 km s−1 (Kamiński et al. 2021). This is what causes this region to remain compact compared to the rest of the remnant. The molecular matter in the lobes expands much faster, with a characteristic velocity of ∼300 km s−1 (Kamiński et al. 2021). Even faster outflows are observed in the optical hourglass. According to our analysis, described in Sect. 2.2, the matter situated 30″ from the center of the remnant expands at 1200 km s−1, while a maximum outflow velocity of ∼1700 km s−1 is attained in the hourglass tips (cf. panel a in Fig. 1). All the values quoted in this section follow the linear expansion relation – v = 1200 km s−1(r/30″) –, quite closely, which is consistent with saying that all the matter observed now in CK Vul was ejected at approximately the same time, that is, during the outbursts observed in 1670–72.
2.4. Luminosities and energetics
Nova 1670 reached its maximum visual brightness at mv ≃ 2.6 on 30 April 1671 (Shara et al. 1985). Adopting a distance of 3.3 kpc and an interstellar extinction with Av ≃ 2.8 (Tylenda et al. 2019) yields an absolute magnitude of Mv ≃ −12.8. This corresponds to a luminosity of ∼1.0 × 10⁷ L⊙ if no bolometric correction (BC = 0.0) is assumed. The power of the outburst of CK Vul by far exceeds that attained by the brightest Galactic red nova, V838 Mon (Mv = −9.8 and L ≃ 1.0 × 10⁶ L⊙) in its 2002 outburst (Sparks et al. 2008).
The visual light curve of Nova 1670 (Shara et al. 1985) yields an estimate of the total energy emitted by the object as optical radiation of ∼3.3 × 1047 erg. However, this is a lower limit to the total radiative energy of the nova, as we do not know when the eruption started (the object was already as bright as ∼3.0 mag when it was discovered; see Shara et al. 1985). Moreover, as found in general for red novae, the object was likely to emit a significant flux in the IR in late stages of the eruption. The above value can be compared to the kinetic energy of the molecular ejecta estimated in Kamiński et al. (2021), of namely ∼2.3 × 1047 erg.
At present, CK Vul radiates mainly in the FIR, with a maximum flux (λFλ) at 100–200 μm (Evans et al. 2002; Kamiński et al. 2015). The central object is readily obscured, and we can only observe the light reradiated by dust. A combination of the observed integrated flux with a distance of 3.3 kpc results in a luminosity of ∼20 L⊙. This is a lower limit on the luminosity of the central star, as the observed dust is clearly concentrated in a compact torus or disk (Eyres et al. 2018; Kamiński et al. 2020) and a certain part of the stellar radiation can escape through polar directions without interacting with dust. However, the observed distribution of dust emission suggests that the escaping part of the emission cannot be much higher than that which is observed (cf. Eyres et al. 2018). We therefore propose a value of 100 L⊙ as a generous upper limit on the luminosity of the central object in CK Vul.
2.5. Elemental abundances and isotopic ratios
Table 1 presents the elemental abundances and the isotopic ratios measured in CK Vul. The elemental abundances were determined by Tylenda et al. (2019) from their spectroscopic optical observations of the brightest nebular region of CK Vul (cf. Figs. 2a and b). The abundances given in Table 1 are taken from Table 6 of Tylenda et al. (2019). We note that the abundance of carbon was not directly measured. From their study of the molecular spectrum of CK Vul, Kamiński et al. (2015, 2017) concluded that the C/O number ratio is close to one. This was inferred from the inventory of molecules compared to molecular species observed around stars with a known C/O ratio. Therefore, the carbon abundance given in Table 1 was calculated from that of oxygen, assuming C/O = 1 (in number of atoms). The isotopic ratios of the CNO elements are taken from Kamiński et al. (2017), who performed an analysis of the rich molecular spectrum of CK Vul observed in the mm and submm region. The ratio of aluminum isotopes was measured by Kamiński et al. (2018a), who carried out observations and analysis of the emission lines of AlF in the mm-wave spectrum of CK Vul. This was the first ever detection of an astrophysical molecule containing a radioactive isotope (26Al).
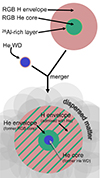 |
Fig. 2. Schematic illustration of the proposed scenario of a merger between an RGB star with a HeWD, and of its product. The relative sizes of the internal substructures of the stars are not to scale. Pink regions show H-rich matter; dark green represents He-rich gas; light green shows the thin 26Al layer; and blue depicts the He core of the WD. |
Elemental abundances and isotopic ratios.
The abundance data obtained for CK Vul are compared in Table 1 to solar values from Asplund et al. (2009). Helium and nitrogen are overabundant, while oxygen is clearly underabundant in CK Vul. As a result, the N/O number ratio is equal to ∼1.4 which is about ten times higher than in the Sun. All this amounts to clear evidence that the observed matter was processed in the CNO cycles of H burning. The heavier elements, which are not affected by the CNO cycles – that is, Ne, S, and Ar – are, on average, less abundant than in the Sun by a factor of ∼2.7. Also, the summed abundance of C, N, and O – which is not affected by the CNO cycles either – is lower by a similar factor, namely of ∼3.2. The progenitor of CK Vul was likely formed in an environment approximately three times less enriched in heavy elements than the Sun ([Fe/H] ≃ −0.5).
There are observational hints that the element abundances are not uniform across the ejecta of CK Vul. An analysis of emission maps of different molecules in Kamiński et al. (2020) suggests that the central region (cf. Fig. 1) is more oxygen rich than the bipolar lobes, while the latter are most probably nitrogen-rich and have a C/O number ratio of close to one. The bright nebular region investigated by Tylenda et al. (2019) spatially overlaps with the northern molecular lobe. The bright and extended optical components A and B defined in Tylenda et al. (2019) and represented in panel c of Fig. 1 are most certainly physically linked to that lobe. However, the position of the faint and compact component C suggests that it might instead belong to the central region. Although the abundance analysis of component C is less certain (due to a faint and lower-quality spectrum) than for components A and B, the derived N/O ratio for component C is about four times lower than that obtained for A and B (see Table 5 in Tylenda et al. 2019). Therefore, we can conclude that the matter in the lobes is probably more affected by CNO cycles than that in the central region.
Aside from the discussed elements, an optical absorption line of lithium was observed in the outflow of CK Vul against more distant stars (Hajduk et al. 2013). Although Kamiński et al. (2023) made an attempt to derive the relative Li abundance and obtained log NLi/Ntot + 12 ≈ 2.5 (mass fraction 2 × 10⁻⁹), the results are very uncertain and are not sufficiently constraining for this study. Lithium abundance and its origin are therefore not discussed in further detail here.
2.6. Masses involved in the molecular envelope
Kamiński et al. (2017) determined parameters of the molecular matter in CK Vul from their single-dish submm observations. These authors derived the size of the CO emission region, ϕ = 9 6, and the surface CO density, Σ(CO) = 3.0 × 1017 cm−2. With the adopted distance to CK Vul (d = 3.3 kpc) we obtain the total number of CO molecules, that is, N(CO) = π (0.5ϕd)2Σ(CO)≃5.1 × 1052, and the mass of CO, namely ∼2.4 × 1030 g or ∼1.2 × 10⁻³ M⊙. With the mass fraction of oxygen, ∼1.0 × 10⁻³ (Table 1), as well as assuming C/O ≃ 1, and that most of the carbon and oxygen is locked in CO, we estimate that the total mass of the molecular envelope of CK Vul is ∼0.7 M⊙. A similar estimate, ∼0.6 M⊙, was made by Kamiński et al. (2021) based on interferometric ALMA maps of CK Vul. However, as these authors warn, the total mass can be even higher than ∼0.8 M⊙ when corrected for various observational effects. According to Kamiński et al. (2021), most of the mass (∼60%) of the circumstellar matter is concentrated in the central region, while the lobes contain the remaining ∼40% of the molecular material.
On the basis of the observed lines of AlF, Kamiński et al. (2018a) concluded that the ratio of 27Al to 26Al in CK Vul is approximately 7 and that the observed mass of 26Al is ∼7 × 1025 g (3.5 × 10⁻⁸ M⊙; recalculated to a distance of 3.3 kpc). However, the latter value is rather a lower limit on the true amount of 26Al in CK Vul, because the abundance of AlF is limited by the abundance of fluorine rather than that of the much more abundant aluminum.
We estimate the expected total mass of aluminum in the envelope of CK Vul from its presumed abundance. As discussed in Sect. 2.5, heavy elements in CK Vul are underabundant by a factor of about 3 compared to the solar composition. We assume that a similar factor holds for aluminum and that the mass fraction of this element is ∼1.9 × 10⁻⁵. We therefore expect to find ∼2.6 × 1028 g (1.31 × 10⁻⁵ M⊙) of aluminum in the envelope of CK Vul. If the ratio 27Al/26Al ≃ 7 holds for the whole envelope, the total mass of 26Al should be ∼3.7 × 1027 g (1.85 × 10⁻⁶ M⊙). This should be considered as an upper limit, because the ratio of 27Al/26Al in the outer parts of the envelope is likely to be much higher than the value derived by Kamiński et al. (2018a) for the innermost regions.
2.7. Abundance of fluorine
Fluorine is observed in CK Vul only through rotational transitions of the AlF molecule (Kamiński et al. 2017). Detailed ALMA images (Kamiński et al. 2020) show that the emission of AlF is concentrated in the inner central region of the object. From the surface densities of AlF and CO in the central region, as derived in Kamiński et al. (2020, see their Fig. 8), we deduce the number ratio F/O ≃ 2.2 × 10⁻⁴. Here, we assume that most of the oxygen is locked in CO and that most of the fluorine is locked in AlF. The former assumption is probably correct, given that C/O ≃ 1 in the envelope of CK Vul. However, it is questionable whether we observe all the fluorine via AlF lines, as the existence of other molecules bearing this element, for example HF, is not excluded. Thus, the above value of 2.2 × 10⁻⁴ is most probably a lower limit on the F/O ratio in CK Vul. We note that the solar value of F/O is 7.4 × 10⁻⁵.
3. Interpretation
In this section, we present an interpretation of the observational results discussed so far in the framework of the hypothesis that the Nova 1670 event resulted from a merger of a binary system. We constrain parameters and the evolutionary status of the stars before the merger, as well as the nature of the physical processes that occurred during the merger event. We start with constraining the primary component by identifying the star that was responsible for the principal characteristics of the observed chemical composition of CK Vul.
3.1. The nature of the progenitor primary
The low luminosity of CK Vul, of namely 20 L⊙ < L < 100 L⊙ (see Sect. 2.4), indicates that the central object is not a massive star. Stars more massive than ∼3 M⊙ are more luminous than 100 L⊙ at any evolutionary stage (Iben 1985; Karakas & Lattanzio 2014), and so this mass can be taken as an upper limit on the mass of the primary (and the secondary) of the progenitor binary. We can also exclude an AGB star of any mass as the primary (or secondary) of the progenitor. The dense CO core would have easily survived a merger with almost any other star and the remnant would now be at least as luminous as the progenitor; that is > 103 L⊙.
The observed abundances in CK Vul (overabundance of helium and nitrogen, underabundance of oxygen; see Table 1) evidently show that some part of the observed matter has been processed in the CNO cycles of H burning. This and the presence of 26Al strongly favor the RGB phase of the progenitor primary (if a massive or AGB star is excluded; see above). Moreover, the abundance of 26Al shows that it had to be an evolutionarily advanced RGB star, because the isotope of 26Al is effectively produced in low-mass RGB stars only when the He-core mass is ≳0.2 M⊙.
The only way to obtain 26Al is to activate the MgAl chain, which includes the 25Mg(p, γ)26Al reaction. This takes place when the burning temperature exceeds 3.0 × 10⁷ K (e.g., Arnould et al. 1999). 25Mg is then converted to 26Al in the H-burning shell. 26Al is unstable and decays through 26Al(β+)26Mg on a (e-folding) timescale of τβ+ = 1.03 × 10⁶ yr (Auer et al. 2009).
We can estimate the luminosity of the presumed RGB star from the observed mass of 26Al. The luminosity of an RGB star, L, is related to the rate of hydrogen burning in the star, ζ(H), through
where ϵCNO is the energy obtained from burning a unit mass of hydrogen in the CNO cycles (ϵCNO = 6.0 × 10¹⁸ erg g−1).
Let us assume that all 25Mg existing in the unprocessed matter is converted to 26Al in the H-burning shell. The rate of this process is related to the speed of the hydrogen burning, and so we can write
where X(25Mg) and X(H) are the mass fractions of 25Mg and H, respectively, prior to the H burning. Let us further assume that the distribution of 26Al in the He core is governed by the production of this isotope in the H-burning shell and its subsequent β+ decay in the core. The rate of production of 26Al, ξ(26Al), is equal to the rate of destruction of 25Mg, ζ(25Mg). Then the total mass of 26Al in the core, M(26Al), is given by
After a simple transformation of the above formulae, we get
Assuming that the initial abundance of magnesium in the CK Vul progenitor was three times lower than that in the Sun, and that 10% of it was in the form of 25Mg (as in the Sun; see Asplund et al. 2009), we get X(H)/X(25Mg) = 3.0 × 10⁴. The above formula can then be rewritten as
Substituting the upper and lower limits on the observed mass of 26Al derived in Sect. 2.6 – that is 3.5 × 10⁻⁸ M⊙ < M(26Al) < 1.85 × 10⁻⁶ M⊙ – in the above formula, we obtain limits on the luminosity of the CK Vul progenitor, namely

These are fairly consistent with the values expected for low-mass stars in an advanced RGB phase, that is, those with a He-core mass of 0.3–0.45 M⊙ and a corresponding luminosity of 100–2000 L⊙ (cf. Spada et al. 2017; Hidalgo et al. 2018).
The lack of optical detection of the very highly dust-embedded product of the merger can also be used to infer the properties of the progenitor. MacLeod et al. (2022) considered dust condensation in systems undergoing a merger and found relations between accumulated dusty material and the “compactness” of the primary progenitor, or, more precisely, between the circumstellar extinction in the orbital plane, parametrized by AV, and the mass and radius of the progenitor. Using their relation, we can constrain AV in CK Vul. In R-band observations of the field of CK Vul of Hajduk et al. (2013), the weakest detected stars have ∼22.5 mag. Adopting again the interstellar extinction of AR ≈ AV = 2.8 mag, we take 25.3 mag as a lower limit on the R-band magnitude of the star. Then, to hide any star with a luminosity of > 20 L⊙ (Sect. 2.4), the dusty torus surrounding CK Vul should cause reddening with AV ≳ 11 mag. In this derivation, we considered stellar colors and absolute magnitudes of giants, red supergiants, and main sequence stars of intermediate spectral types. Reinstating our argument from the beginning of this section, namely that the progenitor had to be of a mass lower than ∼3 M⊙, we find from MacLeod et al. (2022) that to form a thick torus with AV ≳ 11 mag, the primary progenitor had to be large, with a radius consistent – for a given mass – with an RGB phase; for instance, we get a radius of > 40 R⊙ for a 1 M⊙ star. We conclude that the primary component of the CK Vul progenitor binary was most probably a low-mass (initial mass of ∼1–2 M⊙) star in the RGB phase.
3.2. Simulation of the observed abundances
The abundances in CK Vul in Table 1 suggest that we observe the dispersed matter that was dredged up from the outer layers of the He core of the RGB primary and that was mixed with the unprocessed matter from the envelope. In order to explore likelihood of this scenario, we performed simple simulations. Using Tycho-6.0 (Young et al. 2001; Arnett 2013) and MESA (Modules for Experiments in Stellar Astrophysics; release 21.12.1 Paxton et al. 2011, 2013, 2015, 2018, 2019; Jermyn et al. 2023), we followed the evolution of a 1.0 M⊙ star up to the tip of the RGB2. Solar abundances (Asplund et al. 2009) were adopted in the initial model, but elements heavier than He were depleted by a factor of 3 in Tycho ([Fe/H]= − 0.5); equivalently, Z = 0.004 was adopted in MESA. We then took the stellar model at the time when its He core had a mass of 0.40 M⊙ and mixed the outer 0.1 M⊙ region of the He core with the unprocessed envelope material. The mixed abundances were compared to those of CK Vul. We tried to obtain the best fit by changing the fraction of the He-core material in the final mixture, fHe. The mass fractions of the elements whose abundances were determined from the observations, that is, H, He, N, O, and Ne (those of S and Ar remain unchanged in the H-burning processes), were taken into account in the fitting procedure in which we searched for the lowest sum of relative squared deviations between the simulated (Xn, sim) and observed (Xn, obs) abundances, that is,
The best fit was obtained for fHe = 0.40 using both Tycho and MESA abundances. The results are compared in Table 2. Except for F, which was not considered in the fit, the elemental abundances are fairly consistent between the two evolution packages used.
Simulated elemental abundances and isotopic ratios (see text) compared to ones observed in CK Vul.
As can be seen from Table 2, the abundances of the five considered elements are reproduced quite well in our simulations. (To save time, S, Ar, and Al abundances were not considered in MESA). The relative mixed abundances of the CNO elements and the 27Al/26Al ratio are also relatively well reproduced, especially by Tycho calculations. This was achieved by adjusting only one parameter. The success of this simple model can be regarded as a strong argument in favor of our hypothesis that the matter observed in CK Vul comes from the He core and the H-rich envelope of an advanced RGB star.
There are, however, inconsistencies between the model results and the observed values. Of primary concern are the isotopic ratios of the CNO elements, especially if MESA results are considered, because MESA predicts much lower abundances of 17O and higher 15N than Tycho. Also, the abundances of C, F, and Ne are slightly below the observed values3. Clearly, some part of the observed matter had to also be processed in nuclear reactions other than just the equilibrium H burning. We discuss this point further in Sect. 3.4.
3.3. The nature of the progenitor secondary
Within our hypothesis, the required mixing of the matter from the He core with that from the H-rich envelope is caused by the merger of two stars. In other words, the merger event has to disrupt a large portion of the He core. In order for this to happen, the secondary has to have a core that is at least as dense as that of the primary. This rules out a main sequence (MS) star as the secondary. At the base of the layer rich in 26Al, the density of the RGB He core is two orders of magnitude higher than that in the center of the lowest-mass MS stars (e.g., Iben 1974). Therefore, the He core of an advanced RGB star would survive the merger with a low-mass MS star, remaining almost intact. Consequently, any dredge up of matter from within the He core would be impossible. Moreover, the remnant of such an MS–RGB merger would remain an RGB star with a luminosity of 102 − 103 L⊙, which is significantly higher than that of CK Vul.
Instead, a helium white dwarf (HeWD) would meet the observational requirements as the secondary of the binary progenitor of CK Vul. A HeWD can be significantly more compact than an RGB He core of a similar mass (e.g., Hall & Tout 2014). In other words, a He WD can be even several times denser than the RGB core (e.g., Iben 1974). Therefore, in the case of a merger of an RGB star with a HeWD, the He RGB core would become disrupted and would finally form a He-rich envelope around the WD. Originally the He core was surrounded by a H-rich envelope, and so it is very likely that the matter from the outer layers of the He core would be mixed with that from the H envelope (for a fuller discussion of the possible scenarios, see Zhang & Jeffery 2013). The merger event releases a lot of energy, and therefore some part of the mixed matter would gain enough energy to be dispersed around the system (e.g., Piersanti et al. 2010). After a certain time, it could be observed as a dusty and molecular circumstellar envelope of the remnant. The proposed concepts are schematically illustrated in Fig. 2.
The existence of a HeWD in the progenitor binary indicates that the two stars interacted in the past. It is therefore consistent with the progenitor being a close system prone to instabilities that could lead to a merger. Independently, Kamiński et al. (2021) speculated that the merger binary had a companion, one that is now interacting with the merger ejecta. If confirmed, this would make CK Vul progenitor a triple star.
3.4. Nuclear burning during the merger
The merger of an RGB star with a HeWD can also explain the inconsistencies between our modeling and the observations summarized in Table 2, that is, the low values of the observed isotopic ratios of the CNO elements and enhanced abundances of C, F, and Ne.
Let us consider the 16O/18O ratio, which is unexpectedly low in CK Vul. The only way to produce a significant amount 18O is to activate He burning. Also, 14N, which is the second-most abundant isotope after 4He in the matter that has been processed in the CNO cycles, is converted to 18O through 14N(α,γ)18F(β+)18O. However, at the end of He burning, 18O is converted to 22Ne (see Fig. 10 in Arnould et al. 1999). Therefore, an enhanced abundance of 18O can be taken as evidence of partial He burning (e.g., Clayton et al. 2007).
Helium burning generally requires temperatures above ∼1.0 × 10⁸ K. Mergers of a HeWD with an RGB He core can reach this temperature (Zhang & Jeffery 2013). Objects of this kind and of a mass of 0.3–0.4 M⊙, when approaching each other, attain orbital velocities of ∼2000 km s−1. Parcels of He-rich matter, when colliding at these velocities, may attain temperatures of up to ∼2.0 × 10⁸ K. Following models of mergers of a HeWD with a CO WD (e.g., Longland et al. 2011; Staff et al. 2012), we can therefore expect in our case that after disruption of the RGB He core, a short-lived, hot He-rich layer is formed above the HeWD, whereby partial He burning can occur and 18O can be effectively produced. Once He burning is activated, we can also expect increased abundances of 12C, 19F, and 22Ne (see e.g., Figs. 10 and 11 in Arnould et al. 1999). This is therefore a viable scenario to explain the observed overabundance of C, F, and Ne in Table 2. The case of CK Vul is a strong observational hint that at least some HeWD–RGB mergers activate He burning, despite earlier controversies on this topic (see Piersanti et al. 2010, and references therein).
Stellar mergers are accompanied by strong mixing processes. In this way, matter from stellar interiors can be observed in the outermost regions of the merger product. In our case, it can also be expected that parcels of H-rich gas from the RGB envelope are admixed to the hot He-rich matter. This would activate, perhaps for a short time, the initial reactions of the CNO cycles, leading to an enhancement of 13C, and possibly of 17O, in the merger remnant. The enhanced abundance of 18O in the He-rich matter (after having suffered partial He burning) would also allow production of 15N via 18O(p,α)15N.
3.5. Contribution of He-burning to the energetics
As mentioned in Sect. 2.5, the C/O number ratio is probably close to one in CK Vul, which gives a C mass fraction of ∼7 × 10⁻⁴ (see Table 1). The simple model presented in Sect. 3.2 is not able to meet this value (see Table 2). However, within our hypothesis of partial He burning, we can get additional carbon. Converting ∼4 × 10⁻⁴ of the observed helium to carbon would be enough to get the desired C abundance. Burning ∼1 × 1029 g (5 × 10⁻⁴ M⊙) of helium would output energy of 6 × 1046 erg. This is ∼12% of the observed energy released by Nova 1670 (see Sect. 2.4). Only a rather small fraction of this He-burning energy would contribute to the observed radiative luminosity. Most of it would probably be released in various forms of mechanical energy (overcoming the gravitational potential, kinetic energy of the outflowing matter, low- and large-scale turbulent motions, etc.).
3.6. Kinematics of the merger outflow
The merger of an RGB star with a WD explains not only the observed elemental abundances and the isotopic ratios but also the wide range of the observed outflow velocities; that is, from ∼50 km s−1 in the compact equatorial region up to ∼1700 km s−1 in the tips of the optical hourglass (see Sect. 2.3 and Fig. 1). At the beginning of the merger, when the WD and the RGB core spiral in the extended common envelope, the matter is lost mainly in the orbital plane with velocities characteristic of winds from red giants – that is, of a few tens of km s−1. This creates a dense equatorial belt of slowly expanding matter. At the final merger, when the WD coalesces with the He core, the matter is lost with velocities comparable to the escape velocity of a WD – of namely a few thousand km s−1. However, this fast outflow is blocked in the equatorial directions by the dense slow-moving belt of the previously lost matter. In the polar directions, the fast outflow expands relatively freely. In the above scenario, the bipolar lobes should be more enriched in nuclear ashes than the equatorial belt. This is observed in the remnant of CK Vul; for instance, C/O and N/O are enhanced in the lobes (Sect. 2.5).
3.7. Luminosity of the remnant
At present, 350 years after the merger, the remnant of CK Vul is likely to have a dense He core (the former HeWD) in its center, surrounded by an extended He-rich layer (the former He core of the RGB primary) and an outer H-rich envelope (part of the former H-rich envelope of the primary). The structure is schematically illustrated in Fig. 2. It is easy to show that such an object should be almost devoid of nuclear power sources. The He core is of insufficient mass to ignite He in its center. The base of the H-rich envelope, situated above the extended He layer, is most probably insufficiently hot and dense to start H burning. This explains the low present-day luminosity of CK Vul (< 100 L⊙).
4. Discussion
In the previous section, we come to the conclusion that the merger of an RGB giant and a HeWD can consistently account for the main observational data obtained for CK Vul. This scenario allows us to explain and understand the observed elemental abundances, the isotopic ratios, the kinematics in the nebula, and the low luminosity of the object in the contemporary epochs.
Alternatively, however, a merger of two RGB stars could also account for the observational characteristics of CK Vul. The main difference is that, in the case of a double RGB merger, 26Al would come from disrupted outer layers of the more massive He core and a major body of this core would survive the merger and form a core of the remnant. However, we consider this scenario as less probable than the RGB–HeWD merger, because it would imply that the binary components were of almost equal mass at the zero age main sequence (ZAMS). Our Tycho-6 modeling shows that the difference in mass between the components should be ≲3% in order to satisfy the condition that the less massive star enters the RGB phase before the more massive one leaves it (see also Segev et al. 2019). Albeit unlikely, the case of a double RGB star merger cannot be excluded; all the more that a collision of two RGB stars would probably more likely result in the merger of the two cores than the merger of an RGB core with a HeWD. This is because the common envelope resulting from two RGB envelopes is expected to be more massive than that from a HeWD and a red giant.
It is interesting and instructive to note that our preferred scenario of a merger of a HeWD with an RGB star has been proposed to explain the origin of J- and early R-type stars (e.g., Izzard et al. 2007; Zhang & Jeffery 2013; Zhang et al. 2020). These are special types of carbon stars (Dominy 1984; Abia & Isern 2000; Zamora 2009), with enhanced nitrogen and lithium, a low 12C/13C ratio, solar O abundances, solar or slightly subsolar metallicities, and no s-element enrichment. Most probably, they are single stars (McClure 1997). The early R-type stars have magnitudes similar to those of red clump stars, which suggests they are in the core He-burning phase; J-type stars are even brighter.
It is tempting to ask whether CK Vul is evolving toward an early R-type star. The answer is not straightforward. In mergers between HeWDs and RGB stars considered by Zhang et al. (2020), simulations show that carbon stars are produced only for high-mass (≳0.45 M⊙) WDs and at metallicities higher than that adopted for the CK Vul progenitor in the present study. Whether or not the CK Vul remnant is becoming a He-burning carbon star, similar to early R-type stars, will become more clear when the nebula, especially its dense equatorial waist, disperses and the central star becomes visible. Meanwhile, the low luminosity of CK Vul appears to be in favor of it becoming an R-type star. Its presumable structure, outlined in Sect. 3.7, is very likely to evolve toward the core He-burning phase. The N overabundance in the nebula is also in favor of this outcome, as is the low 12C/13C ratio. The observational indications that C/O ≃ 1 in the molecular lobes and C/O < 1 in the central dense waist may suggest that the star is going to become, or perhaps already is, a carbon star (C/O > 1). As mentioned in Sect. 2.5, lithium appears to be overabundant in the outflow of CK Vul (see also discussion in Kamiński et al. 2023), which is also in line with early-R star characteristics. The only observational results that make CK Vul appear different from the early R-type stars are the abundances of oxygen and heavier elements. While R-type stars usually show roughly solar O abundances and metallicities (Dominy 1984; Zamora 2009), in CK Vul, oxygen and heavier elements are significantly underabundant. Regarding oxygen, we may note that observational determination of O abundance is difficult in carbon stars, and this latter is often estimated from scaling with the metallicity (e.g., Zamora 2009). Nevertheless, in a sample of five early R-type stars for which Dominy (1984) were able to reliably estimate the O abundance, there is one star, HD 100764, with both parameters close to those found for CK Vul, that is, [O]≃ − 0.53 and [Fe]≃ − 0.59 (versus [O]≃ − 0.60 and [Fe]≃ − 0.31 in CK Vul). In conclusion, it is very likely that the historical Nova 1670 resulted from a merger of a HeWD and an RGB star, and that its remnant, CK Vul, is now evolving toward becoming an early R-type star.
The MESA inlist file is available under DOI https://doi.org/10.5281/zenodo.10027069 and https://doi.org/10.5281/zenodo.10027069
When the paper was already in the production office, we run another simulation using a more recent version of MESA (r23.05.1 and x86_64-linux-23.7.3) with a larger network of nuclear reactions from Brinkman et al. (2023), and evolved the star from the pre-MS phase. The model setup and results of mixing calculations are presented in https://doi.org/10.5281/zenodo.10728756. This model predicts abundances which are more in line with the Tycho results, especially for F. In the setup, the mixed ratio of 27Al/26Al is a few times higher than observed, but a good agreement with CK Vul can be obtained by considering a smaller mass of the disrupted core.
Acknowledgments
T.K. acknowledges funding from grant SONATA BIS no 2018/30/E/ST9/00398 from the Polish National Science Center. R.S. acknowledges support from the Polish National Science Center grant SONATA BIS 2018/30/E/ST9/00598. We thank H. Brinkman for instructions on using MESA.
References
- Abia, C., & Isern, J. 2000, ApJ, 536, 438 [NASA ADS] [CrossRef] [Google Scholar]
- Arnett, D. 2013, Astrophysics Source Code Library [record ascl:1303.008] [Google Scholar]
- Arnould, M., Goriely, S., & Jorissen, A. 1999, A&A, 347, 572 [NASA ADS] [Google Scholar]
- Asplund, M., Grevesse, N., Sauval, A. J., & Scott, P. 2009, ARA&A, 47, 481 [NASA ADS] [CrossRef] [Google Scholar]
- Auer, M., Wagenbach, D., Wild, E. M., et al. 2009, Earth Planet. Sci. Lett., 287, 453 [CrossRef] [Google Scholar]
- Banerjee, D. P. K., Geballe, T. R., Evans, A., et al. 2020, ApJ, 904, L23 [NASA ADS] [CrossRef] [Google Scholar]
- Blöcker, T. 1995, A&A, 299, 755 [Google Scholar]
- Brinkman, H. E., Doherty, C., Pignatari, M., et al. 2023, ApJ, 951, 110 [CrossRef] [Google Scholar]
- Clayton, G. C., Geballe, T. R., Herwig, F., et al. 2007, ApJ, 662, 1220 [NASA ADS] [CrossRef] [Google Scholar]
- Crause, L. A., Lawson, W. A., Kilkenny, D., et al. 2003, MNRAS, 341, 785 [NASA ADS] [CrossRef] [Google Scholar]
- De Marco, O., Passy, J. C., Moe, M., et al. 2011, MNRAS, 411, 2277 [CrossRef] [Google Scholar]
- Dominy, J. F. 1984, ApJS, 55, 27 [NASA ADS] [CrossRef] [Google Scholar]
- Evans, A., van Loon, J. Th., Zijlstra, A. A., et al. 2002, MNRAS, 332, L35 [NASA ADS] [CrossRef] [Google Scholar]
- Eyres, S. P. S., Evans, A., Zijlstra, A., et al. 2018, MNRAS, 481, 4931 [NASA ADS] [Google Scholar]
- Hajduk, M., Zijlstra, A. A., van Hoof, P. A. M., et al. 2007, MNRAS, 378, 1298 [CrossRef] [Google Scholar]
- Hajduk, M., van Hoof, P. A. M., & Zijlstra, A. A. 2013, MNRAS, 432, 167 [NASA ADS] [CrossRef] [Google Scholar]
- Hall, P. D., & Tout, C. A. 2014, MNRAS, 444, 3209 [NASA ADS] [CrossRef] [Google Scholar]
- Harrison, T. E. 1996, PASP, 108, 1112 [NASA ADS] [CrossRef] [Google Scholar]
- Hidalgo, S. L., Pietrinferni, A., Cassisi, S., et al. 2018, ApJ, 856, 125 [Google Scholar]
- Iben, I. 1974, ARA&A, 12, 215 [NASA ADS] [CrossRef] [Google Scholar]
- Iben, I. 1985, QJRAS, 26, 1 [NASA ADS] [Google Scholar]
- Izzard, R. G., Jeffery, C. S., & Lattanzio, J. 2007, A&A, 470, 661 [NASA ADS] [CrossRef] [EDP Sciences] [Google Scholar]
- Jermyn, A. S., Bauer, E. B., Schwab, J., et al. 2023, ApJS, 265, 15 [NASA ADS] [CrossRef] [Google Scholar]
- Kamiński, T., Menten, K. M., Tylenda, R., et al. 2015, Nature, 520, 322 [CrossRef] [Google Scholar]
- Kamiński, T., Menten, K. M., Tylenda, R., et al. 2017, A&A, 607, A78 [NASA ADS] [CrossRef] [EDP Sciences] [Google Scholar]
- Kamiński, T., Tylenda, R., Menten, K. M., et al. 2018a, Nat. Astron., 2, 778 [CrossRef] [Google Scholar]
- Kamiński, T., Steffen, W., Tylenda, R., et al. 2018b, A&A, 617, A129 [NASA ADS] [CrossRef] [EDP Sciences] [Google Scholar]
- Kamiński, T., Menten, K. M., Tylenda, R., et al. 2020, A&A, 644, A59 [NASA ADS] [CrossRef] [EDP Sciences] [Google Scholar]
- Kamiński, T., Steffen, W., Bujarrabal, V., et al. 2021, A&A, 646, A1 [NASA ADS] [CrossRef] [EDP Sciences] [Google Scholar]
- Kamiński, T., Mazurek, H. J., Menten, K. M., et al. 2022, A&A, 659, A109 [NASA ADS] [CrossRef] [EDP Sciences] [Google Scholar]
- Kamiński, T., Schmidt, M., Hajduk, M., et al. 2023, A&A, 672, A196 [NASA ADS] [CrossRef] [EDP Sciences] [Google Scholar]
- Karakas, A. I., & Lattanzio, J. C. 2014, PASA, 31, e030 [NASA ADS] [CrossRef] [Google Scholar]
- Kato, T. 2003, A&A, 399, 695 [NASA ADS] [CrossRef] [EDP Sciences] [Google Scholar]
- Kimeswenger, S., Lederle, C., Schmeja, S., & Armsdorfer, B. 2002, MNRAS, 336, L43 [NASA ADS] [CrossRef] [Google Scholar]
- Longland, R., Lorén-Aguilar, P., José, J., et al. 2011, ApJ, 737, L34 [NASA ADS] [CrossRef] [Google Scholar]
- MacLeod, M., De, K., & Loeb, A. 2022, ApJ, 937, 96 [NASA ADS] [CrossRef] [Google Scholar]
- McClure, R. D. 1997, PASP, 109, 256 [NASA ADS] [CrossRef] [Google Scholar]
- Miller Bertolami, M. M. 2016, A&A, 588, A25 [NASA ADS] [CrossRef] [EDP Sciences] [Google Scholar]
- Munari, U., Henden, A., Kiyota, S., et al. 2002, A&A, 389, L51 [NASA ADS] [CrossRef] [EDP Sciences] [Google Scholar]
- Naylor, T., Charles, P. A., Mukai, K., & Evans, A. 1992, MNRAS, 258, 449 [NASA ADS] [CrossRef] [Google Scholar]
- Nelemans, G., Verbunt, F., Yungelson, L. R., & Protegies Zwart, S. F. 2000, A&A, 360, 1011 [NASA ADS] [Google Scholar]
- Paxton, B., Bildsten, L., Dotter, A., et al. 2011, ApJS, 192, 3 [Google Scholar]
- Paxton, B., Cantiello, M., Arras, P., et al. 2013, ApJS, 208, 4 [Google Scholar]
- Paxton, B., Marchant, P., Schwab, J., et al. 2015, ApJS, 220, 15 [Google Scholar]
- Paxton, B., Schwab, J., Bauer, E. B., et al. 2018, ApJS, 234, 34 [NASA ADS] [CrossRef] [Google Scholar]
- Paxton, B., Smolec, R., Schwab, J., et al. 2019, ApJS, 243, 10 [Google Scholar]
- Piersanti, L., Cabezón, R. M., Zamora, O., et al. 2010, A&A, 522, A80 [NASA ADS] [CrossRef] [EDP Sciences] [Google Scholar]
- Segev, R., Sabach, E., & Soker, N. 2019, ApJ, 884, 58 [NASA ADS] [CrossRef] [Google Scholar]
- Shara, M. M., Moffat, A. F. J., & Webbink, R. F. 1985, ApJ, 294, 271 [NASA ADS] [CrossRef] [Google Scholar]
- Soker, N., & Tylenda, R. 2003, ApJ, 582, L105 [NASA ADS] [CrossRef] [Google Scholar]
- Spada, F., Demarque, P., Kim, Y.-C., et al. 2017, ApJ, 838, 161 [NASA ADS] [CrossRef] [Google Scholar]
- Sparks, W. B., Bond, H. E., Cracraft, M., et al. 2008, AJ, 135, 605 [NASA ADS] [CrossRef] [Google Scholar]
- Staff, J. E., Menon, A., Herwig, F., et al. 2012, ApJ, 757, 76 [Google Scholar]
- Tylenda, R., & Soker, N. 2006, A&A, 451, 223 [NASA ADS] [CrossRef] [EDP Sciences] [Google Scholar]
- Tylenda, R., Hajduk, M., Kamiński, T., et al. 2011, A&A, 528, A114 [NASA ADS] [CrossRef] [EDP Sciences] [Google Scholar]
- Tylenda, R., Kamiński, T., Udalski, A., et al. 2013, A&A, 555, A16 [NASA ADS] [CrossRef] [EDP Sciences] [Google Scholar]
- Tylenda, R., Kamiński, T., & Mehner, A. 2019, A&A, 628, A124 [NASA ADS] [CrossRef] [EDP Sciences] [Google Scholar]
- Young, P. A., Mamajek, E. E., Arnett, D., & Liebert, J. 2001, ApJ, 556, 230 [NASA ADS] [CrossRef] [Google Scholar]
- Zamora, O., Abia, C., Plez, B., et al. 2009, A&A, 508, 909 [NASA ADS] [CrossRef] [EDP Sciences] [Google Scholar]
- Zhang, X., & Jeffery, C. S. 2013, MNRAS, 430, 2113 [NASA ADS] [CrossRef] [Google Scholar]
- Zhang, X., Jeffery, C. S., Li, Y., & Bi, S. 2020, ApJ, 889, 33 [NASA ADS] [CrossRef] [Google Scholar]
All Tables
Simulated elemental abundances and isotopic ratios (see text) compared to ones observed in CK Vul.
All Figures
|
Fig. 1. Components of the nebula surrounding CK Vul. (a) Optical hourglass nebula (orange and white) seen in the combined emission of Hα and [N II] lines (from Hajduk et al. 2013). Millimeter-wave emission of CO 1–0 is overlaid in cyan (from Kamiński et al. 2020). Green markers and labels show the characteristic velocities of these components. (b) Zoomed-in central portion of the components shown in (a). The structure of the optical nebula is seen more clearly. The red ellipse indicates the central region where many O-bearing molecules and strong dust emission are observed. The gray rectangle shows the region within the northern optical “jet” observed spectrally in the optical–near-infrared with X-shooter at a very high sensitivity (Tylenda et al. 2019). (c) The inset shows dispersed emission of a spectral line within the northern jet and illustrates that the emission is composed of at least three distinct morpho-kinematical components. (d) Combined emission of SiO (green), N2H+ (blue), and mm-wave continuum define the molecular nebula (from Kamiński et al. 2020). The central region, bright in dust emission, is marked with a red ellipse. |
| In the text | |
|
Fig. 2. Schematic illustration of the proposed scenario of a merger between an RGB star with a HeWD, and of its product. The relative sizes of the internal substructures of the stars are not to scale. Pink regions show H-rich matter; dark green represents He-rich gas; light green shows the thin 26Al layer; and blue depicts the He core of the WD. |
| In the text | |
Current usage metrics show cumulative count of Article Views (full-text article views including HTML views, PDF and ePub downloads, according to the available data) and Abstracts Views on Vision4Press platform.
Data correspond to usage on the plateform after 2015. The current usage metrics is available 48-96 hours after online publication and is updated daily on week days.
Initial download of the metrics may take a while.