| Issue |
A&A
Volume 658, February 2022
|
|
|---|---|---|
| Article Number | L11 | |
| Number of page(s) | 6 | |
| Section | Letters to the Editor | |
| DOI | https://doi.org/10.1051/0004-6361/202243149 | |
| Published online | 18 February 2022 | |
Letter to the Editor
Strong Lyman continuum emitting galaxies show intense C IV λ1550 emission
1
Observatoire de Genève, Université de Genève, Chemin Pegasi 51, 1290 Versoix, Switzerland
e-mail: This email address is being protected from spambots. You need JavaScript enabled to view it.
2
CNRS, IRAP, 14 Avenue E. Belin, 31400 Toulouse, France
3
Bogolyubov Institute for Theoretical Physics, National Academy of Sciences of Ukraine, 14-b Metrolohichna Str., Kyiv 03143, Ukraine
4
Institut für Physik und Astronomie, Universität Potsdam, Karl-Liebknecht-Str. 24/25, 14476 Potsdam, Germany
5
Department of Astronomy, University of Texas at Austin, Austin, TX 78712, USA
6
Department of Astronomy, Williams College, Williamstown, MA 01267, USA
7
National Astronomical Observatory of Japan, 2-21-1 Osawa, Mitaka, Tokyo 181-8588, Japan
8
Space Telescope Science Institute, 3700 San Martin Drive, Baltimore, MD 21218, USA
9
Astronomy Department, University of Virginia, PO Box 400325 Charlottesville, VA 22904-4325, USA
Received:
18
January
2022
Accepted:
7
February
2022
Abstract
Using the Space Telescope Imaging Spectrograph, we have obtained ultraviolet spectra from ∼1200 to 2000 Å of known Lyman continuum (LyC) emitting galaxies at low redshift (z ∼ 0.3 − 0.4) with varying absolute LyC escape fractions (fesc ∼ 0.01 − 0.72). Our observations include in particular the galaxy J1243+4646, which has the highest known LyC escape fraction at low redshift. While all galaxies are known Lyman alpha emitters, we consistently detect an inventory of additional emission lines, including C IV λ1550, He II λ1640, O III] λ1666, and C III] λ1909, whose origin is presumably essentially nebular. C IV λ1550 emission is detected above 4σ in six out of eight galaxies, with equivalent widths of EW(C IV) = 12 − 15 Å for two galaxies, which exceeds the previously reported maximum emission in low-z star-forming galaxies. We detect C IV λ1550 emission in all LyC emitters with escape fractions fesc > 0.1 and find a tentative increase in the flux ratio C IV λ1550/C III] λ1909 with fesc. Based on the data, we propose a new criterion to select and classify strong leakers (galaxies with fesc > 0.1): C IV λ1550/C III] λ1909 ≳ 0.75. Finally, we also find He II λ1640 emission in all the strong leakers with equivalent widths from 3 to 8 Å rest frame. These are among the highest values observed in star-forming galaxies and are primarily due to a high rate of ionizing photon production. The nebular He II λ1640 emission of the strong LyC emitters does not require harder ionizing spectra at > 54 eV compared to those of typical star-forming galaxies at similarly low metallicity.
Key words: galaxies: starburst / galaxies: high-redshift / dark ages, reionization / first stars / ultraviolet: galaxies
© ESO 2022
1. Introduction
In recent years, Hubble Space Telescope (HST) observations of star-forming galaxies at low redshift (z ∼ 0.3 − 0.4) with the Cosmic Origin Spectrograph (COS) have measured Lyman continuum (LyC) and the non-ionizing ultraviolet (UV) radiation for nearly 90 galaxies in total, as reported by various studies (see Leitherer et al. 2016; Izotov et al. 2016a,b, 2018a; Izotov et al. 2021; Wang et al. 2019) and the Low-z Lyman Continuum Survey (LzLCS; Wang et al. 2021; Flury et al. 2022a,b; Saldana-Lopez et al. 2022).
These data have launched us into a new era, allowing us to study in detail LyC emitting galaxies, their interstellar medium (ISM) properties and stellar populations, the conditions that favor the escape of ionizing photons from galaxies, and more (see above references and Schaerer et al. 2016; Gazagnes et al. 2018; Chisholm et al. 2018). In addition, these observations have served to empirically establish “indirect indicators” of LyC escape, which can potentially be used at all redshifts, including for galaxies in the epoch of reionization, where direct observations of the LyC are not possible. Among these indirect indicators are properties of the resolved Lyman alpha (Lyα) line profile (the peak separation), weak UV absorption lines, Mg II emission, a high ratio of [O III] λλ4959,5007/[O II] λ3727, and a deficit of the [S II] λλ6717,6731 line (see Jaskot & Oey 2013; Verhamme et al. 2017; Gazagnes et al. 2018; Henry et al. 2018; Chisholm et al. 2020; Ramambason et al. 2020; Wang et al. 2021).
For the exploration of the early Universe and to track the sources of cosmic reionization, the rest-UV spectral range remains fundamental as it is accessible with the largest ground-based telescopes (and soon with 30 m class telescopes) and with the recently launched James Webb Space Telescope. Recent efforts have been undertaken to obtain reference spectra of low-redshift star-forming galaxies covering the range of ∼1200 − 2000 Å (e.g., Rigby et al. 2015; Berg et al. 2016, 2019a; Senchyna et al. 2017). These include Lyα, C IV λ1550, He II λ1640, O III] λλ1660,1666, C III] λλ1907,1909, and other emission lines, which provide important diagnostics of their ISM and radiation field (see, e.g., Feltre et al. 2016; Gutkin et al. 2016; Nakajima et al. 2018). However, to study sources of reionization and to relate the UV line properties to LyC escape, it is mandatory to observe the same galaxies both in the LyC and in the non-ionizing UV out to ∼2000 Å. So far, very few such observations have been obtained, and the first spectrum of a low-z LyC emitter with a high escape fraction of LyC photons (fesc ∼ 43%) has been obtained only recently (Schaerer et al. 2018).
Here, we present the first results of an HST program to observe the UV emission lines of known LyC emitters, sampling a range of LyC escape fractions from very low (fesc = 1.4%) to the highest escape currently known (fesc = 72%), which was observed in the compact star-forming galaxy J1243+4646 by Izotov et al. (2018a). Our observations show strong emission lines, in particular strong C IV λ1550 emission in the strongest LyC emitters. This demonstrates for the first time a connection between LyC escape and nebular C IV emission, from which we propose a new empirical criterion to select galaxies with strong LyC escape. Furthermore, our results shed new light on the recently detected C IV emitters at high redshift (see Stark et al. 2015; Mainali et al. 2017; Schmidt et al. 2017; Tang et al. 2021; Vanzella et al. 2021; Richard et al. 2021), suggesting that some of them could be strong LyC emitters.
2. UV spectra of compact star-forming galaxies at z ∼ 0.3−0.4 with varying LyC escape fractions
2.1. HST observations
Eight out of eleven compact star-forming galaxies with LyC measurements from our 2016–2018 campaign (Izotov et al. 2016a,b, 2018a; Izotov et al. 2018b) have been observed in Cycle 27 (GO 15941; P.I. Schaerer) and earlier (Schaerer et al. 2018)1. The sources span a broad range of LyC escape fractions (fesc ∼ 1.4 − 72%), metallicities in the range 12 + log(O/H)=7.64 − 8.16 with a median of 7.92, and [O III]λ5007/[O II] λ3727 from 5 to 27.1.
The observations were taken with the Space Telescope Imaging Spectrograph (STIS) NUV-MAMA using the grating G230L with the central wavelength 2376 Å and the slit  , resulting in a spectral resolution of R ∼ 700 for the targeted compact galaxies. The data were reduced with the CALSTIS v3.4.2 pipeline and including data from additional observations of J1154+2443 that were not available to Schaerer et al. (2018), which improved the signal-to-noise ratio (S/N) to ≃7 per pixel for this galaxy. Wavelength shifts between sub-exposures were insignificant, which allowed for the co-addition of gross and background counts per pixel, approximately preserving Poisson statistics. In the wavelength range of interest, the continuum S/N (accounting for Poisson flux uncertainties) ranges between 3 and 8 per ≃1.55 Å pixel, with six out of eight spectra reaching S/N > 5.
For the remainder of this Letter, we define “strong” leakers as galaxies with a LyC escape fraction above 10% (i.e., fesc > 0.1) to distinguish such sources, which could significantly contribute to cosmic reionization, from those with a low or negligible escape of ionizing photons. In our current sample, three out of eight galaxies are classified as strong leakers.
2.2. Main UV emission line features
Examples of the observed STIS spectra are shown in Fig. 1, ordered – from top to bottom – by decreasing LyC escape fraction. The top two sources shown there have very high escape fractions. In the spectral range covered by the observations (rest-frame wavelengths of ∼1200 − 2000 Å), the main detected emission lines are Lyα (not illustrated here), C IV λ1550, He II λ1640, O III] λ1666, and C III] λ1909. We note that with the given resolution, the C IV λ1550 and C III] λ1909 doublets are not resolved. Hints of blended Si III] λ1883,1892 are also visible in some of the spectra (see Fig. 1).
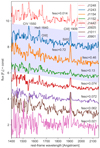 |
Fig. 1. STIS rest-frame spectra of eight z ∼ 0.3 − 0.4 LyC emitters. They are ordered by decreasing fesc from top to bottom, except for J1248+4259, which is shown at the top with a dotted line (see text for details). The colored area shows the spectra of the three strong LyC leakers (fesc > 0.1). The C IV λ1550, C III] λ1909, and He II λ1640 lines are clearly detected in the strongest LyC leakers (J1243+4646, J1154+2443, and J1152+3400, with escape fractions between fesc = 0.13 and 0.72), which are characterized by a high C IV/C III] ratio. All the spectra show C III] λ1909 emission (with EWs of ∼5 − 20 Å rest frame) and other weaker lines. |
We now mainly focus on the carbon and helium lines, and leave a more exhaustive report and analysis for subsequent publications. We note that the low resolution of our spectra does not allow us to exclude some contribution from stellar emission (from O, B, and Wolf-Rayet stars) to the C IV λ1550 and He II λ1640 emission lines. However, we think that the emission is predominantly nebular in both cases, at least for sources with high equivalent widths (EW(C IV) ≳ 3 Å), since absorption from stellar P-Cygni C IV profiles is not detected in high EW sources and since no Wolf-Rayet signatures are seen in the available deep optical spectra of LyC emitters (Guseva et al. 2020).
After Lyα, the lines with the highest EWs are C III] λ1909 and C IV λ1550, with EW(C III]) = 4−20 Å and EW(C IV) = 3−15 Å. The C III] λ1909 line is detected in all the sources, and C IV λ1550 in five out of eight galaxies above 4σ.
In Fig. 2 we plot the C III] and C IV EWs of our targets as a function of metallicity (using O/H as a proxy) along with measurements from other low-redshift galaxies for comparison. The C III] EWs of the LyC emitters do not occupy a particularly unique domain in this figure, and EW(C III]) does not show a dependence on the LyC escape fraction. The “envelope” of the observed distribution of the C III] EWs show a metallicity dependence that is fairly well reproduced by photoionization models using the spectral energy distributions of young stellar populations, as shown in several studies (Jaskot & Ravindranath 2016; Nakajima et al. 2018; Ravindranath et al. 2020).
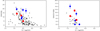 |
Fig. 2. Rest-frame C III] λ1909 (left panel) and C IV λ1550 (right panel) EWs as a function of metallicity O/H for the LyC emitters (large red squares: strong leakers, fesc > 0.1; blue circles: other leakers) and low-z comparison samples from the literature taken from the compilation of Schmidt et al. (2021). All measurements are for galaxies with direct metallicity measurements. The typical relative errors for our sources are 10−20% for all EW(C III]) and for EW(C IV) ≳ 5 Å, and larger otherwise (shown). |
Interestingly, the C IV EWs of the strong leakers are among the highest observed so far. Furthermore, J1248+4259 stands out as the low-z galaxy (z ≲ 0.4) with the highest C IV λ1550 EW (EW(C IV) = 15.14 ± 2.14 Å); however, it shows a low escape fraction (fesc = 0.014 ± 0.004). Again, the observed EWs are also in fair agreement with the predictions from photoionization models (Nakajima et al. 2018; Ravindranath et al. 2020).
He II λ1640 emission is detected at ∼4 − 6σ in all strong leakers, showing EWs of EW(He II) = 3.7−8.0 Å, which are among the highest values observed in star-forming galaxies. The He II line is also detected above 3σ in two other sources (i.e., in five of the eight spectra). We comment on the strength of the He II λ1640 emission below.
2.3. Strong LyC leakers show strong C IV λ1550 emission and a high C IV/C III] ratio
In addition to exhibiting strong C IV and He II λ1640 emission lines, the main distinguishing feature of the strong leakers is the high ratio, C43 = I(C IV λ1550)/I(C III] λ1909) ≳ 0.75, of the carbon line intensities, which is fairly exceptional, as shown in Fig. 3 (left panel), in comparison with other low-z galaxies where both carbon lines have been detected. And interestingly, except for the galaxy J1248+4259 discussed below, the carbon line ratio increases with the LyC escape fraction, as shown in the right panel. Although the sample of galaxies for which both observations of the LyC and the non-ionizing UV spectrum, including C III] and C IV, are covered is admittedly small, we suggest that, based on the available data, star-forming galaxies with I(C IV λ1550)/I(C III] λ1909) ≳ 0.75 have escape fractions fesc > 0.1 and hence show “significant” amounts of LyC emission.
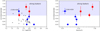 |
Fig. 3. C IV λ1550/C III] λ1909 line ratio (C43) as a function of metallicity (O/H, left panel) and the LyC escape fraction (right panel). The symbols have the same meaning as in Fig. 2. The colored area shows the region of C43 ≳ 0.75, where we propose that strong LyC leakers, i.e., galaxies with fesc > 0.1, are found empirically. We note that for the sake of simplicity for comparisons with high-z studies the line ratios of the leakers are not corrected for internal reddening and could thus be slightly higher, although the corrections should be small. |
If generally applicable, our postulate implies that the galaxy J1248+4259 reported by Izotov et al. (2018a) should be a strong LyC emitter; that is, it should have a true LyC escape fraction of at least ∼5 times that measured from the COS spectrum, which could be possible if, for example, the emission of LyC photons is not isotropic. There are indeed other indications that J1248+4259 could be a strong leaker: First, it shows a very strong Lyα emission with an EW of EW(Lyα) = 256 ± 5.2 Å, comparable to strong leakers. Second, the Lyα line profile is clearly double-peaked, with a fairly low separation of the two peaks (vsep = 283.8 ± 15.9 km s−1), which would yield fesc = 0.13 if the mean relation between fesc and vsep from Izotov et al. (2018a) was applied. Finally, J1248+4259 is also somewhat of an “outlier” in the scattered relation between O32 = [O III]/[O II] and fesc, showing a lower-than-average escape fraction for its high O32 = 11.8 (see Izotov et al. 2021).
The other low-z galaxies that show I(C IV λ1550)/I(C III] λ1909) ≳ 0.75 in Fig. 3 are J084236 and J104457. They are low-mass low-metallicity galaxies at z ∼ 0.01 that both show very strong C IV emission with EW(C IV) ∼ 6 − 10 Å (Berg et al. 2019a,b). Based on high-resolution COS spectra, which show strong nebular C IV emission in the two doublet lines and indications for minor radiation transfer effects in these lines, Berg et al. (2019b) have suggested that J104457 is optically thin to ionizing radiation, at least at energies above 47.9 eV, the ionization potential of C3+ (see also Senchyna et al. 2021). It also shares other properties of strong LyC leakers, such as a very high O32 = 16.2. Although no direct observations of the LyC are possible at these low redshifts, the available data for J104457 appear fully consistent with our postulate that this galaxy is a strong LyC leaker. We suggest that J084236 may also be a strong LyC leaker.
Intrinsically, the C43 ratio traces the ionization structure of the nebula, similarly to O32, which has already been suggested as a potential indicator of LyC escape (Jaskot & Oey 2013; Nakajima & Ouchi 2014). However, since C IV λ1550 is a resonance line, it is a priori affected by radiation transfer effects; this is in contrast to the nebular oxygen lines, which should be optically thin. Therefore, the C IV λ1550 line and the C43 ratio could be a more sensitive tracer of LyC escape than O32. To first order, both C43 and O32 trace the ionization parameter, U, and are independent of metallicity. Furthermore, an examination of photoionization models shows that both C43 and O32 vary with the LyC escape fraction. For moderate to high U, the predicted variations in C43 appear stronger than in O32, again providing some theoretical support for our empirically based postulate. A detailed comparison with models will be presented in future work.
3. Discussion and implications
3.1. Comparison with high-z LyC emitters and candidates
We first compared our results with confirmed high-z LyC emitters, although relatively few high-z galaxies with established or potentially strong LyC escape (absolute escape fractions fesc ≳ 0.1) are known. Well-studied sources with the highest LyC escape fractions are Ion2, the Sunburst arc, and probably Ion3, with relative escape fractions fesc, rel ≳ 0.5, according to Vanzella et al. (2020) 2. VLT/X-shooter spectroscopy of Ion2 at z = 3.2 indeed shows the presence of nebular emission in both C IV and C III], with a ratio I(C IV λ1550)/I(C III] λ1909) = 0.61 ± 0.23; this is compatible with our findings, although the lines are relatively weak (e.g., EW(C IV) = 2.6 Å and EW(He II) = 2.8 Å; Vanzella et al. 2020). For the other objects, the reported data are insufficient to examine C IV and C III]. Similarly, no detailed rest-UV spectra have been published for the z = 3.1 LyC emitting galaxies of Fletcher et al. (2019). The robust sample of z ∼ 3 LyC emitters from Steidel et al. (2018) and Pahl et al. (2021) provides average properties to avoid the inherent limitations in determining fesc for individual sources that are due to the stochastic intergalactic medium transmission at high z. Their LyC emitting sample has an average escape fraction of fesc = 0.06 ± 0.01, which is below our definition of strong emitters, and the stacked UV spectrum illustrated in Steidel et al. (2018) does not show strong C IV emission, although no details on carbon emission lines are reported in their study.
Another comparison is possible with Lyα emitters at z ∼ 2, where the LyC escape fraction was recently estimated using indirect empirical spectral indicators by Naidu et al. (2022) and Matthee et al. (2021). Stacking rest-UV spectra of Lyα emitters with estimated fesc ≳ 0.2 (high escape) and fesc ≲ 0.05 (low escape), they find several significant differences between the two subsamples, in particular the presence of nebular C IV λ1550, C III] λ1909, He II λ1640, and O III] λ1666 emission in the high escape sources, whereas the low escape sources only show C III] and O III] emission. Although the C IV emission of their strong leakers (EW(C IV) = 2.0 ± 0.4 Å) is weaker than that of our three sources with fesc > 0.1, which show EW > 2.5 Å, and despite C III] λ1909 being stronger than C IV, their finding of nebular C IV and He II λ1640 emission in strong leaker candidates is compatible with our results.
We therefore conclude that both low- and high-redshift observations seem to consistently show (i.e., in about three out of four cases) that the UV spectra of strong leakers (with fesc ≳ 0.1 − 0.2) are characterized by nebular C IV λ1550 and C III] λ1909 emission and C43 ≳ 0.75. Although the available data are still relatively scarce, our observations provide the first such quantitative estimate.
3.2. Implications for high-z CIV emitters
So far, very few high-redshift galaxies showing nebular C IV λ1550 emission have been reported. Since the recent discoveries of several lensed galaxies at z ∼ 6 − 7 with nebular C IV (Stark et al. 2015; Mainali et al. 2017; Schmidt et al. 2017), other C IV emitters have been found both in blank fields (e.g., at z ∼ 2.2; Tang et al. 2021) and in lensed galaxies (see Stark et al. 2014; Vanzella et al. 2021; Richard et al. 2021). The stacked rest-UV spectrum of lensed sources with median z = 3.2 and median M1500 = −17.1 from Vanzella et al. (2021) shows strong nebular C IV λ1550, C III] λ1909, and numerous other emission lines. The C IV line in several of these sources is strong, with EWs of up to EW(C IV) = 38 ± 16 Å in A1703-zd6 (Stark et al. 2015; Schmidt et al. 2021) and C43 > 0.8 in several of them. Our results suggest that these sources are strong LyC emitters, which is overall in agreement with the other observational properties they share with LyC emitters (e.g., strong Lyα emission). The fact that C IV emission is found in many strongly lensed sources probably also indicates that the fraction of strong LyC emitters increases toward fainter, lower-mass galaxies, a trend also found in the z ∼ 0.3 − 0.4 reference samples (see Izotov et al. 2021; Flury et al. 2022b).
3.3. Strong emission lines and high C43 ratios explained
This leads us to the questions of what the strong observed UV emission lines (high EW of nebular lines) tell us and how they can be understood. Since EWs measure the strength of the emission line with respect to the continuum, the EW of a UV recombination line such as He II λ1640 can be cast in the following simple form,
 (1)
(1)
where  is the ionizing photon efficiency per unit intrinsic monochromatic UV luminosity in the commonly used units of erg−1 Hz, c1640 = 5.67 × 10⁻¹² erg relates the recombination line flux to the ionizing photon flux (e.g., Schaerer 2003), and λ ≈ 1640 Å. This shows that the EW is proportional to ξion and to the hardness of the ionizing spectrum, expressed here as QHe+/QH, the ratio of the ionizing photon flux above 54 eV and 13.6 eV, respectively. From this we can easily see that the observed EWs in our three strongest leakers, EW(1640) ≈ 3 − 8 Å, are plausible. Indeed, the EWs can be explained with a relatively high ionizing photon production, log(ξion)≈25.6 − 25.8 erg−1 Hz (cf. Schaerer et al. 2018), which then implies QHe+/QH ≈ 0.01 − 0.04. This hardness translates to optical line ratios of I(He II λ4686)/I(Hβ)≈1.74 QHe+/QH ∼ 0.016 − 0.07, similar to the observations of J1154+2443 and J1248+4259, which are I(4686)/I(Hβ)∼0.02 − 0.03 (Guseva et al. 2020), and comparable to the line intensities typically observed in galaxies at comparable metallicity (at 12 + log(O/H)∼8.0; see, e.g., Schaerer et al. 2019). This simple estimate shows that the high He II λ1640 EWs reached in these leakers do not require exceptional conditions and/or exceptionally hard ionizing spectra compared to other galaxies (weak or non-leakers) at similarly low metallicity. The same conclusion also applies to, for example, the strong leaker candidates found by Naidu et al. (2022) among their Lyα emitter sample. However, the observed spectra are clearly harder at > 54 eV than predicted by normal stellar population models, and the source of these He+-ionizing photons remains to be elucidated (see, e.g., Stasińska et al. 2015).
To predict the strengths of the metallic lines of C IV and C III], which depend on the ionization parameter, spectral energy distribution, nebular abundances, and other factors, detailed photoionization models are required. The models of Nakajima et al. (2018), for example, show maximum values of EW(C IV) ∼ 8 − 10 Å and EW(C III]) ∼ 10 − 18 Å at metallicities 12 + log(O/H)∼7.7 − 8, of the same order as our observed EWs. We also examined density-bounded models at appropriate metallicities, using the BOND set of CLOUDY models from the 3 Million Models Database of Morisset et al. (2015). The models indeed show an expected increase in the C IV/C III] ratio with increasing LyC escape fraction, and several models show C IV/C III] ratios comparable to those of our observations. From these simple comparisons, we conclude that both the observed EWs and UV line ratios of the strong low-z leakers seem “reasonable” and that we probably do not need peculiar or extreme ionizing spectra to reproduce their emission line spectra. Tailored photoionization models to examine the behavior of the major UV and optical emission lines of the LyC emitters and comparison sources will be presented in a subsequent publication.
4. Conclusion
With the STIS spectrograph on board HST, we have obtained new UV spectra from ∼1200 − 2000 Å, the rest-frame spectra of eight z ∼ 0.3 − 0.4 LyC emitters from Izotov et al. (2016a,b, 2018a,b), which cover a large range of LyC escape fractions. We detect multiple emission lines, including Lyα, C IV λ1550, He II λ1640, O III] λ1666, and C III] λ1909. The Lyα and C III] lines are detected in all the sources. Our main results can be summarized as follows:
-
We report the detection above 4σ of C IV λ1550 emission in six out of eight galaxies, with the EWs in two galaxies (J1243+4646 and J1248+4259), EW(C IV) = 12−15 Å, exceeding the previously reported maximum in low-z galaxies (J104457; Berg et al. 2019b).
-
Strikingly, C IV λ1550 emission is detected in all LyC emitters with escape fractions fesc > 0.1, and the flux ratio of C IV λ1550/C III] λ1909 appears to increase with fesc.
-
Based on the available data, we suggest that strong leakers, galaxies with fesc > 0.1, are characterized by C IV λ1550/C III] λ1909 ≳ 0.75, adding another indirect indicator of LyC escape to those already established.
-
All strong leakers also show strong He II λ1640 emission with EW(He II) = 3.7−8.0 Å, which are among the highest values observed in star-forming galaxies.
-
A simple estimate shows that the high EW of the He II λ1640 line is primarily due to a high ionizing photon production, ξion, and that it does not require unusually hard ionizing spectra, compared to normal galaxies at similar metallicity that frequently show optical He II λ4686 emission lines.
In short, our observations provide an important new reference for understanding the UV spectra of LyC emitting galaxies and thus also analogs of the sources of cosmic reionization. The spectra of the strong low-z leakers share many similarities with those of the C IV λ1550 emitters recently discovered at high redshifts (e.g., Stark et al. 2015; Mainali et al. 2017; Schmidt et al. 2017), and our results suggest that these objects are good candidates for strong LyC escape. If universally applicable, the empirical criterion of using the carbon line ratio C IV λ1550/C III] λ1909 ≳ 0.75 to identify strong LyC leakers could represent an additional important tool for studying the sources of cosmic reionization.
The galaxies are J1243+4646, J1154+2443, J1152+3400, J1442−0209, J0925+1403, J1011+1947, J0901+2119, and J1248+4259.
We here refer to relative escape fractions since absolute values cannot reliably be determined for individual sources at high z (e.g., Steidel et al. 2018).
Acknowledgments
Y.I. acknowledges support from the National Academy of Sciences of Ukraine by its priority project “Fundamental properties of the matter in relativistic collisions of nuclei and in the early Universe”. D.B., J.C., A.J., and T.X.T. acknowledge support from grant HST-GO-15941.002-A. This research is based on observations made with the NASA/ESA Hubble Space Telescope obtained from the Space Telescope Science Institute, which is operated by the Association of Universities for Research in Astronomy, Inc., under NASA contract NAS 5-26555. These observations are associated with programs GO 15941 and GO 15433 (P.I. Schaerer).
References
- Berg, D. A., Skillman, E. D., Henry, R. B. C., Erb, D. K., & Carigi, L. 2016, ApJ, 827, 126 [NASA ADS] [CrossRef] [Google Scholar]
- Berg, D. A., Erb, D. K., Henry, R. B. C., Skillman, E. D., & McQuinn, K. B. W. 2019a, ApJ, 874, 93 [NASA ADS] [CrossRef] [Google Scholar]
- Berg, D. A., Chisholm, J., Erb, D. K., et al. 2019b, ApJ, 878, L3 [NASA ADS] [CrossRef] [Google Scholar]
- Chisholm, J., Gazagnes, S., Schaerer, D., et al. 2018, A&A, 616, A30 [NASA ADS] [CrossRef] [EDP Sciences] [Google Scholar]
- Chisholm, J., Prochaska, J. X., Schaerer, D., Gazagnes, S., & Henry, A. 2020, MNRAS, 498, 2554 [CrossRef] [Google Scholar]
- Feltre, A., Charlot, S., & Gutkin, J. 2016, MNRAS, 456, 3354 [Google Scholar]
- Fletcher, T. J., Tang, M., Robertson, B. E., et al. 2019, ApJ, 878, 87 [Google Scholar]
- Flury, S. R., Jaskot, A. E., Ferguson, H. C., et al. 2022a, ApJS, submitted [arXiv:2201.11716] [Google Scholar]
- Flury, R., Jaskot, A. E., Ferguson, H. C., et al. 2022b, ApJ, submitted [Google Scholar]
- Gazagnes, S., Chisholm, J., Schaerer, D., et al. 2018, A&A, 616, A29 [NASA ADS] [CrossRef] [EDP Sciences] [Google Scholar]
- Guseva, N. G., Izotov, Y. I., Schaerer, D., et al. 2020, MNRAS, 497, 4293 [CrossRef] [Google Scholar]
- Gutkin, J., Charlot, S., & Bruzual, G. 2016, MNRAS, 462, 1757 [Google Scholar]
- Henry, A., Berg, D. A., Scarlata, C., Verhamme, A., & Erb, D. 2018, ApJ, 855, 96 [Google Scholar]
- Izotov, Y. I., Orlitová, I., Schaerer, D., et al. 2016a, Nature, 529, 178 [Google Scholar]
- Izotov, Y. I., Schaerer, D., Thuan, T. X., et al. 2016b, MNRAS, 461, 3683 [Google Scholar]
- Izotov, Y. I., Worseck, G., Schaerer, D., et al. 2018a, MNRAS, 478, 4851 [Google Scholar]
- Izotov, Y. I., Schaerer, D., Worseck, G., et al. 2018b, MNRAS, 474, 4514 [Google Scholar]
- Izotov, Y. I., Worseck, G., Schaerer, D., et al. 2021, MNRAS, 503, 1734 [NASA ADS] [CrossRef] [Google Scholar]
- Jaskot, A. E., & Oey, M. S. 2013, ApJ, 766, 91 [Google Scholar]
- Jaskot, A. E., & Ravindranath, S. 2016, ApJ, 833, 136 [NASA ADS] [CrossRef] [Google Scholar]
- Leitherer, C., Hernandez, S., Lee, J. C., & Oey, M. S. 2016, ApJ, 823, 64 [Google Scholar]
- Mainali, R., Kollmeier, J. A., Stark, D. P., et al. 2017, ApJ, 836, L14 [Google Scholar]
- Matthee, J., Naidu, R. P., Pezzulli, G., et al. 2021, MNRAS, submitted [arXiv:2110.11967] [Google Scholar]
- Morisset, C., Delgado-Inglada, G., & Flores-Fajardo, N. 2015, Rev. Mex. Astron. Astrofis., 51, 103 [Google Scholar]
- Naidu, R. P., Matthee, J., Oesch, P. A., et al. 2022, MNRAS, 510, 4582 [CrossRef] [Google Scholar]
- Nakajima, K., & Ouchi, M. 2014, MNRAS, 442, 900 [Google Scholar]
- Nakajima, K., Schaerer, D., Le Fèvre, O., et al. 2018, A&A, 612, A94 [NASA ADS] [CrossRef] [EDP Sciences] [Google Scholar]
- Pahl, A. J., Shapley, A., Steidel, C. C., Chen, Y., & Reddy, N. A. 2021, MNRAS, 505, 2447 [NASA ADS] [CrossRef] [Google Scholar]
- Ramambason, L., Schaerer, D., Stasińska, G., et al. 2020, A&A, 644, A21 [NASA ADS] [CrossRef] [EDP Sciences] [Google Scholar]
- Ravindranath, S., Monroe, T., Jaskot, A., Ferguson, H. C., & Tumlinson, J. 2020, ApJ, 896, 170 [NASA ADS] [CrossRef] [Google Scholar]
- Richard, J., Claeyssens, A., Lagattuta, D., et al. 2021, A&A, 646, A83 [EDP Sciences] [Google Scholar]
- Rigby, J. R., Bayliss, M. B., Gladders, M. D., et al. 2015, ApJ, 814, L6 [NASA ADS] [CrossRef] [Google Scholar]
- Saldana-Lopez, A., Schaerer, D., Chisholm, J., et al. 2022, A&A, in press, https://doi.org/10.1051/0004-6361/202141864 [Google Scholar]
- Schaerer, D. 2003, A&A, 397, 527 [NASA ADS] [CrossRef] [EDP Sciences] [Google Scholar]
- Schaerer, D., Izotov, Y. I., Verhamme, A., et al. 2016, A&A, 591, L8 [NASA ADS] [CrossRef] [EDP Sciences] [Google Scholar]
- Schaerer, D., Izotov, Y. I., Nakajima, K., et al. 2018, A&A, 616, L14 [NASA ADS] [CrossRef] [EDP Sciences] [Google Scholar]
- Schaerer, D., Fragos, T., & Izotov, Y. I. 2019, A&A, 622, L10 [NASA ADS] [CrossRef] [EDP Sciences] [Google Scholar]
- Schmidt, K. B., Huang, K.-H., Treu, T., et al. 2017, ApJ, 839, 17 [NASA ADS] [CrossRef] [Google Scholar]
- Schmidt, K. B., Kerutt, J., Wisotzki, L., et al. 2021, A&A, 654, A80 [NASA ADS] [CrossRef] [EDP Sciences] [Google Scholar]
- Senchyna, P., Stark, D. P., Vidal-García, A., et al. 2017, MNRAS, 472, 2608 [NASA ADS] [CrossRef] [Google Scholar]
- Senchyna, P., Stark, D. P., Charlot, S., et al. 2021, AAS J., submitted [arXiv:2111.11508] [Google Scholar]
- Stark, D. P., Richard, J., Siana, B., et al. 2014, MNRAS, 445, 3200 [NASA ADS] [CrossRef] [Google Scholar]
- Stark, D. P., Walth, G., Charlot, S., et al. 2015, MNRAS, 454, 1393 [Google Scholar]
- Stasińska, G., Izotov, Y., Morisset, C., & Guseva, N. 2015, A&A, 576, A83 [NASA ADS] [CrossRef] [EDP Sciences] [Google Scholar]
- Steidel, C. C., Bogosavljević, M., Shapley, A. E., et al. 2018, ApJ, 869, 123 [Google Scholar]
- Tang, M., Stark, D. P., Chevallard, J., et al. 2021, MNRAS, 501, 3238 [NASA ADS] [CrossRef] [Google Scholar]
- Vanzella, E., Caminha, G. B., Calura, F., et al. 2020, MNRAS, 491, 1093 [Google Scholar]
- Vanzella, E., Caminha, G. B., Rosati, P., et al. 2021, A&A, 646, A57 [EDP Sciences] [Google Scholar]
- Verhamme, A., Orlitová, I., Schaerer, D., et al. 2017, A&A, 597, A13 [NASA ADS] [CrossRef] [EDP Sciences] [Google Scholar]
- Wang, B., Heckman, T. M., Leitherer, C., et al. 2019, ApJ, 885, 57 [NASA ADS] [CrossRef] [Google Scholar]
- Wang, B., Heckman, T. M., Amorín, R., et al. 2021, ApJ, 916, 3 [NASA ADS] [CrossRef] [Google Scholar]
All Figures
|
Fig. 1. STIS rest-frame spectra of eight z ∼ 0.3 − 0.4 LyC emitters. They are ordered by decreasing fesc from top to bottom, except for J1248+4259, which is shown at the top with a dotted line (see text for details). The colored area shows the spectra of the three strong LyC leakers (fesc > 0.1). The C IV λ1550, C III] λ1909, and He II λ1640 lines are clearly detected in the strongest LyC leakers (J1243+4646, J1154+2443, and J1152+3400, with escape fractions between fesc = 0.13 and 0.72), which are characterized by a high C IV/C III] ratio. All the spectra show C III] λ1909 emission (with EWs of ∼5 − 20 Å rest frame) and other weaker lines. |
| In the text | |
|
Fig. 2. Rest-frame C III] λ1909 (left panel) and C IV λ1550 (right panel) EWs as a function of metallicity O/H for the LyC emitters (large red squares: strong leakers, fesc > 0.1; blue circles: other leakers) and low-z comparison samples from the literature taken from the compilation of Schmidt et al. (2021). All measurements are for galaxies with direct metallicity measurements. The typical relative errors for our sources are 10−20% for all EW(C III]) and for EW(C IV) ≳ 5 Å, and larger otherwise (shown). |
| In the text | |
|
Fig. 3. C IV λ1550/C III] λ1909 line ratio (C43) as a function of metallicity (O/H, left panel) and the LyC escape fraction (right panel). The symbols have the same meaning as in Fig. 2. The colored area shows the region of C43 ≳ 0.75, where we propose that strong LyC leakers, i.e., galaxies with fesc > 0.1, are found empirically. We note that for the sake of simplicity for comparisons with high-z studies the line ratios of the leakers are not corrected for internal reddening and could thus be slightly higher, although the corrections should be small. |
| In the text | |
Current usage metrics show cumulative count of Article Views (full-text article views including HTML views, PDF and ePub downloads, according to the available data) and Abstracts Views on Vision4Press platform.
Data correspond to usage on the plateform after 2015. The current usage metrics is available 48-96 hours after online publication and is updated daily on week days.
Initial download of the metrics may take a while.