| Issue |
A&A
Volume 644, December 2020
|
|
|---|---|---|
| Article Number | A148 | |
| Number of page(s) | 7 | |
| Section | Planets and planetary systems | |
| DOI | https://doi.org/10.1051/0004-6361/202039688 | |
| Published online | 15 December 2020 | |
Weak spectral features on (101995) Bennu from the OSIRIS-REx Visible and InfraRed Spectrometer
1
Solar System Exploration Division, NASA Goddard Space Flight Center,
Greenbelt,
MD,
USA
e-mail: amy.simon@nasa.gov
2
Department of Geography, University of Winnipeg,
Winnipeg, Canada
3
Southwest Research Institute,
Boulder,
CO,
USA
4
Institut d’Astrophysique Spatiale, Université Paris-Saclay, CNRS,
91405
Orsay, France
5
Hawai’i Institute of Geophysics and Planetology, University of Hawai’i at Manoa,
Honolulu, HI, USA
6
LESIA, Observatoire de Paris, Université PSL, CNRS, Université de Paris, Sorbonne Université,
5 place Jules Janssen,
92195
Meudon, France
7
Institut Universitaire de France (IUF),
1 rue Descartes,
75231
Paris Cedex 05, France
8
Department of Physics and Astronomy,
Ithaca College,
Ithaca, NY, USA
9
Lunar and Planetary Laboratory, University of Arizona,
Tucson, AZ, USA
Received:
15
October
2020
Accepted:
18
November
2020
Context. The NASA Origins, Spectral Interpretation, Resource Identification, and Security-Regolith Explorer (OSIRIS-REx) mission has obtained thousands of spectra of asteroid (101955) Bennu with the OSIRIS-REx Visible and InfraRed Spectrometer.
Aims. We present a spectral search for minor absorption bands and determine compositional variations on the surface of Bennu.
Methods. Reflectance spectra with low and high spatial resolutions were analyzed for evidence of weak absorption bands. Spectra were also divided by a global average spectrum to isolate unique spectral features, and variations in the strongest band depths were mapped on a surface shape model. The global visible to near-IR spectrum of Bennu shows evidence of several weak absorption bands with depths of a few percent.
Results. Several observed bands are consistent with phyllosilicates, and their distribution correlates with the stronger 2.74-μm hydration band. A 0.55-μm band is consistent with iron oxides and is deepest in the spectrally reddest areas on Bennu. The presence of hydrated phyllosilicates and iron oxides indicates substantial aqueous alteration in Bennu’s past.
Conclusions. Bennu’s spectra are not identical to a limited set of carbonaceous chondrite spectra, possibly due to compositional properties and spatial scale differences; however, returned samples should contain a mixture of common chondrite materials.
Key words: minor planets, asteroids: individual: (101955) Bennu / techniques: spectroscopic / planets and satellites: composition
© ESO 2020
1 Introduction
As part of the exploration of asteroid (101955) Bennu by the Origins, Spectral Interpretation, Resource Identification, and Security-Regolith Explorer (OSIRIS-REx), spectral data were acquired over the wavelength range from 0.4 to 4.3 μm. The OSIRIS-REx Visible and InfraRed Spectrometer (OVIRS), and the other remote sensing instruments on board the spacecraft, provided context for the sample, and were used to characterize the dark surface of Bennu (Lauretta et al. 2017). In particular, OVIRS was designed to map spectral bands of species such as silicates, oxides, carbonates, hydrated minerals, and organic compounds with depths of >5% (Reuter et al. 2018).
Full-disk spectra of Bennu acquired during the spacecraft’s approach showed only one feature with >5% band depth: a 2.7-μm absorption indicative of hydrated phyllosilicates (Hamilton et al. 2019). This feature is globally present, with variations in band depth of a few percent across the surface (Simon et al. 2020). Organic and carbonate absorption features near 3.4-μm were identified in surface-resolved spectra (Kaplan et al. 2020a, and in prep.; Simon et al. 2020). These carbon-bearing spectral features showed no correlation with the other surface characteristics: visible-wavelength spectral slopes (<1.5 μm), 0.55-μm brightness, and surface temperature (Simon et al. 2020).
Here we present the results of a search for minor (<5% depth) absorption bands at wavelengths shorter than 2.6 μm, as longer wavelength bands have been investigated elsewhere (Hamilton et al. 2019; Kaplan et al. 2020a, and in prep.; Simon et al. 2020). In Sect. 3, we show the global average spectrum together with end-member spectra to identify globally present bands and large-scale spectral differences. We also show the end-member spectra with the global spectrum removed to highlight compositional variations and unique spectral bands. We map the best candidate bands and examine correlations between bands and other surface characteristics (Sect. 4). Finally, we discuss the composition of Bennu’s surface based on minerals and meteorites that display similar spectral bands (Sect. 5).
2 Observations
From April to June 2019, during the Detailed Survey Equatorial Stations campaign (Lauretta et al. 2017), near-global coverage was obtained with OVIRS spots within a 5-km range of Bennu and at several constant solar phase angles. At 5-km range to the surface, an OVIRS spot covered roughly 600 m2 of surface near the sub-spacecraft point, including along-track smear, during the observations. We limited our global spectral search to data acquired at the lowest phase angle (8°). Additional spectra were obtained in October 2019: reconnaissance phase observations of the candidate sample sites and nearby context regions at 1-km range (~36 m2 spots) with varying phase angles. We examined these spectra in several regions of interest as higher spatial resolution allows for a better separation of boulders with distinct spectral signatures from the surrounding environment.
The OVIRS spectrum is assembled from five separate linear variable filters, with slightly overlapping wavelengths spanning 0.39 to 4.3 μm (Reuter et al. 2018). All OVIRS spectra are calibrated using an automated pipeline process that converts detector counts to physical units (Simon et al. 2018). The calibrated radiance spectra are resampled, thermal tail-subtracted, and divided by solar flux to produce reflectance spectra (Simon et al. 2020).
Because the transmission of each filter varies with wavelength, there can be small offsets at the filter boundaries, though the radiometric conversion accounts for this in ideal circumstances. However, the detector is read out row by row and the spacecraft was slewing during each integration, meaning that different filter segments may integrate over slightly different areas on the surface. This effect is most apparent when crossing a region with sharp illumination or spectral shape boundaries (e.g., boulder shadows or the limb) and necessitates a manually checking of high phase angle observations. Data with low spatial resolutions and low phase angles have the largest short-wavelength signal-to-noise ratio (S/N) and the fewest shadows. Data with higher spatial resolution, which were acquired at greater heliocentric range and higher phase angles, used a longer integration time to ensure adequate S/N (Fig. A.1).
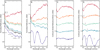 |
Fig. 1 Bennu global average and end-member spectra. A: low phase angle and 600 m2/spot resolution spectra. Horizontal bars mark the locations of broad absorption features. Vertical bars denote weaker or narrow features. The black curve is the global average spectrum; colors are individual end-member spectra. B: high spatial resolution spectra from the same locations as in panel A. C: spectra from panel A divided by the global average spectrum and with a linear continuum (0.42–2.45 μm) removed. D: spectra from panel B divided by the average of all spectra acquired on the same date. Apparent absorptions are denoted by vertical bars. The pyroxene boulder spectrum is divided by two to fit on the plot (bottom curve). |
3 Global average and end-member spectra
Bennu’s unresolved spectrum is generally featureless with an overall blue slope (decreasing reflectance with longer wavelength), consistent with its classification as a B-type asteroid (Hamilton et al. 2019). When we averaged 7193 low phase angle, spatially resolved spectra (~600 m2 per spot), the spectrum revealed several apparent absorption bands (Fig. 1, black curve). Broad features with depths of a few percent are visually observed near 0.55, 1.05, 1.4, 1.8, and 2.3 μm. Weaker or narrower features are also observed at 0.5, 0.59, 0.8, and 2.55 μm. End-member spectra were chosen from the reddest, average, and bluest locations where there was overlapping coverage at higher spatial resolution. The spectral features are present in nearly every spectrum, and the majority of Bennu’s variation comes from spectral slope differences in only a few distinct locations (Fig. 1, panel A). These redder spectral units are described in Barucci et al. (2020) and may be related to composition, space weathering, or particle size differences but cover only a few percent of Bennu’s surface; similar degrees of variability have been observed on the C-complex asteroids Ryugu (Barucci et al. 2019)and Ceres (Schäfer et al. 2018).
At the highest spatial resolution (~36 m2), the spectral slope still dominates the variation, but a few spots have noticeably different spectral shapes (Fig. 1, panel B, bottom curve). These spectra have clear absorption bands at 1 and 2 μm, consistent with calcium-poor pyroxenes, and occur when an OVIRS spot is dominated by a single bright boulder (DellaGiustina et al. 2020a). These boulders are rare on Bennu’s surface, and at low spatial resolution the pyroxene signature is only detectable when spectra are divided by the global average spectrum.
Dividing the spectra in panel A of Fig. 1 by the global average and then removing a linear continuum from 0.42 to 2.45 μm (Clark & Roush 1984) yields ratio spectra, which highlight small spectral variations. (Fig. 1, panel C). The apparent downward turn at long wavelengths for the redder spectra is an artifact of the continuum removal and does not indicate an absorption feature. A similar approach was applied to the high spatial resolution spectra (Fig. 1, panel D) using a “local” average of all spectra obtained on the same date (3000 to 4000 spectra per date); using a local average obtained under the same viewing conditions was better for removing filter boundary mismatches. In the ratio spectra, the reddest examples (Fig. 1, panels C and D, top curves) show a distinct absorption centered near 0.54 or 0.6 μm, while other spectra contain absorptions centered on ~0.8 or 1.0 μm (Fig. 1, panels C and D, middle curves). These absorptions are relatively shallow, with band depths of 1 to 2%. The locations of pyroxene-bearing boulders (Fig. 1, panels C and D, bottom curves) show the most distinct spectral shape, and they show much greater band depths when the OVIRS footprint covers more of the boulder (Fig. 1, panel D).
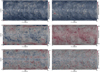 |
Fig. 2 Maps of minor band depths and associated properties, from data collected at low phase angles and low spatial resolution, overlaid on an image base map of Bennu with a pixel scale of 5 cm pixel−1 (Bennett et al. 2020). A: 0.55-μm band. B: 1.05-μm band. C: 1.8-μm band. D: spectral slope from 0.5 to 1.5 μm. E: temperature. F: 2.3-μm band. |
4 Spatial distribution
We mapped the band depths of the minor spectral features in the global spectrum to determine if any are associated with individual geologic features (Fig. 2). To calculate band depth, a continuum was removed around eachband and the depth was measured at the approximate band center (Supplemental Material). The 0.55-μm band variation shows a distinct pattern, aligning with specific surface features (Fig. 2A). For comparison, panel D of Fig. 2 is a map of the spectral slope from 0.5 to 1.5 μm. In agreement with Fig. 2, the reddest regions have the deepest band at 0.55 μm, as confirmed by Fornasier et al. (2020). The 1.05-μm depth map (Fig. 2B) correlates with surface temperature (Fig. 2E) and albedo (Simon et al. 2020). In contrast, the 1.4-μm band (not shown) has no discernible pattern and only very small variations of ±0.2 to 0.3%. The 1.8- and 2.3-μm bands (Fig. 2C and F) have similarly small variations of ±0.5 to 0.6%, though the 1.8-μm band appears to have a limited latitude trend, with increased depths at mid-latitudes.
Simon et al. (2020) found that Bennu’s surface temperature, 2.7-μm hydration band depth, and albedo distribution are correlated with one another. Here, we find that the 0.55-μm band most strongly correlates with the spectral slope from 0.5 to 1.5 μm, with Spearman’s rank correlation |r| = 0.66 (Fig. B.1). The 1.05-μm band correlates best with temperature and albedo, |r| = 0.65 and 0.50, respectively. The 1.4- and 2.3-μm bands do not correlate well with any other parameter. The 1.8-μm band has weak correlations with spectral slope and the 0.55-μm band; |r| ≤ 0.38.
5 Discussion
Although Bennu has low reflectance and a blue slope typical of heated carbonaceous materials, it shows a surprising number of spectral features; dark carbonaceous material typically has a featureless spectrum (Ito 1992; Cloutis 2003). The interpretation of weak visible and near-IR spectral features can be problematic as the same absorption bands are found in multiple minerals. Additionally, particle size, material phase, space weathering, and other factors can influence band center locations and the spectral slope (Nesvorny et al. 2005; Lantz et al. 2013; Cloutis et al. 2011a,b, 2018; Izawa et al. 2019). Further compounding the issue, a single OVIRS spectrum covers a large area and likely encompasses a mixture of materials. Bennu’s average spectrum does not appear to be dominated by features of any specific mineral (Fig. 3A). However, we can compare theobserved band locations to likely compositions from carbonaceous chondrite (CC) meteorites, which are believed to be similar to Bennu, particularly the CI and CM petrologic classes (Clark et al. 2011; Hamilton et al. 2019).
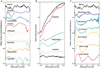 |
Fig. 3 Bennu’s spectrum compared with laboratory-measured mineral and CC meteorite spectra (Table B.1). A: Bennu’s global averaged spectrum: not a close match with common phyllosilicates or iron-bearing oxide minerals. B: Bennu’s end-member ratio spectra (black curves) without continuum removal: resembles graphite and iron oxides. C: Bennu’s global averaged spectrum: differs from Murchison IOM, Murchison slab, and labeled CC meteorite chip spectra. |
The 0.55-micron region
In the Bennu spectra, a weak, distinct absorption line is seen in most spectra centered at 0.50–0.51 μm, and another at 0.59 μm in the spectra that are redder than average (Fig. 1). These features sit on top of a broader feature that is centered near 0.55 μm, which is usually attributed to an iron transition band (Izawa et al. 2019). A 0.55-μm feature is most consistent with the iron oxides magnetite (Fe3 O4) or goethite (Fe3+O(OH)), but it also appears in some spectra of Fe-bearing phyllosilicates (Morris et al. 1985; Sherman & Waite 1985; Clark et al. 1990; Cloutis et al. 2011a,b). Troilite (FeS) and certain phases of graphitized carbon can show an absorption that is often centered at shorter wavelengths, as seen in panel B of Fig. 3 (Cloutis et al. 1994, 2011a; Applin et al. 2018; Prince et al. 2020).
Of the minerals and components typically found in aqueously altered CCs, magnetite is the best spectral match for a 0.55-μm feature with smaller features at 0.5 and 0.59 μm (Cloutis et al. 2011a,b; Lauretta et al. 2019). Magnetite is also observed in the thermal IR spectra of Bennu, though its distribution is not as obviously tied to red regions (Hamilton et al. 2020). Additionally, 0.55-μm features are commonly seen in the reflectance spectra of CI1s, the most magnetite-rich of the CCs (Cloutis et al. 2011a). The presence of this feature in OVIRS spectra suggests that Bennu is similarly magnetite-rich and that it underwent extensive aqueous alteration, consistent with the detection of possible carbonate veins (Kaplan et al. 2020a). The reflectance spectra of the insoluble organic matter (IOM) separated from the Murchison CM2 CC also show a 0.5-μm absorption feature (Fig. 3C). However, IOM can be altered by subsequent thermal metamorphosis at lower temperatures (<600 K, Cloutis et al. 2011a) than magnetite (melting temperature >2000 K, depending on oxygen fugacity Monazam et al. 2014).
The 1.05-micron region
An absorption feature in the 1.05-μm region can represent a number of minerals, including olivine, Fe-bearing carbonates, magnetite, and goethite (Fig. 3B), as well as Fe-bearing silicates and phyllosilicates (Morris et al. 1985; Sherman & Waite 1985; King & Ridley 1987; Clark et al. 1990; Bishop et al. 2008; Cloutis et al. 2011a,b; Horgan et al. 2014; Izawa et al. 2019). Its association with a 0.5-μm feature is also consistent with magnetite or goethite, whereas a 1.0- and 2.0-μm feature pair would be associated with pyroxenes. On Bennu, this band correlates with the surface temperature, or the darker regions of the surface (Simon et al. 2020). An absorption feature in the 1.05-μm region is seen in most CC classes, including CI, CM, and thermally metamorphosed CCs (Cloutis et al. 1990, 2011a,b, 2012). As with magnetite, it is also seen weakly in the reflectance spectra of Murchison IOM. Several asteroids in the same taxonomic class as Bennu have a broad 1.0-μm feature that has also been attributed to magnetite (Yang & Jewitt 2010).
The 1.4-micron region
A 1.4-μm absorption band is likely associated with the OH present in phyllosilicates, and, as an overtone of the 2.7-μm band, it would be expected to be much weaker than the latter band (Clark et al. 1990). It is narrow and ubiquitous in spectra of CC-type phyllosilicates (saponite, serpentine), being centered at 1.39–1.4 μm (Clark et al. 1990; Bishop et al. 2008; Cloutis et al. 2011a,b; Horgan et al. 2014).
The 1.8-micron region
A 1.9-μm feature associated with an H2O combinationband is present in the reflectance spectra of most phyllosilicates (Fig. 3A) but is usually narrower than the broad feature observed on Bennu. However, a broad weak feature in this region is seen in some goethite, saponite, and serpentine spectra, as well as in some reflectance spectra of the Orgueil CI1 chondrite (Cloutis et al. 2011a).
The 2.3-micron region
An absorption band in the 2.3-μm region can be associated with a variety of components, including Mg or Fe-bearing phyllosilicates (serpentine, saponite), carbonates (calcite, dolomite), and IOM (Gaffey 1986; Clark et al. 1990; Bishop et al. 2008). A weak feature in this region is seen in at least one spectrum of the Orgueil CI1 chondrite, as well as in some thermally metamorphosed CCs (Cloutis et al. 2011a,b). When this band is found in combination with other bands, its position can be used, for example, to separate serpentine from saponite and calcite from dolomite, (Hamilton et al. 2008). However, Bennu’s 2.3-μm band is not sufficiently distinct to determine its origin.
Other absorption bands
Other possible absorption bands are seen in Bennu spectra, for example the weak feature near 0.82 μm. This band is not present in the reflectance spectra of major minerals in CCs but is seen in the reflectance spectra of some CM chondrites (Fig. 3C). The source of such a feature is uncertain, though some clinopyroxenes have a 0.8-μm absorption (Horgan et al. 2014). It may be spurious in the sense that it appears as an absorption feature but is a combination of absorption bands at shorter and longer wavelengths.
Additionally, in the spectra divided by the global average, a 0.7-μm band is more distinct in some high spatial resolution spectra (Fig. 1D). Many phyllosilicates have bands in this region, though normally in combination with features near 0.9 and 1.1 μm that are associated with companion Fe2+ charge transfer bands (Clark et al. 1990) and with the 2.7-μm hydration band observed on Bennu (Hamilton et al. 2019). It is often seen in serpentines with low or medium Fe content, saponite with high Fe content, and CM CC reflectance spectra (Cloutis et al. 2011a,b). Other C-complex asteroids, particularly Cgh and Ch subtypes, also show a 0.7-μm feature (DeMeo et al. 2009). Although a companion band is not seen at 0.9 μm in OVIRS spectra, its presence may be influenced or obscured by other bands. Additionally, OVIRS only obtained limited high spatial resolution coverage, but broadband imaging data indicate that the 0.7-μm band may be common on the surface (DellaGiustina et al. 2020b).
Comparison with CC meteorites
The majority of CC meteorite spectra are obtained from ground, fine-particulate samples either in ambient conditions or under vacuum. However, spectra of small particles are likely not as relevant as those of meteorite chips or slabs, as there is little evidence of fine material on Bennu (Lauretta et al. 2019; Hamilton et al. 2020; Rozitis et al. 2020). We compared reflectance spectra from several CC chips and slabs that were chosen because they were spectrally blue or flat with Bennu spectra (Fig. 3C); the Murchison data are a slab spectrum from a blue spot, along with extracted IOM material. None of these CC spectra are a particularly good match to Bennu’s spectrum; in many cases, the CCs more closely match laboratory measurements of individual phyllosilicates (Fig. 3A), pyroxene (QUE 99038), or olivine (WIS 91600) sincetheir spectra, within the spectrometer beam, are dominated by matrix material or chondrules. This discrepancy with Bennu is not surprising as the chip spectra sample a small spot (a few millimeters) compared with the possiblymixed composition boulders and surrounding terrains encompassed by the OVIRS footprints (tens of meters). Indeed, full-disk Bennu spectra do not show the absorptions seen in Fig. 1 (Clark et al. 2011; Hamilton et al. 2019), and even the bright pyroxene signature is only detectable when it dominates an OVIRS footprint.
Implications for the returned sample
The bands observed in the OVIRS spectra are all globally present, with variations in depth too small to be meaningful (≤ ±1%). Only the 0.55- and 1.05-μm band depths convincingly correlate with specific geologic features: the locations with the reddest spectral slopes and the darker regions, respectively (Fig. 2). The 0.55-μm band variation could be an indication of a compositional abundance difference as it ties to the reddest regions in boulders and in some craters. The red slope itself could be due to Fe-bearing oxide minerals, graphite, or both as these have been found together in some meteorites (Scott et al. 1981). However, band depth and spectral slope can also be affected by factors other than abundance and composition, such as dust cover and space weathering, so the interpretation cannot be uniquely constrained (Cloutis et al. 2018; Kiddell et al. 2018).
OSIRIS-REx’s sample collection site, known as Nightingale (Fig. 4A), is a crater with a red spectral slope. It has a deeper 0.55-μm absorption than its surroundings and shows a range of band depths for the features at 1.05, 1.8, and 2.3 μm similar to that observed on the rest of the surface (Figs. 4B–D). As such, Nightingale’s spectra are consistent with a mix of Fe-bearing oxide phases and phyllosilicates.
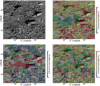 |
Fig. 4 High spatial resolution spectral maps of the OSIRIS-REx primary sample site. A: Nightingale crater, center marked with a star. B: 0.55-μm band, the deepest on the crater floor. C: 1.8-μm band depths ~2%. D: 2.3-μm band depths ~2.5%. |
6 Conclusions
We examined the reflectance spectra of Bennu collected over visible to near-IR wavelengths at both low (600 m2) and high (36 m2) spatial resolutions. The global average spectrum shows absorption bands with depths of a few percent centered at 0.55, 1.05, 1.4, 1.8, and 2.3 μm. The majority of these features show only small band depth variations across the surface. The bands are consistent with Mg or Fe-bearing phyllosilicates and iron oxides (magnetite, goethite). In select locations, removing the global signal amplifies distinct signatures, particularly that of pyroxene and possibly those of low- or medium-Fe serpentine or high-Fe saponite at 0.7 μm. The 0.55-μm absorption is best attributed to magnetite, which would indicate past aqueous alteration. This is consistent with the detection of the bright veins, possibly composed of carbonates, that are observed within boulders (Kaplan et al. 2020a). The other identified absorptions have weak variations that are correlated with variations in the 2.7-μm hydrated phyllosilicate band, albedo, and temperature. Based on the observed spectral features, we expect the sample of Bennu returned by the OSIRIS-REx mission to contain phyllosilicates, iron oxides, and carbon-bearing material.
Acknowledgements
We are grateful to the entire OSIRIS-REx Team for making the encounter with Bennu possible. This material is based upon work supported by NASA under Contract NNM10AA11C issued through the New Frontiers Program. C.L. acknowledges funding support from CNES. E.A.C. acknowledges funding from the Canadian Space Agency, the Natural Sciences and Engineering Research Council of Canada, the Canada Foundation for Innovation, the Manitoba Research Innovation Fund, and the University of Winnipeg. OVIRS spectral data collected during the Detailed Survey (9 May 2019) and Reconnaissance A (5 to 26 Oct. 2019) mission phases are available via the Planetary Data System at https://sbn.psi.edu/pds/resource/orex/ovirs.html.
Appendix A Signal-to-noise ratios
The S/Ns for the observations were estimated using stable onboard internal calibration sources (tungsten filaments and blackbodies) to determine the noise level (Reuter et al. 2018). Spectra of these sources were acquired close in time to each of the science observations. After background subtraction, the fractional RMS was found for a series of 30 calibrator spectra for each date. Inverting this value gives the calibrator S/N. As the Bennu signal is higher than that of the calibrators at short and long wavelengths, and lower around 2.5 μm, the Bennu S/N was found by scaling the S/N by the ratio of the average internal source radiance to a representative Bennu spectrum for each date (Fig. A.1).
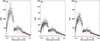 |
Fig. A.1 Signal-to-noise ratios calculated from instrument internal calibration source data and Bennu’s average signal. (A) S/N for the global mapping data set collected at low resolution and low phase angle. (B) S/N for a high-latitude data set with high spatial resolution. (C) S/N for a low-latitude data set with high spatial resolution. |
Appendix B Mapping parameters and correlations
The minor band maps were made by computing band depth values for each OVIRS spot and combining those values onto the facets of theBennu shape model (Barnouin et al. 2019). To enable band depth calculations, we divided out the spectral continuum over the wavelength region surrounding the absorption feature of interest. Band depth calculations for the 0.55- and 1.05-μm bands use a linear continuum and follow the methods described in Kaplan et al. (2020b). For the 1.4-, 1.8-, and 2.3-μm band depth calculations, we defined the spectral continuum with an upper convex hull fit to the wavelength range between 1.27 and 2.6 μm. This continuum method and wavelength range was chosen because of the close proximity of each of these absorption bands, making them difficult to separate with individual continua. This method is commonly used for continuum removal (Bishop et al. 2008)and produces a good fit across the region (Fig. B.2). The full set of band parameters used in the maps can be found in Table B.2.
Calculated band depth values are registered into Bennu shape models with 196 608 facets for the global maps and 786 432 facets for the prime sample site maps. On each facet, band depth values from multiple overlapping OVIRS footprints are averaged. This method takes the ~20-m OVIRS spots and places them into the shape model with a resolution of ~6 m per facet side for the global data, and takes the OVIRS sample site spots of ~ 4 to 9 m and places them into a shape model with ~1.5-m facet side lengths.
Laboratory data.
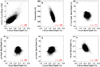 |
Fig. B.1 Highest correlations between map pairs. A: 0.55-μm band, which correlates best with the spectral slope. B: 1.05-μm band with temperature. C: 1.4-μm. D: 1.8-μm. E: 2.3-μm bands, which show no strong correlations. F: 1.8- and 0.55-μm bands, which show weak correlation. |
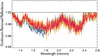 |
Fig. B.2 Convex hull continuum removal from 1.27 to 2.6 μm. |
Band depth fitting parameters.
References
- Applin, D. M., Izawa, M. R., Cloutis, E. A., et al. 2018, Icarus, 307, 40 [CrossRef] [Google Scholar]
- Barnouin, O. S., Daly, M. G., Palmer, E. E., et al. 2019, Nat. Geosci., 12, 247 [NASA ADS] [CrossRef] [Google Scholar]
- Barucci, M. A., Hasselmann, P. H., Fulchignoni, M., et al. 2019, A&A, 629, A13 [NASA ADS] [CrossRef] [EDP Sciences] [Google Scholar]
- Barucci, M. A., Hasselmann, P. H., Praet, A., et al. 2020, A&A, 637, L4 [CrossRef] [EDP Sciences] [Google Scholar]
- Bennett, C., DellaGiustina, D., Becker, K., et al. 2020, Icarus, 113690 [CrossRef] [Google Scholar]
- Bishop, J. L., Lane, M. D., Dyar, M. D., & Brown, A. J. 2008, Clay Minerals, 43, 35 [CrossRef] [Google Scholar]
- Clark, R. N., & Roush, T. L. 1984, J. Geophys. Res. Solid Earth, 89, 6329 [NASA ADS] [CrossRef] [Google Scholar]
- Clark, R. N., King, T. V. V., Klejwa, M., Swayze, G. A., & Vergo, N. 1990, J. Geophys. Res. Solid Earth, 95, 12653 [NASA ADS] [CrossRef] [Google Scholar]
- Clark, B. E., Binzel, R. P., Howell, E. S., et al. 2011, Icarus, 216, 462 [NASA ADS] [CrossRef] [Google Scholar]
- Cloutis, E. A. 2003, Fuel, 82, 2239 [CrossRef] [Google Scholar]
- Cloutis, E. A., Gaffey, M. J., Smith, D. G., & Lambert, R. S. J. 1990, Icarus, 84, 315 [CrossRef] [Google Scholar]
- Cloutis, E. A., Gaffey, M. J., & Moslow, T. F. 1994, Icarus, 107, 276 [CrossRef] [Google Scholar]
- Cloutis, E., Hiroi, T., Gaffey, M., Alexander, C., & Mann, P. 2011a, Icarus, 212, 180 [NASA ADS] [CrossRef] [Google Scholar]
- Cloutis, E., Hudon, P., Hiroi, T., Gaffey, M., & Mann, P. 2011b, Icarus, 216, 309 [NASA ADS] [CrossRef] [Google Scholar]
- Cloutis, E., Hudon, P., Hiroi, T., & Gaffey, M. 2012, Icarus, 220, 586 [NASA ADS] [CrossRef] [Google Scholar]
- Cloutis, E. A., Pietrasz, V. B., Kiddell, C., et al. 2018, Icarus, 305, 203 [NASA ADS] [CrossRef] [Google Scholar]
- DellaGiustina, D., Kaplan, H. H., Simon, A. A., et al. 2020a, Nat. Astron., 3, 341 [NASA ADS] [CrossRef] [Google Scholar]
- DellaGiustina, D. N., Burke, K. N., Walsh, K. J., et al. 2020b, Science, 370, eabc3660 [CrossRef] [Google Scholar]
- DeMeo, F. E., Binzel, R. P., Slivan, S. M., & Bus, S. J. 2009, Icarus, 202, 160 [NASA ADS] [CrossRef] [Google Scholar]
- Fornasier, S., Hasselmann, P., Deshapriya, J., Barucci, M., et al. 2020, A&A, 644, A142 [CrossRef] [EDP Sciences] [Google Scholar]
- Gaffey, S. J. 1986, Am. Mineral., 71, 151 [Google Scholar]
- Hamilton, V. E., Morris, R. V., Gruener, J. E., & Mertzman, S. A. 2008, J. Geophys. Res. Planets, 113, E12S43 [CrossRef] [Google Scholar]
- Hamilton, V. E., Simon, A. A., Christensen, P. R., et al. 2019, Nat. Astron., 3, 332 [Google Scholar]
- Hamilton, V. E., Kaplan, H., Christensen, P., et al. 2020, A&A, submitted [Google Scholar]
- Horgan, B. H., Cloutis, E. A., Mann, P., & Bell, J. F. 2014, Icarus, 234, 132 [NASA ADS] [CrossRef] [Google Scholar]
- Ito, O. 1992, Energy Fuels, 6, 662 [CrossRef] [Google Scholar]
- Izawa, M. R., Cloutis, E. A., Rhind, T., et al. 2019, Icarus, 319, 525 [CrossRef] [Google Scholar]
- Kaplan, H., Lauretta, D. S., Simon, A. A., et al. 2020a, Science, 370, eabc3557 [CrossRef] [Google Scholar]
- Kaplan, H. H., Hamilton, V. E., Howell, E. S., et al. 2020b, Meteorit. Planet. Sci., 55, 744 [CrossRef] [Google Scholar]
- Kiddell, C. B., Cloutis, E. A., Dagdick, B. R., et al. 2018, J. Geophys. Res. Planets, 123, 2803 [CrossRef] [Google Scholar]
- King, T. V. V., & Ridley, W. I. 1987, J. Geophys. Res. Solid Earth, 92, 11457 [NASA ADS] [CrossRef] [Google Scholar]
- Kokaly, R. F., Clark, R. N., Swayze, G. A., et al. 2017, USGS Publications Warehouse [Google Scholar]
- Lantz, C., Clark, B. E., Barucci, M. A., & Lauretta, D. S. 2013, A&A, 554, A138 [NASA ADS] [CrossRef] [EDP Sciences] [Google Scholar]
- Lauretta, D. S., Balram-Knutson, S. S., Beshore, E., et al. 2017, Space Sci. Rev., 212, 925 [NASA ADS] [CrossRef] [Google Scholar]
- Lauretta, D. S., DellaGiustina, D. N., Bennett, C. A., et al. 2019, Nature, 568, 55 [NASA ADS] [CrossRef] [PubMed] [Google Scholar]
- Monazam, E. R., Breault, R. W., & Siriwardane, R. 2014, Ind. Eng. Chem. Res., 53, 13320 [CrossRef] [Google Scholar]
- Morris, R. V., Lauer Jr. H. V., Lawson, C. A., et al. 1985, J. Geophys. Res. Solid Earth, 90, 3126 [CrossRef] [Google Scholar]
- Nesvorny, D., Jedicke, R., Whiteley, R. J., & Ivezic, Z. 2005, Icarus, 173, 132 [NASA ADS] [CrossRef] [Google Scholar]
- Prince, B. S., Magnuson, M. P., Chaves, L. C., Thompson, M. S., & Loeffler, M. J. 2020, J. Geophys. Res. Planets, 125, e2019JE006242 [CrossRef] [Google Scholar]
- Reuter, D. C., Simon, A. A., Hair, J., et al. 2018, Space Sci. Rev., 214, 54 [NASA ADS] [CrossRef] [Google Scholar]
- Rozitis, B., Ryan, A., Emery, J., et al. 2020, Sci. Adv., 6, eabc3699 [CrossRef] [Google Scholar]
- Schäfer, M., Schäfer, T., Izawa, M. R. M., et al. 2018, Meteorit. Planet. Sci., 53, 1925 [CrossRef] [Google Scholar]
- Scott, E. R. D., Taylor, G. J., Rubin, A. E., Okada, A., & Keil, K. 1981, Nature, 291, 544 [CrossRef] [Google Scholar]
- Sherman, D. M., & Waite, T. D. 1985, Am. Mineral., 70, 1262 [Google Scholar]
- Simon, A., Reuter, D., Gorius, N., et al. 2018, Remote Sens., 10, 1486 [NASA ADS] [CrossRef] [Google Scholar]
- Simon, A. A., Kaplan, H. H., Hamilton, V. E., et al. 2020, Science, 370, eabc3557 [CrossRef] [Google Scholar]
- Yang, B., & Jewitt, D. 2010, AJ, 140, 692 [NASA ADS] [CrossRef] [Google Scholar]
All Tables
All Figures
|
Fig. 1 Bennu global average and end-member spectra. A: low phase angle and 600 m2/spot resolution spectra. Horizontal bars mark the locations of broad absorption features. Vertical bars denote weaker or narrow features. The black curve is the global average spectrum; colors are individual end-member spectra. B: high spatial resolution spectra from the same locations as in panel A. C: spectra from panel A divided by the global average spectrum and with a linear continuum (0.42–2.45 μm) removed. D: spectra from panel B divided by the average of all spectra acquired on the same date. Apparent absorptions are denoted by vertical bars. The pyroxene boulder spectrum is divided by two to fit on the plot (bottom curve). |
| In the text | |
|
Fig. 2 Maps of minor band depths and associated properties, from data collected at low phase angles and low spatial resolution, overlaid on an image base map of Bennu with a pixel scale of 5 cm pixel−1 (Bennett et al. 2020). A: 0.55-μm band. B: 1.05-μm band. C: 1.8-μm band. D: spectral slope from 0.5 to 1.5 μm. E: temperature. F: 2.3-μm band. |
| In the text | |
|
Fig. 3 Bennu’s spectrum compared with laboratory-measured mineral and CC meteorite spectra (Table B.1). A: Bennu’s global averaged spectrum: not a close match with common phyllosilicates or iron-bearing oxide minerals. B: Bennu’s end-member ratio spectra (black curves) without continuum removal: resembles graphite and iron oxides. C: Bennu’s global averaged spectrum: differs from Murchison IOM, Murchison slab, and labeled CC meteorite chip spectra. |
| In the text | |
|
Fig. 4 High spatial resolution spectral maps of the OSIRIS-REx primary sample site. A: Nightingale crater, center marked with a star. B: 0.55-μm band, the deepest on the crater floor. C: 1.8-μm band depths ~2%. D: 2.3-μm band depths ~2.5%. |
| In the text | |
|
Fig. A.1 Signal-to-noise ratios calculated from instrument internal calibration source data and Bennu’s average signal. (A) S/N for the global mapping data set collected at low resolution and low phase angle. (B) S/N for a high-latitude data set with high spatial resolution. (C) S/N for a low-latitude data set with high spatial resolution. |
| In the text | |
|
Fig. B.1 Highest correlations between map pairs. A: 0.55-μm band, which correlates best with the spectral slope. B: 1.05-μm band with temperature. C: 1.4-μm. D: 1.8-μm. E: 2.3-μm bands, which show no strong correlations. F: 1.8- and 0.55-μm bands, which show weak correlation. |
| In the text | |
|
Fig. B.2 Convex hull continuum removal from 1.27 to 2.6 μm. |
| In the text | |
Current usage metrics show cumulative count of Article Views (full-text article views including HTML views, PDF and ePub downloads, according to the available data) and Abstracts Views on Vision4Press platform.
Data correspond to usage on the plateform after 2015. The current usage metrics is available 48-96 hours after online publication and is updated daily on week days.
Initial download of the metrics may take a while.