Fig. 1
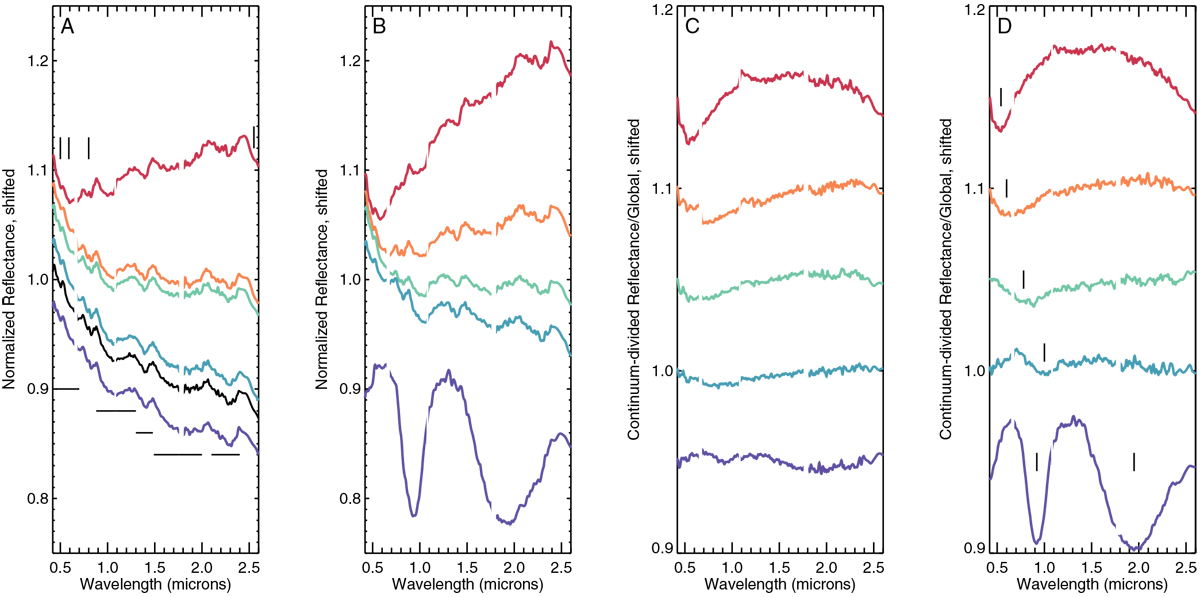
Bennu global average and end-member spectra. A: low phase angle and 600 m2/spot resolution spectra. Horizontal bars mark the locations of broad absorption features. Vertical bars denote weaker or narrow features. The black curve is the global average spectrum; colors are individual end-member spectra. B: high spatial resolution spectra from the same locations as in panel A. C: spectra from panel A divided by the global average spectrum and with a linear continuum (0.42–2.45 μm) removed. D: spectra from panel B divided by the average of all spectra acquired on the same date. Apparent absorptions are denoted by vertical bars. The pyroxene boulder spectrum is divided by two to fit on the plot (bottom curve).
Current usage metrics show cumulative count of Article Views (full-text article views including HTML views, PDF and ePub downloads, according to the available data) and Abstracts Views on Vision4Press platform.
Data correspond to usage on the plateform after 2015. The current usage metrics is available 48-96 hours after online publication and is updated daily on week days.
Initial download of the metrics may take a while.