| Issue |
A&A
Volume 647, March 2021
|
|
|---|---|---|
| Article Number | A135 | |
| Number of page(s) | 18 | |
| Section | Galactic structure, stellar clusters and populations | |
| DOI | https://doi.org/10.1051/0004-6361/202039623 | |
| Published online | 22 March 2021 | |
Metallicities and ages for 35 star clusters and their surrounding fields in the Small Magellanic Cloud⋆
1
Univesidad de Concepción, Departamento de Astronomia, Casilla 160-C, Concepción, Chile
e-mail: This email address is being protected from spambots. You need JavaScript enabled to view it.
2
Nicolaus Copernicus Astronomical Center, Polish Academy of Sciences, Bartycka 18, 00-716 Warsaw, Poland
3
Instituto Interdisciplinario de Ciencias Básicas (ICB), CONICET-UNCUYO, Padre J. Contreras 1300, M5502JMA Mendoza, Argentina
4
Consejo Nacional de Investigaciones Científicas y Técnicas (CONICET), Godoy Cruz 2290, C1425FQB Buenos Aires, Argentina
5
Nicolaus Copernicus Astronomical Center, Polish Academy of Sciences, Rabiańska 8, 87-100 Toruń, Poland
Received:
9
October
2020
Accepted:
14
January
2021
Abstract
Aims. In this work we study 35 stellar clusters in the Small Magellanic Cloud (SMC) in order to provide their mean metallicities and ages. We also provide mean metallicities of the fields surrounding the clusters.
Methods. We used Strömgren photometry obtained with the 4.1 m SOAR telescope and take advantage of (b − y) and m1 colors for which there is a metallicity calibration presented in the literature.
Results. The spatial metallicity and age distributions of clusters across the SMC are investigated using the results obtained by Strömgren photometry. We confirm earlier observations that younger, more metal-rich star clusters are concentrated in the central regions of the galaxy, while older, more metal-poor clusters are located farther from the SMC center. We construct the age–metallicity relation for the studied clusters and find good agreement with theoretical models of chemical enrichment, and with other literature age and metallicity values for those clusters. We also provide the mean metallicities for old and young populations of the field stars surrounding the clusters, and find the latter to be in good agreement with recent studies of the SMC Cepheid population. Finally, the Strömgren photometry obtained for this study is made publicly available.
Key words: methods: observational / techniques: photometric / galaxies: individual: Small Magellanic Cloud / galaxies: star clusters: general / galaxies: abundances
Full Table 6 is available on the Araucaria Project webpage (https://araucaria.camk.edu.pl/) and at the CDS via anonymous ftp to cdsarc.u-strasbg.fr (130.79.128.5) or via http://cdsarc.u-strasbg.fr/viz-bin/cat/J/A+A/647/A135
© ESO 2021
1. Introduction
The Small Magellanic Cloud (SMC) is a dwarf irregular galaxy; together with the Large Magellanic Cloud (LMC) it forms a pair of interacting satellites of the Milky Way. Because of its proximity, it is an ideal environment for various astrophysical studies, of which the chemical evolution is one of the most crucial. Clusters serve as tracers of the chemical evolution of the galaxies. The derived metallicities and ages of stellar clusters generally follow the age–metallicity relation (AMR) of a given galaxy, which allows us to follow the chemical enrichment process of the environment and draw conclusions about the galactic history. This makes the AMR an important tool for understanding the chemical evolution of the galaxies.
There are several methods for determining stellar metallicities. Spectroscopy is a very good tool for obtaining the metallicities of stars; the best for this purpose are high-resolution spectra with wide spectral range and high signal-to-noise ratio. However, it is challenging to get good-quality high-resolution spectra of stars from nearby galaxies. An alternative is the use of low-resolution spectra and the Ca II triplet (CaT). There have been several spectroscopic studies of the SMC star clusters in the literature based on CaT. Da Costa & Hatzidimitriou (1998) obtained spectra of individual red-giant-branch (RGB) stars in seven SMC clusters and calculated the mean metallicities for six of them. They found abnormally low metallicities for Lindsay 113 and NGC 339, suggesting that they have different origins, possibly being formed from infalling unenriched gas, in contrast to the rest of their studied clusters. Carrera et al. (2008) determined metallicities of over 350 RGB stars in 13 fields distributed across the SMC, and for the first time found a spatial metallicity gradient in this galaxy. The average metallicity of the innermost fields was about −1 dex on the Carretta & Gratton (1997) metallicity scale (hereafter the CG97 scale), and decreased when moving toward the outermost regions. They related the observed metallicity gradient with the age gradient because the youngest, most metal-rich stars were concentrated in the central region of the SMC. Parisi et al. (2009) calculated metallicities of 270 individual RGB stars inside and around 16 SMC clusters. They found a mean metallicity for their CaT sample of −0.94 dex on the CG97 scale. Furthermore, they also found that the mean age and metallicity of clusters older than 3 Gyr are 5.8 Gyr and −1.08 dex, while for clusters younger than 3 Gyr these values were 1.6 Gyr and −0.85 dex, respectively, thus confirming the previous findings. They also refuted the hypothesis of Da Costa & Hatzidimitriou (1998) regarding the anomalous nature of Lindsay 113 and NGC 339. Parisi et al. (2014) further improved the AMR from their first work using more accurate photometry obtained for clusters from their sample and utilized it to determine the cluster ages.
Mighell et al. (1998) used archival Hubble Space Telescope (HST) data to study the color–magnitude diagrams (CMDs) of seven SMC clusters. For this purpose they applied two methods, and adopted weighted mean metallicities from both approaches. The first technique was the simultaneous reddening and metallicity (SRM) method, which takes as input the magnitude of the horizontal branch (HB), the color of the RGB at the level of HB, the shape described by either a quadratic relation or higher order polynomial, and the position of the RGB. As a result, the SRM provides simultaneous metallicity and reddening determination. The second method uses the fact that the RGB slope steepens with decreasing metallicity. This dependency can be calibrated for specific colors. Mighell et al. (1998) present this calibration for V versus (B − V), while Mucciarelli et al. (2009) presented these relations for near-infrared JHK bands in four SMC clusters. This method returns metallicity for a given reddening.
The filters C and T1 of the Washington photometric system are very effective for metallicity and age studies (Piatti et al. 2005, 2007a,b; Piatti 2011, 2012). The difference in T1 magnitude between the red clump (RC) stars and the main sequence turn-off point (MSTO) allows us to determine the ages of stellar populations. Metallicity can be estimated by comparing the shape of the RGBs of stellar clusters with published standard fiducial globular cluster RGBs. However, this technique requires an age-dependent correction to metallicities derived for intermediate-age objects, which is the case for the majority of SMC clusters (Parisi et al. 2009).
Metallicity values of stellar clusters can be also obtained directly by fitting theoretical isochrones to the CMDs. For example, Perren et al. (2017) developed the Automated Stellar Cluster Analysis (ASteCA) package, which calculates the synthetic CMD that best matches the observed cluster CMD for a given set of fundamental parameters (metallicity, age, distance modulus, reddening, and mass).
Metallicity also can be calculated based on calibration between [Fe/H], (b − y) and m1 = (v − b)−(b − y) Strömgren colors (Hilker 2000; Dirsch et al. 2000). This relation is well defined for red stars within a certain range of (b − y) colors. The main advantage of this method is that metallicities can be obtained for a large number of individual stars. An early successful application of this method was performed by Grebel & Richtler (1992), among others, for studies of NGC 330. The relation used in that work was later extended toward lower metallicities by Hilker (2000), and adopted by Dirsch et al. (2000) for studies of six LMC clusters and their surrounding fields obtained with 1.54 m Danish Telescope placed in La Silla Observatory, Chile. Calamida et al. (2007) introduced a calibration for red giant stars from old Galactic globular clusters based on (v − y) and (u − y) colors, which have stronger sensitivity to effective temperature than (b − y). Livanou et al. (2013) presented metallicity and age determinations for 15 LMC and 8 SMC star clusters based on the Strömgren data from the Danish Telescope. More recently, Piatti (2018) employed Strömgren photometry from the 4.1 m SOAR telescope (Cerro Pachón, Chile) to investigate four SMC intermediate-age clusters, in their search for hints of multiple stellar populations. The work of Piatti et al. (2019) presents derived metallicities of yellow and red supergiants in nine young LMC and four SMC clusters. In a recent study, Piatti (2020) used metallicity calibration for (v − y)−m1 colors from Calamida et al. (2007) and showed the age effect on Strömgren metallicities, in the sense that younger clusters appear to be more metal poor, and the difference is a quadratic function.
Motivated by these results, we decided to determine metallicities, based on Strömgren photometry, for stars belonging to 35 star clusters and their surrounding fields from the SMC. We also estimated the ages of stellar clusters in our sample using theoretical isochrones. We then constructed the AMR, which allowed us to trace the chemical evolution of the SMC. We also present here photometric measurements for stars from our fields. The metallicities of some clusters calculated from data presented in this work have already been published (e.g., Piatti 2018, 2020; Piatti et al. 2019). We decided to reanalyze them for a several reasons. In this work we apply the metallicity calibration presented by Hilker (2000), as it is calibrated for a wide range of metallicities, and therefore can be used for variety of stellar clusters. To this end, we used direct color–color transformation equations to the standard system, which lowers the errors of the coefficients compared to the calibration method presented by Piatti et al. (2019), among others. Moreover, we rephotometrized images and standardized two of the chips of the camera separately, which is a further improvement. We also used proper motions to reject foreground stars and adopted the new reddening values coming from the recently published reddening maps of the Magellanic Clouds (Górski et al. 2020; Skowron et al. 2021), as well as positions and sizes of clusters from the updated catalog of Bica et al. (2020).
This paper is organized as follows. In Sect. 2 we describe our observations and data reduction pipeline, as well as the selection of stars used for cluster and field metallicity calculation, the adopted reddenings, the metallicity determination procedure based on the two-color Strömgren diagram, and the age estimation procedure. In Sect. 3 we present the results obtained for the distribution of the metallicities of clusters and their surrounding fields in the SMC, as well as the distribution of the clusters’ ages and the resulting AMR. In Sect. 4 we compare our AMR with those found in the literature. Finally, in Sect. 5 we summarize our results and draw the conclusions of this work.
2. Observations and data reduction
The optical images of fields containing star clusters in the SMC in three Strömgren filters (v, b and y) were collected within the Araucaria Project (Gieren et al. 2005) during six nights on 4.1 m Southern Astrophysical Research Telescope (SOAR) placed in Cerro Pachón in Chile, equipped with the SOAR Optical Imager (SOI) camera (program ID: SO2008B-0917, PI: Pietrzyński). Observing nights were divided into two runs. The first was on 17, 18, and 19 December 2008 and the second on 16, 17, and 18 January 2009. The SOI is a mosaic camera composed of two E2V 2k × 4k CCDs (read by four amplifiers). The field of view is 5.26 × 5.26 arcmin2 at a pixel scale of 0.077 arcsec⋅pixel−1. During observations 2 × 2 pixel binning was used resulting in a pixel scale of 0.154 arcsec⋅pixel−1. We observed 29 fields with star clusters in the SMC in total, where fields with NGC 330, NGC 265, and NGC 376 were observed twice. Single images were taken in the air mass range 1.43−1.91, and the average seeing in the three filters was about 1.0 arcsec. Table 1 summarizes information about our data set.
Star clusters in the SMC.
The calibration procedure took into account bias subtraction and flatfield correction. Profile photometry was performed with the standard DAOPHOT/ALLSTAR package (Stetson 1987) using a Gaussian function with spatial variability to define the point spread function (PSF). In the case of dense fields, images were additionally divided into smaller overlapping subframes to further reduce the PSF and background variability. The PSF model was constructed from about 30 to over 200 stars depending on the stellar density of a given image. The master list of stars in a given frame was obtained iteratively by gradually decreasing the detection threshold, and in the last iteration inspected by eye to manually add stars omitted in the automatic procedure. The aperture corrections for each frame were calculated using the DAOGROW package (Stetson 1990), and instrumental CMDs were constructed. The average errors of the photometry were 0.02 mag in V and (b − y) and 0.04 mag in m1 for stars with brightness V < 20 mag. Figure 1 illustrates the precision of our photometry on an example of the NGC 330 observed during the first and third night.
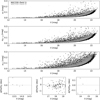 |
Fig. 1. Comparison of photometric precision in two fields of NGC 330 captured during the nights of 17 and 19 December 2008. Three upper panels: photometric errors from DAOPHOT for V, (b − y) and m1 (black points for the field from the first night, gray from the second). Three bottom panels: differences in metallicities determined for the first and second field for clusters, and old and young field giants, respectively. |
The magnitudes and colors of stars were standardized for each chip of the camera separately using the following transformation equations:
where yinst, (b − y)inst, and m1inst are instrumental magnitude and colors; Vstd, (b − y)std and m1std are standard magnitude and colors from the Paunzen (2015) catalog; X is airmass; and ai, bi, ci are transformation coefficients summarized in Table 2. The typical error of the transformation is lower than 0.02 mag and is given in Col. 8 of Table 2, also illustrated as the spread of points in Fig. 2. The astrometric solutions for the images in the y filter were obtained based on Gaia DR2 catalog (Gaia Collaboration 2016, 2018) with subarcsec accuracy.
 |
Fig. 2. Residuals of the transformation to the standard system. Filled circles are for chip 1 and open circles for chip 2. |
Transformation coefficients.
We tested the completeness of our photometry by performing artificial star tests. We used the ADDSTAR routine of the DAOPHOT package to add randomly generated artificial stars to each image in y filter. Their number was about 5% of the number of stars found in a given frame. We created 20 such images for each subframe of each field and performed the profile photometry on them. Next, we added the same list of stars to images in b and v filters and repeated the procedure. We calculated the retrieval rate of artificial stars. The results in every cluster are roughly similar. The retrieval rate for stars brighter than V = 13 mag is about 86% in the y filter, 93% in b, and almost 100% in v. The lower number of retrieved stars in the y filter might be due to the overexposition of stars. Finally, for stars between 13 and 19 mag, the range for which we perform metallicity calculations, completeness is about 100% in all filters and then starts to drop, reaching practically zero for stars fainter than V = 22 mag.
2.1. Selection of cluster members and field stars
An efficient way to separate cluster members from non-members is via the proper motions (PMs) of stars. We cross-matched our master lists of stars with the Gaia DR2 catalog. Unfortunately, the accuracy of Gaia PMs for stars from our fields turned out to be insufficient for reliable membership determination. The average PM error is about 1 mas⋅yr−1 in RA and 0.93 mas⋅yr−1 in Dec, which correspond to about 296 km⋅s−1 and 275 km⋅s−1, if distance to SMC of 62.44 kpc is used (Graczyk et al. 2020). Nevertheless, we used Gaia data to reject galactic foreground stars having significant values of PMs. To determine obvious SMC non-members we used a similar approach to that described in Narloch et al. (2017), among others, where stars are rejected based on their location on the vector point diagram. For all stars in a given cluster field, we calculated mean values and standard deviations of their PMs, μ (Mα, Mδ, Sα, Sδ), and PM errors, σμ (MEα, MEδ, SEα, SEδ). We did not divide stars into magnitude bins because often there were too few stars in a given bin. Next, we selected only stars satisfying the conditions μ ≤ 3 ⋅ S and σμ ≤ ME + 3 ⋅ SE and repeated the procedure. This way galactic foreground stars with high PMs were removed from the input lists.
In the next step, we selected stars enclosed in a certain radius as cluster members. We adopted equatorial coordinates and radii of clusters from updated catalog of Bica et al. (2020). Stars outside this cluster radius were classified as field stars.
We decided to not perform a statistical subtraction of the field stars. The number of stars in most clusters is small and they are located in dense fields which makes it difficult to do statistical subtraction correctly. The small field of view of the camera does not provide good statistics for the field stars, and we cannot be sure that there are no cluster members among them. On the other hand, in star clusters located farther from the SMC center in sparse fields, the contamination of the field stars is negligible. Once the individual metallicities are derived, they can help to disentangle field and cluster members.
2.2. Determination of the reddening toward clusters
In order to correct data for the reddening we used reddening maps published recently by Górski et al. (2020, hereafter G20), and Skowron et al. (2021, hereafter S21), both obtained by calculating the difference of the observed and intrinsic color of the RC stars in the SMC; G20 used the OGLE-III data set while S21 used OGLE-IV data with a much larger field of view. The reddening values for our fields from S21 are systematically smaller than those from G20 (see Table 5). We adopted the average of both maps (E(B − V)GS) as the reddening of the stellar clusters and their surrounding fields. The adopted reddenings are independent of our data. The E(V − I) from the S21 maps were converted into E(B − V) with E(B − V) = E(V − I)/1.318. In the cases of Lindsay 1, Lindsay 113, and NGC 339, which were out of reach of G20 maps, we only applied the reddening from S21. Typical uncertainties of the reddening values in a given field are dominated by systematic errors of the apparent color measurements, equal to about 0.013 mag in G20. In S21 the error on the intrinsic color in the SMC is about 0.016 mag. The average difference between G20 and S21 reddening values for fields studied in this work is about 0.031 mag. Half of this value, rounded up, yielded σE(B − V)GS = 0.016 mag, which was propagated into the systematic error on the derived metallicities resulting from the reddening.
We calculated the reddening values for magnitudes and colors using the following equations: AV = 3.315 ⋅ E(B − V), E(b − y) = 0.772 ⋅ E(B − V), and E(m1) = − 0.269 ⋅ E(B − V) (Schlegel et al. 1998).
2.3. Metallicity calculation based on Strömgren colors
A convenient property of the Strömgren photometric system, which makes it very useful in stellar astrophysics, is the possibility to obtain the metallicity for individual stars nearly independent of their age (e.g., Dirsch et al. 2000). For the calculation of the metallicity we adopted a calibration of the Strömgren m1 − (b − y) two-color relation derived by Hilker (2000). This relation is valid only in the certain color range 0.5 < (b − y) < 1.1. The calibration equation is
![Mathematical equation: $$ \begin{aligned} \mathrm{[Fe/H]} = \frac{m1_0 + a1 \cdot (b-{ y})_0 + a2}{a3 \cdot (b-{ y})_0 + a4} ,\end{aligned} $$](/articles/aa/full_html/2021/03/aa39623-20/aa39623-20-eq2.gif) (1)
(1)
where
Errors on the metallicity determination of individual stars can be calculated by performing full error propagation of Eq. (1) as (Piatti et al. 2019)
![Mathematical equation: $$ \begin{aligned}&\sigma _{\mathrm{[Fe/H]} } = \biggl [ \left(\frac{(b-{ y})_0}{c}\sigma _{a1}\right)^2 + \left(\frac{1}{c}\sigma _{a2}\right)^2 \nonumber + \left( \frac{(b-{ y})_0 \cdot \mathrm{[Fe/H]} }{c}\sigma _{a3}\right)^2 \\&\qquad \quad + \left( \frac{\mathrm{[Fe/H]} }{c}\sigma _{a4}\right)^2 + \left( \frac{(a1 - a3 \cdot \mathrm{[Fe/H]} )}{c}\sigma _{(b-{ y})_0}\right)^2 \\&\qquad \quad + \left( \frac{1}{c}\sigma _{m1_0}\right)^2 \biggr ]^{\frac{1}{2}}, \nonumber \end{aligned} $$](/articles/aa/full_html/2021/03/aa39623-20/aa39623-20-eq4.gif) (2)
(2)
where
 (3)
(3)
The first four terms in Eq. (2) relate to the systematic error, and the remaining two to the statistical error. The dominant error in the Strömgren two-color diagram is σm10. Consequently, the metallicity error is larger for more metal-poor stars than for the more metal-rich correspondents of the same color. The calibration of Hilker (2000) was based on stars, with spectroscopic metallicities on the Zinn & West (1984, hereafter the ZW84 scale).
In the first step of the metallicity determination we selected stars from the dereddened (see Sect. 2.2) color range of 0.5 < (b − y)0 < 1.1. Moreover, only stars having σ(b − y)0 < 0.1 and σm10 < 0.1 (as calculated by DAOPHOT) were accepted for further calculations. Even so, on the m10 − (b − y)0 relation some of the bluest stars from this color range deviate greatly from the well-defined relation for redder stars. In addition, the applied cut in color on the blue edge introduces a bias toward metal-poor stars with larger metallicity errors. To work around this problem, and to eliminate deviating stars, we followed Dirsch et al. (2000) and applied additional selection criteria by drawing a line perpendicular to the base of the RGB and included only stars redder than this line. In the first iteration the mean and unbiased standard deviation for the remaining stars were calculated. Next, we applied 3σ clipping to reject outliers and recalculated the previously obtained values. In the end, the resulting CMDs and m10 − (b − y)0 relations were examined by eye and single stars deviating significantly from either of them were rejected manually and the final values of the mean and the unbiased standard deviation were obtained. As a statistical error of the mean metallicity we adopted unbiased standard deviation divided by the square root of the number of stars used for the calculation.
Dirsch et al. (2000) noted that metallicities measured photometrically are very sensitive to assumed reddening, being the major source of systematic metallicity error. This degeneracy is particularly important in old clusters and field stars. In younger clusters the reddening can be determined quite precisely because the color of the hot main sequence stars depends weakly on the temperature and metallicity. Figure 3 shows how [Fe/H] depends on the E(B − V) for two star clusters: the older Lindsay 113 and the younger the NGC 330. The errors shown in the figure were derived by dividing the unbiased standard deviation of the mean metallicity of a cluster by the square root of the number of stars used for the metallicity calculation. The increase in assumed reddening of 0.01 mag increases the derived metallicity by about 0.06 dex for Lindsay 113 and 0.04 dex for NGC 330, so on average by about 0.05 dex. For a typical error on the adopted reddening (see Sect. 2.2), this corresponds to σ[Fe/H] ≈ 0.08 dex for all clusters and surrounding fields.
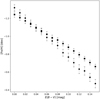 |
Fig. 3. Metallicity derived from Eq. (1) vs. assumed reddening in Lindsay 113 (points) and NGC 330 (squares). |
2.4. Age–metallicity relation for clusters in the SMC
The resulting age–metallicity relation for star clusters studied in this work is illustrated in Fig. 10.
The second source of systematic uncertainty is the precision of the m1 and (b − y) calibration to the standard system. The calibration errors cause a bias of the corresponding metallicity that depends on the color of a star. This effect is more profound for bluer stars, which leads to larger metallicity errors (see Fig. 1 in Dirsch et al. 2000). As described in Sect. 2, the rms errors for the calibration of (b − y) and m1 for all nights are smaller than 0.02 mag, so we assume that this is a maximum uncertainty for these values. The metallicity error for a given cluster or field arising from transformation to the standard system can be derived from simulations. On each night we draw a random number from the normal distribution with standard deviation equal to the r.m.s of a given chip (from Table 2) and add it to the (b − y) colors of stars used for the mean metallicity calculation of a given cluster or field. We do the same for m1 index. We then calculate the new mean metallicity. We repeat this procedure 10 000 times and determine the mean and standard deviation of obtained new mean metallicities from the simulations. We then adopt this standard deviation as the error resulting from the transformation to the standard system for a given stellar cluster or field.
Another source of uncertainty is differential reddening across the field, which might affect stars with different colors in a different way, resulting in broadening of the metallicity distribution and consequently also the age distribution. Due to the small field of view of the SOAR telescope and the resolution of the G20 reddening maps of 3 arcmin, and of the S21 maps of about 1.7 arcmin in the central parts of the SMC, decreasing in the outskirts, we cannot precisely estimate this effect. Consequently, we neglected it.
Finally, the total systematic error of a given mean metallicity is composed of reddening and calibration errors added in squares under the square root. The statistical and systematic errors for the cluster and field samples are given in Tables 3 and 4, respectively.
Star clusters in the SMC.
Fields surrounding star clusters in the SMC.
2.5. Age determination
For the age determination we employed isochrones from the Dartmouth Stellar Evolutionary Database1 (Dotter et al. 2008, hereafter the Dartmouth isochrones) and the Padova database of stellar evolutionary tracks and isochrones available through the CMD 3.3 interface2 (Marigo et al. 2017) calculated with the PARSEC (Bressan et al. 2012) and COLIBRI (Pastorelli et al. 2019) evolutionary tracks (hereafter the Padova isochrones). The Dartmouth isochrones were available only for the 1−15 Gyr isochrones sets, so were too old for most of our clusters. Instead, the Padova isochrones covered all possible ages so most of our results are based on these isochrones. Still, in cases where it was possible, we used both types of isochrones for the comparison. The Dartmouth isochrones seem to better reflect the shape of red giant branches in older clusters, while the Padova isochrones tend to flatten too much near the tip.
During the isochrone fitting procedure, we used the isochrone of a specific metallicity determined from the Strömgren data at a fixed distance to the SMC from Graczyk et al. (2020), where the distance modulus is (m − M)SMC = 18.977 mag. In a few cases (Lindsay 6, Lindsay 113, NGC361, IC1611) the isochrones of the adopted metallicity did not fit well to the CMD of the cluster, so we adopted new values for the reddening from the literature, recalculated the metallicity, and repeated the procedure. The error in age was adopted as a half of the age difference between two marginally fitting isochrones selected around the best fitting isochrone.
2.6. Strömgren photometry
Table 6 presents the first five rows of the compiled catalog of Strömgren photometry for stars from the fields studied in this work. The catalog contains stars for which all three Strömgren vby filters were available, and subsequently the color indices (b − y) and m1 could be calculated. The photometric errors presented in the table result from the DAOPHOT package and the full error propagation of the transformation equations with coefficients from Table 2, given in a separate column.
3. Results
Figures 4–7 present two-color diagrams and CMDs for stellar clusters and their surrounding fields for three cases: clusters with well-populated RGBs (Fig. 4), and young clusters with a few stars (Figs. 5–6) and no stars (Fig. 7) for metallicity calculation. Figure 8 shows the spatial distribution of the mean metallicities of clusters and fields, while Fig. 9 similarly shows the distribution of cluster ages. We summarized our measurements in Tables 3 (clusters) and 4 (fields).
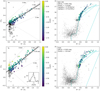 |
Fig. 4. Reddening corrected two-color diagrams and unreddened CMDs for NGC 339 (upper panels) and its surrounding field stars (lower panels). Left panels: stars having photometry in vby filters (black points); stars excluded from metallicity determination (open squares); stars used to calculate the mean metallicity of a cluster and field (color-coded points, where colors represent metallicity distribution); lines of constant metallicity (dashed lines); additional selection criteria drawn after visual inspection of the plot (dotted line); obtained mean metallicities of cluster and field stars (black solid lines); the statistical and systematic errors of the mean metallicity of the cluster (darker and lighter shaded areas). The arrows indicate the reddening vectors. Right panels: Dartmouth and Padova best-fitting isochrones (gray and turquoise dashed lines, respectively) superimposed onto the field CMD, in order to illustrate the position of the cluster against field stars. |
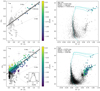 |
Fig. 5. Reddening corrected two-color diagrams and unreddened CMDs for NGC 330 (upper panels) and surrounding field stars (lower panels). Triangles indicate the young field giants. The meaning of other symbols is the same as in Fig. 4. |
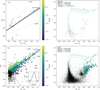 |
Fig. 6. Reddening corrected two-color diagrams and unreddened CMDs for OGLE-CL SMC 68 (upper panels) and surrounding field stars (lower panels). Triangles indicate the young field giants. The meaning of other symbols is the same as in Fig. 4. |
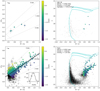 |
Fig. 7. Reddening corrected two-color diagrams and unreddened CMDs for OGLE-CL SMC 99 (upper panels) and surrounding field stars (lower panels). Triangles indicate the young field giants. The meaning of other symbols is the same as in Fig. 4. The turquoise dashed line is a Padova best-fitting isochrone for the adopted metallicity and metallicity of young field giants. |
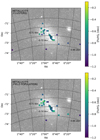 |
Fig. 8. Metallicity map of the field (upper panel) and cluster (lower panel) stars in the SMC. The black cross indicates the center of the SMC at α0 = 12.54 deg; δ0 = −73.11 (Ripepi et al. 2017). North is up; east is left. |
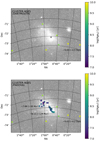 |
Fig. 9. Age map of the cluster stars in the SMC derived from the Dartmouth (upper panel) and Padova (lower panel) theoretical isochrones. The black cross indicates the center of the SMC as in Fig. 8. North is up; east is left. |
There are seven intermediate-age stellar clusters in our sample of 35 SMC clusters (Lindsay 1, 6, 19, 27, and 113; NGC 339 and 361) with well-populated RGBs having between 18 and 93 stars used for metallicity determination. These are well studied objects having many age and metallicity measurements in the literature. For their age determination the Dartmouth and the Padova isochrones were both used. A further six clusters in our sample (NGC 330 and 265; OGLE-CL SMC 45, 69, and 88; IC 1611) are young stellar clusters with between 4 and 12 red giants, which is sufficient for reliable metallicity determination. Only the Padova isochrones were used for their age determination. We indicate these 13 clusters in Fig. 10 with squares. Twelve of the young star clusters studied in this work had less than four, but there was at least one star lying within the cluster radius and fulfilling the criteria for metallicity determination. To the best of our knowledge, the metallicities for OGLE-CL SMC 68, 71, 82, 126, 143, and [BS95] 123 are provided for the first time. NGC 376, IC 1612, Bruck 39, and OGLE-CL SMC 32, 54, and 156 have at least one previous metallicity estimation. Only the Padova isochrones were suitable for their age determination. Clusters from this group are indicated in Fig. 10 with open circles. Finally, there were ten young star clusters (OGLE-CL SMC 49, 50, 61, 78, 99, 128, 129, 142, 144, and 205) for which we have not found any suitable stars for cluster metallicity calculation. Moreover, these clusters have no published metallicities in the literature, the sole exception being OGLE CL-SMC-49 with one such determination. However, we were able to calculate the mean metallicities of the field stars surrounding these clusters. We also estimated the ages of the clusters by employing the Padova isochrones for [Fe/H] = −0.70 dex, which is a value close to the mean metallicity of the SMC (discussed in the next section).
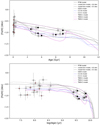 |
Fig. 10. Age–metallicity relation for clusters studied in this work. Clusters with ages derived using Darthmouth isochrones (black squares); clusters with reliable number of stars for metallicity determination (open squares), having ages derived from the Padova isochrones; clusters with 1−4 stars for metallicity calculation with the Padova ages (open circles). Red dots indicate clusters whose metallicity was determined for the first time. Overplotted theoretical models: PT98 bursting model (solid line); closed box model for −0.6 dex and −0.5 dex (dashed and dash-dotted line, respectively); HZ04 model (dotted line); C13-B and C13-C models (blue dashed and dotted lines, respectively); TB09-1, TB09-2, and TB09-3 models (magenta dotted, dashed, and solid lines, respectively). |
3.1. Metallicity distribution for cluster and field stars in the SMC
The upper panel in Fig. 8 presents a metallicity map of the star clusters given in Table 3. The black cross indicates the center of the SMC determined based on the distribution of classical Cepheid variables by Ripepi et al. (2017) (α0 = 12.54 ± 0.01 deg; δ0 = −73.11 ± 0.01 deg). In the map it is clear that the most metal-poor clusters are located in the outskirts of the galaxy, while the more metal-rich ones group close to the SMC central region. The average metallicity of the clusters most distant from the SMC center (Lindsay 1, 6, and 113, and NGC 336) is −1.05 dex with a standard deviation (σ) of 0.10 dex. The average metallicity of three clusters located a bit farther from the elongated central region (NGC 361, Lindsay 19 and 27) is −0.90 dex (σ = 0.13 dex). The average metallicity of all seven outer clusters is −0.99 dex (σ = 0.13 dex). Most of the clusters studied in this work are located along the denser central region of the SMC. Their average metallicity is −0.70 dex (σ = 0.22 dex). Moreover, we can distinguish two groups, one positioned close to the SMC center to the west (hereafter western group) and a more sparse group located where the HI super-shell 304 A is placed (hereafter eastern group). We show these two groups in Fig. 8 with dotted rectangles. Five clusters from the western group (OGLE-CL SMC 49, 50, 61, 78, and 205) had no suitable stars for the metallicity calculation, so no information about their metallicity is available. The average metallicity of ten remaining clusters NGC 265; OGLE-CL SMC 32, 45, 54, 68, 69, 71, 82, 88; and Bruck 39) is −0.70 dex (σ = 0.24 dex). In case of eight clusters from the eastern group (NGC 330 and 376; IC 1611; OGLE-CL SMC 126, 143, and 156) the average metallicity is −0.71 dex (σ = 0.19 dex) where clusters OGLE-CL SMC 99, 128, 129, 143, and 144 were omitted because we had no information about their metallicities. The values for the eastern and western groups agree within the errors.
The lower panel in Fig. 8 presents a map of the mean metallicities of the fields surrounding the studied star clusters given in Table 4. In five cases we studied more than one cluster in the field of view, so the field stars from these regions come from the area around all present clusters. The average metallicity of the old giants used for the metallicity calculation from the surrounding of the three outermost clusters (without Lindsay 113, where there are only a few stars most probably belonging to the cluster) is −0.93 dex (σ = 0.39 dex). For field stars around the three other clusters located closer to the elongated SMC central region it is −0.80 dex (σ = 0.36 dex). The average metallicity of old giants surrounding all six intermediate-age clusters is −0.84 dex (σ = 0.37 dex). The average metallicity of the field stars used for the metallicity calculation lying in the central regions of the SMC is −0.73 dex (σ = 0.45 dex). For the western group it is −0.74 dex (σ = 0.46 dex) and for the eastern −0.71 dex (σ = 0.43 dex), which is a statistically insignificant difference.
The young helium burning giants (HBGs) belonging to the field are common in the central regions of the SMC, but in the outer fields in our sample they are absent, or nearly so. In this population of stars we can expect to observe Cepheid variables. Ripepi et al. (2017) calculated photometric metallicities for 462 Cepheids and found a peak of their metallicity distribution at about [Fe/H] = −0.60 dex. On the other hand, Romaniello et al. (2008) reported [Fe/H] = −0.75 ± 0.02 dex (with dispersion of 0.08 dex) based on high-resolution spectroscopic studies of 14 stars from the SMC. Recently, Lemasle et al. (2017) published metallicities for four SMC Cepheids obtained from high-resolution spectroscopy with average of [Fe/H] = −0.74 dex. The average metallicity of all HBG stars measured by us in the fields around clusters is −0.70 dex (σ = 0.28 dex), which is in excellent agreement with the mentioned studies. The difference between the western (−0.69 dex, σ = 0.26 dex) and the eastern (−0.71 dex, σ = 0.32 dex) group is statistically insignificant.
3.2. Age distribution for clusters in the SMC
Figure 9 shows the age map of studied clusters in the SMC derived from the Dartmouth (upper panel) and Padova (lower panel) isochrones given in Table 3. The rectangles superimposed onto the plot indicate the same spatial groups of clusters discussed in previous subsection. The outermost clusters in our sample are the oldest ones. The logarithm of their ages derived from the Dartmouth isochrones ranges between 9.40 to 9.85 (2.5 to 7.0 Gyr) with the average of 9.65 with σ = 0.16 (∼4.5 Gyr) and from the Padova isochrones between 9.42 to 9.82 (2.6 to 6.6 Gyr) with the average of 9.62 and σ = 0.15 (∼4.2 Gyr). For the central clusters only the Padova isochrones were available. The average logarithm of ages derived from the Padova isochrones for the western group of clusters is 8.11 with σ = 0.26 (∼129 Myr) and for the eastern 7.66 with σ = 0.36 (∼46 Myr). The mean age for both groups of central young clusters is 7.90 with σ = 0.38 (∼79 Myr). The spatial age distribution we obtained closely follows the distribution of young star clusters presented by Glatt et al. (2010, see their Fig. 7) where most of the young clusters are located along the central overdensity and to the east from the center of the SMC where the HI super-shell 304 A is placed.
In order to compare our results with theoretical predictions of the chemical evolution of the SMC, we considered a few models published in the literature. The model of Pagel & Tautvaišvienė (1998, hereafter the PT98 model) predicts intensive star formation and chemical enrichment in the SMC during the initial epoch that brought the metallicity of the galaxy up to about −1.3 dex. This turbulent period was subsequently followed by relative quiescence lasting for about 8 Gyr, to finally be disturbed by rapid burst of chemical enrichment about 3 Gyr ago, which brought the global metallicity up to its current value. The much simpler closed box model of chemical evolution presented in Da Costa & Hatzidimitriou (1998) predicts a gradual increase in star formation and abundances over time. The third model is an AMR derived by Harris & Zaritsky (2004, hereafter the HZ04, model) based on UBVI photometry from the Magellanic Clouds Photometric Survey. The authors’ conclusions are consistent with the PT98 model. They surmised that approximately 50% of the stars in the SMC formed prior to 8.4 Gyr, and that between 8.4 and 3 Gyr ago star formation was not efficient. The next rise in the mean star formation rate occurred during recent 3 Gyr with bursts at ages of 2.5 Gyr, 400 Myr, and 60 Myr, where the first two bumps are consistent with past perigalactic passages by the SMC with the Milky Way. The major merger scenario for the SMC was proposed by Tsujimoto & Bekki (2009, hereafter the TB09 model). It predicts that a major merger occurred ∼7.5 Gyr ago and was calculated for three cases: no merger, TB09-1; one-to-one merger, TB09-2; and one-to-four merger, TB09-3. A quite different formation history is proposed by Cignoni et al. (2013) through the two Bologna models, (C13-B) and Cole (C13-C). They predict fast initial enrichment prior to 9 Gyr ago, then monotonic increase in metallicity between 9 to 4 Gyr with no evidence of metallicity dips, followed by another enrichment at more recent times.
Our AMR presented in Fig. 10 in general is very consistent with the models. The older clusters Lindsay 19, 27, and 113 closely follow the burst of star formation at ∼3 Gyr ago from the PT98 model. NGC 339 and Lindsay 1 are consistent with the PT98 model within the errors, but more closely reflect the TB09-1 or C13-C model suggesting the existence of burst at about 7 Gyr. NGC 361 and Lindsay 6 seem to represent the closed box model the best. Both these clusters have relatively high reddening according to reddening maps, but we adopted much smaller values for the metallicity calculation. This can mean that their position with respect to the SMC might be different from the distance we use in the present study. However, a different distance would change the age, although not the metallicity. Another possibility is that these clusters are located in regions richer in gas and could be chemically enriched during their formation or evolution. The HZ04 model is on average too metal rich for the discussed clusters, which is also true for other literature values derived from photometric or spectroscopic data (see Fig. 11). Only values provided by Perren et al. (2017) closely follow this model at ages older than 2.5 Gyr. Da Costa & Hatzidimitriou (1998) described Lindsay 113 and NGC 339 as anomalous, and suggested that they could have been formed from the infall of unenriched, or less enriched, gas. However, Parisi et al. (2009) showed that these two clusters behave well, but in turn Lindsay 1 appears too metal rich with respect to the PT98 model. We do not see any anomalous behavior of Lindsay 113 or NGC 339, but Lindsay 1 indeed seems to be too metal rich. There is a discrepancy between the ages we determined based on the Dartmouth and Padova databases. For clusters older than about 3 Gyr the Dartmouth isochrones give older ages than the Padova isochrones, and for clusters younger than 3 Gyr the effect is the opposite. Moreover, it seems that the older the cluster is, the larger the age difference becomes for these two sets of isochrones.
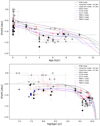 |
Fig. 11. Age–metallicity relation for clusters studied in this work compared with the literature (see Table 5). Values derived from two-color Strömgren diagram (black diamonds); values derived by Perren et al. (2017) using the ASteCA package (open circles); low-resolution spectroscopic metallicities expressed in ZW84 scale (gray squares); high-resolution spectroscopic metallicities in ZW84 scale (blue squares); values obtained from RGB slope method given in ZW84 scale (open triangles); values derived from fitting of theoretical isochrones to optical data (crosses); values derived from fitting of theoretical isochrones to data in Washington system (open crosses). Red squares and open circles indicate measurements from this work presented in Fig. 10 for comparison. Overplotted theoretical models are as in Fig. 10. |
Clusters younger than 1 Gyr in our sample fit equally well all models of chemical evolution, although they appear to be systematically less metal rich than predictions. The results for these clusters are less reliable due to small number of stars used for the metallicity calculation. Parisi et al. (2009) indicated that their metallicity for NGC 330 is significantly more metal poor than the PT98 model prediction. This is also true for our case. NGC 330 deviates greatly from the AMR, although the number of stars used for its metallicity measurement is sufficient for a reliable mean metallicity determination. Furthermore, the metallicity for NGC 376 is extremely low in our AMR. This result however is based on only one star in the first field, and two stars in the second field. Apart from these two outliers, other young star clusters are still characterized by quite large spread in the metallicity. However, overall compliance with the theoretical predictions is satisfactory.
4. Discussion
Figure 11 shows our AMR with superimposed literature values from Table 5: metallicities derived from spectroscopy (low- and high-resolution), Strömgren photometry. and RGB slope method all expressed on the ZW84 scale, as well as values obtained by Perren et al. (2017) with the ASteCA package, and from theoretical isochrone fitting obtained by various authors. Figure 12 presents the comparison between the derived metallicities and their literature counterparts.
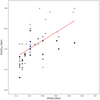 |
Fig. 12. Comparison of the metallicities for star clusters obtained in this work with the literature values from Fig. 11. The red solid line represents the 1:1 relation. |
Reddenings, metallicities and ages of star clusters from the literature.
Strömgren photometry of fields in the SMC.
The metallicities and ages of intermediate-age star clusters in our sample are on average more metal rich and, consequently, younger than most literature values expressed on the same metallicity scale. The possible explanation is the adopted calibration of Strömgren colors with metallicity. Data points based on Strömgren photometry from Livanou et al. (2013), Piatti (2018), and Piatti et al. (2019) were obtained with different calibrations (Hilker et al. 1995; Grebel & Richtler 1992; Calamida et al. 2007, respectively). Hilker (2000) presented an extended calibration of Grebel & Richtler (1992) for cluster and field red giants for a wide range of metallicities (−2.0 < [Fe/H] < 0.0 dex). The original calibration yields higher metallicities for redder stars and lower metallicities for bluer stars in the color range used for metallicity determination. Older clusters and fields have many stars in the color range of 0.5−0.7 mag, consequently their mean metallicities calculated based on the Grebel & Richtler (1992) calibration would be shifted toward more metal-poor values than the Hilker (2000) calibration. On the other hand, metallicities calculated based on the Calamida et al. (2007) calibration, derived based on red giants from Galactic globular clusters in the metallicity range of −2.2 < [Fe/H] < −0.7 dex, gives systematically more metal-poor results than Hilker (2000, see Table 6 in their work). Nevertheless, we decided to use the Hilker (2000) calibration in our study as it is calibrated for the widest range of metallicities, and it can be used for both old metal-poor and young metal-rich giants and supergiants. This choice motivated us to reanalyze the data sets published by Piatti (2018) and Piatti et al. (2019). To keep the uniformity in the analysis, we redid the photometry and calibrated the data using direct color–color transformation equations for the two chips separately, which was an improvement as the zero points of the two chips of the camera differ slightly. For the selection of the cluster members we used the updated catalog of Bica et al. (2020) and the applied additional step of rejecting foreground stars based on their Gaia proper motions. For most of the overlapping clusters (except two) we adopted different reddening values from new reddening maps of G20 and S21. These changes resulted in the selection of different stars for metallicity calculation, which is especially visible in the case of young clusters. The resulting discrepancies between our findings and other studies based on Strömgren photometry are the smallest for metal-poor clusters (∼0.1 dex) and much larger (∼0.4 dex) for clusters more metal rich than −0.70 dex.
The metallicities from low-resolution spectroscopy from Da Costa & Hatzidimitriou (1998) are significantly more metal poor than our results (by ∼0.26 dex), and consequently the clusters are older. Interestingly, the metallicities of NGC 330 from high-resolution spectroscopy agree very well with our determination ((Δ[Fe/H] ≈ −0.06 dex); Spite et al. 1991; Hill 1997; Gonzalez & Wallerstein 1999). Data points from the RGB slope method from Mighell et al. (1998) are also systematically more metal poor than our results (by ∼0.36 dex). Spectroscopic and RGB slope points seem to follow a metallicity dip predicted by the TB09-3 model. Our results do not show such a behavior. The data points from Perren et al. (2017) obtained with the ASteCA package are systematically more metal rich than any other method (in our case Δ[Fe/H] ≈ −0.33 dex). The overall agreement of our results with literature values from isochrones fitting and Washington photometry are satisfactory (Δ[Fe/H] ≈ −0.11 dex and 0.09 dex, respectively).
The conclusion of Livanou et al. (2013) was that there is no indication of an AMR in the SMC. We do not confirm that statement. Despite of a handful of low-metallicity young star clusters like NGC 330, NGC 376, and OGLE-CL SMC 68 and 69, the average metallicity of young clusters is −0.70 dex with σ = 0.22 dex, while for older ones it is −0.99 dex with σ = 0.13 dex.
Piatti et al. (2007a) noticed the tendency that the clusters located in the inner regions of the SMC are younger than those from outer regions, while their mean metallicity and its dispersion are greater close to the SMC center. We confirm both of these observations (see Fig. 8). Furthermore, Piatti (2012) pointed out that stellar populations younger than about 2 Gyr are more metal rich than [Fe/H] ≈ − 0.8 dex and are located in the innermost region confined to an ellipse with a semi-major axis ≲1°. We find that on average the younger stellar populations from this region have metallicities of about or less than −0.8 dex, although there are single fields that break this rule (e.g., NGC 330). Piatti (2012) found that with increasing semi-major axis the field stars became older and more metal poor. We confirm this trend. The AMR presented by Piatti (2012) for the field stars shows two bumps indicating enhanced formation processes at about 2 and 7.5 Gyr. The three oldest clusters in our sample seem to reflect such a bump at about 7 Gyr.
Parisi et al. (2009), and later Parisi et al. (2014), indicated that the PT98 model represents the AMR well for ages < 3−4 Gyr, but fails for older ages. In their AMR star clusters younger than ∼4 Gyr follow closely the burst from the PT98 model, except three clusters fitting better the closed box model of Da Costa & Hatzidimitriou (1998). Very similar behavior is also visible in our AMR. Furthermore, the three oldest clusters from their sample seem to reproduce a burst at about 7.5 Gyr not present in the PT98 model, but predicted by the TB09 set of models. In our AMR the oldest clusters are also represented better by TB09 models.
In the conclusions Perren et al. (2017) indicated that the metallicities obtained with the ASteCA package are on average ∼0.22 dex higher than literature values. In addition, their AMR cannot be successfully matched by any model or exiting empirical determination. We confirm this statement as our findings are also systematically more metal poor than the values from Perren et al. (2017).
5. Summary and conclusions
In this work we presented the analysis of Strömgren photometry of 35 star clusters from the SMC in order to obtain their mean metallicities and ages. We also provided mean metallicities of the fields surrounding the clusters. Metallicities and ages were derived in a consistent manner by using the relation of photometric metallicity and Strömgren colors calibrated by Hilker (2000), which allowed us to compare the obtained results and trace the metallicity and age distribution across the SMC. Moreover, we used for the calculations the most recent reddening maps of G20 and S21, as well as the distance to the SMC derived by Graczyk et al. (2020), which is precise to 2%.
The metallicity distribution of the field stars in the SMC shows a trend typical of irregular galaxies. The more metal-rich stars tend to accumulate close to the central region of the SMC. The farther away from the SMC main body, the more metal poor the stars become. The average metallicity values of the young field giants and supergiants (−0.70 dex) and old field stars (−0.73 dex) are similar within the errors. The average metallicity of HBG stars found by us is in close agreement with the results reported by Ripepi et al. (2017, −0.60 dex), Romaniello et al. (2008, −0.75 dex), or Lemasle et al. (2017, −0.74 dex) for Classical Cepheids, a subset of such stars. The age distribution of clusters in the SMC confirms earlier studies by Carrera et al. (2008) or Glatt et al. (2010), among others, that young stellar clusters distribute along the SMC main body while the intermediate-age clusters are located farther from it.
The two features described above are reflected in the AMR constructed for studied stellar clusters. The majority of clusters analyzed in this paper are young, with very few stars for reliable metallicity and age calculation. Only seven clusters in our sample have well populated RGBs, where the majority of stars for which Strömgren photometry provides metallicity estimates are found. The overall results agree well with theoretical models of chemical enrichment of the SMC, and with previous literature studies. The metallicities for seven star clusters (OGLE-CL SMC 68, 71, 82, 88, 126, 143, and Bruck 39) are provided for the first time, according to our knowledge. Three intermediate-age clusters (Lindsay 19, 27, and 113) reproduce well the burst of chemical enrichment ∼3 Gyr in the PT98 model, while NGC 361 appears to be too metal rich. The three oldest clusters (NGC 339, Lindsay 1 and 6) seem to follow the burst from the TB09 models (predicted at ∼7.5 Gyr). The spread of metallicities for young clusters is quite large, but shows no indication of any trend. We provide the catalog of Strömgren photometry in the SMC available through the webpage of the Araucaria Project and the CDS.
This study proves the usefulness of the Strömgren filters in stellar astrophysics and shows the potential of this photometric system in the future studies of single stars and of large groups of stars like stellar clusters or galaxies.
Acknowledgments
We thank the anonymous referee for valuable comments which improved this paper. The research leading to these results has received funding from the European Research Council (ERC) under the European Union’s Horizon 2020 research and innovation program (Grant agreement No. 695099). We also acknowledge support from the National Science Center, Poland grants MAESTRO UMO-2017/26/A/ST9/00446, BEETHOVEN UMO-2018/31/G/ST9/03050 and DIR/WK/2018/09 grants of the Polish Ministry of Science and Higher Education. We gratefully acknowledge financial support for this work from the BASAL Centro de Astrofisica y Tecnologias Afines (CATA) AFB-170002 and the Millenium Institute of Astrophysics (MAS) of the Iniciativa Cientifica Milenio del Ministerio de Economia, Fomento y Turismo de Chile, project IC120009. M. G. gratefully acknowledges support from FONDECYT POST- DOCTORADO grant 3170703.
Comments on individual clusters
There were a few cases when the reddening value adopted for a given star cluster as a mean of G20 and S21 was unsuitable for age determination. The isochrones for calculated metallicities were not fitting well the observed CMDs. In case of Lindsay 113, E(B − V)GS = 0.058 mag from S21 turned out to be too high. The isochrone of [Fe/H] = − 1.01 dex was not fitting well simultaneously the subgiant and red giant branch, suggesting that a steeper isochrone for lower metallicity is needed. To that end, we adopted E(B − V) = 0.03 mag often used in the literature. Similar situation was in case of NGC 361 and Lindsay 1 having E(B − V)GS = 0.08 mag and 0.049 mag, respectively, for which also E(B − V) = 0.03 mag was adopted. Also in case of IC 1611 having E(B − V)GS = 0.085 mag the isochrone of −0.19 dex did not fit well the main sequence. We adopted E(B − V) = 0.03 mag instead which resulted in [Fe/H] = −0.58 dex.
Perren et al. (2017) reported [Fe/H] = − 0.01 dex for OGLE-CL SMC 45 while Piatti et al. (2019) give −0.85 dex for E(B − V) = 0.03 mag. For E(B − V)GS = 0.063 mag we got [Fe/H] = − 0.31 dex. The differences between this work and Piatti et al. (2019) using the same data could be caused by the choice of different stars for the mean metallicity calculation, photometric and calibration errors, as well as the use of different two-color calibration.
NGC 376 is too metal-poor compared to the literature. This cluster was observed twice during two subsequent nights. For its metallicity calculation we have chosen the same two stars as used in Piatti et al. (2019). The reported mean metallicity of the cluster is −0.55 dex which is much higher value than what we obtained in this work (−0.98 dex). One of the stars is lying in the very center of the cluster and its photometry could be affected by the dense environment. Its metallicity agrees well between the two nights though (−1.20 ± 0.28 dex and −1.18 ± 0.27 dex in the second and third night, respectively). The other chosen star was measured only in the image from the third night, because on the second it fell into the gap between the chips. We obtained for it [Fe/H] = −0.77 ± 0.25, which is also more metal-poor than in Piatti et al. (2019). The isochrone of −0.77 dex seems to fit well the CMD of NGC 376, suggesting that it could be more metal-rich and simultaneously younger (log(AgeP) ≈ 7.50 yr) than the age of best-fitting isochrone of −0.98 dex. Livanou et al. (2013) have only one star in this region of the CMD and in their case it is very metal-poor.
The S21 reddening map gives very small reddening values for OGLE-CL SMC 78 and 82, very different than G20 and other authors. We used the average of S21 and G20 for metallicity calculations, but higher reddening values resulting in higher metallicities and ages would be equally acceptable for these clusters.
References
- Bica, E., Dottori, H., & Pastoriza, M. 1986, A&A, 156, 261 [NASA ADS] [Google Scholar]
- Bica, E., Westera, P., Kerber, L., et al. 2020, AJ, 159, 82 [CrossRef] [Google Scholar]
- Bressan, A., Marigo, P., Girardi, L., et al. 2012, MNRAS, 427, 127 [NASA ADS] [CrossRef] [Google Scholar]
- Calamida, A., Bono, G., Stetson, P. B., et al. 2007, ApJ, 670, 400 [NASA ADS] [CrossRef] [Google Scholar]
- Carrera, R., Gallart, C., Aparicio, A., et al. 2008, ApJ, 136, 1039 [Google Scholar]
- Carretta, E., & Gratton, R. G. 1997, A&AS, 121, 95 [NASA ADS] [CrossRef] [EDP Sciences] [Google Scholar]
- Chantereau, W., Salaris, M., Bastian, N., & Martocchia, S. 2019, MNRAS, 484, 5236 [Google Scholar]
- Chiosi, E., & Vallenari, A. 2007, ASPC, 374, 275 [Google Scholar]
- Chiosi, E., Vallenari, A., Held, E. V., et al. 2006, A&A, 452, 179 [NASA ADS] [CrossRef] [EDP Sciences] [Google Scholar]
- Cignoni, M., Cole, A. A., Tosi, M., et al. 2013, ApJ, 775, 83 [NASA ADS] [CrossRef] [Google Scholar]
- Da Costa, G. S., & Hatzidimitriou, D. 1998, AJ, 115, 1934 [Google Scholar]
- Dias, B., Coelho, P., Barbuy, B., et al. 2010, A&A, 520, A85 [NASA ADS] [CrossRef] [EDP Sciences] [Google Scholar]
- Dirsch, B., Richtler, T., Gieren, W. P., & Hilker, M. 2000, A&A, 360, 133 [NASA ADS] [Google Scholar]
- Dotter, A., Chaboyer, B., Jevremović, D., et al. 2008, ApJS, 178, 89 [Google Scholar]
- Gaia Collaboration (Prusti, T., et al.) 2016, A&A, 595, A1 [NASA ADS] [CrossRef] [EDP Sciences] [Google Scholar]
- Gaia Collaboration (Brown, A. G. A., et al.) 2018, A&A, 616, A1 [NASA ADS] [CrossRef] [EDP Sciences] [Google Scholar]
- Gieren, W., Pietrzyński, G., Bresolin, F., et al. 2005, The Messenger, 121, 23 [Google Scholar]
- Glatt, K., Grebel, E. K., Sabbi, E., et al. 2008, AJ, 136, 1703 [NASA ADS] [CrossRef] [Google Scholar]
- Glatt, K., Grebel, E. K., & Koch, A. 2010, A&A, 517, A50 [NASA ADS] [CrossRef] [EDP Sciences] [Google Scholar]
- Glatt, K., Grebel, E. K., Jordi, K., et al. 2011, AJ, 142, 2 [Google Scholar]
- Gonzalez, G., & Wallerstein, G. 1999, AJ, 117, 2286 [NASA ADS] [CrossRef] [Google Scholar]
- Górski, M., Zgirski, B., Pietrzyński, G., et al. 2020, ApJ, 889, 179 [CrossRef] [Google Scholar]
- Graczyk, D., Pietrzyński, G., Thompson, I. B., et al. 2020, ApJ, 904, 13 [Google Scholar]
- Grebel, E. K., & Richtler, T. 1992, A&A, 253, 359 [NASA ADS] [Google Scholar]
- Harris, J., & Zaritsky, D. 2004, AJ, 127, 1531 [Google Scholar]
- Hilker, M. 2000, A&A, 355, 994 [NASA ADS] [Google Scholar]
- Hilker, M., Richtler, T., & Gieren, W. 1995, A&A, 294, 648 [NASA ADS] [Google Scholar]
- Hill, V. 1997, A&A, 324, 435 [Google Scholar]
- Kučinskas, A., Dobrovolskas, V., Lazauskaitė, R., & Tanabé, T. 2009, BaltA, 18, 225 [Google Scholar]
- Lemasle, B., Groenewegen, M. A. T., Grebel, E. K., et al. 2017, A&A, 608, A85 [NASA ADS] [CrossRef] [EDP Sciences] [Google Scholar]
- Livanou, E., Dapergolas, A., Kontizas, M., et al. 2013, A&A, 554, A16 [NASA ADS] [CrossRef] [EDP Sciences] [Google Scholar]
- Maia, F. F. S., Piatti, A. E., & Santos, J. F. C. 2014, MNRAS, 437, 2005 [NASA ADS] [CrossRef] [Google Scholar]
- Marigo, P., Girardi, L., Bressan, A., et al. 2017, ApJ, 835, 77 [NASA ADS] [CrossRef] [Google Scholar]
- Martocchia, S., Dalessandro, E., Lardo, C., et al. 2019, MNRAS, 487, 5324 [NASA ADS] [CrossRef] [Google Scholar]
- Mighell, K. J., Sarajedini, A., & French, R. S. 1998, AJ, 116, 2395 [NASA ADS] [CrossRef] [Google Scholar]
- Milone, A. P., Marino, A. F., Di Criscienzo, M., et al. 2018, MNRAS, 477, 2640 [NASA ADS] [CrossRef] [Google Scholar]
- Mucciarelli, A., Origlia, L., Maraston, C., & Ferraro, F. R. 2009, ApJ, 690, 1 [NASA ADS] [CrossRef] [Google Scholar]
- Nayak, P. K., Subramaniam, A., Choudhury, S., & Sagar, R. 2018, A&A, 616, A187 [CrossRef] [EDP Sciences] [Google Scholar]
- Narloch, W., Kaluzny, J., Poleski, R., et al. 2017, MNRAS, 417, 1446 [Google Scholar]
- Pagel, B. E. J., & Tautvaišvienė, G. 1998, MNRAS, 299, 535 [NASA ADS] [CrossRef] [Google Scholar]
- Parisi, M. C., Grocholski, A. J., Geisler, D., et al. 2009, AJ, 138, 51 [Google Scholar]
- Parisi, M. C., Geisler, D., Carraro, G., et al. 2014, AJ, 147, 4 [Google Scholar]
- Pastorelli, G., Marigo, P., & Girardi, L. 2019, MNRAS, 485, 5666 [NASA ADS] [CrossRef] [Google Scholar]
- Paunzen, E. 2015, A&A, 580, A23 [NASA ADS] [CrossRef] [EDP Sciences] [Google Scholar]
- Perren, G. I., Piatti, A. E., & Vázquez, R. A. 2017, A&A, 602, A89 [NASA ADS] [CrossRef] [EDP Sciences] [Google Scholar]
- Piatti, A. E. 2011, MNRAS, 416, 89 [Google Scholar]
- Piatti, A. E. 2012, MNRAS, 422, 1109 [Google Scholar]
- Piatti, A. E. 2018, AJ, 156, 5 [CrossRef] [Google Scholar]
- Piatti, A. E. 2020, A&A, 642, A114 [CrossRef] [EDP Sciences] [Google Scholar]
- Piatti, A. E., Sarajedini, A., Geisler, D., et al. 2005, MNRAS, 358, 1215 [NASA ADS] [CrossRef] [Google Scholar]
- Piatti, A. E., Sarajedini, A., Geisler, D., et al. 2007a, MNRAS, 377, 300 [NASA ADS] [CrossRef] [Google Scholar]
- Piatti, A. E., Sarajedini, A., Geisler, D., et al. 2007b, MNRAS, 381, L84 [Google Scholar]
- Piatti, A. E., Geisler, D., Sarajedini, A., et al. 2008, MNRAS, 389, 429 [NASA ADS] [CrossRef] [Google Scholar]
- Piatti, A. E., Pietrzynski, G., Narloch, W., et al. 2019, MNRAS, 483(4), 4766 [NASA ADS] [CrossRef] [Google Scholar]
- Pietrzyński, G., & Udalski, A. 1999, Acta Astron., 49, 157 [Google Scholar]
- Ripepi, V., Cioni, M.-R. L., Moretti, M. I., et al. 2017, MNRAS, 472, 808 [NASA ADS] [CrossRef] [Google Scholar]
- Romaniello, M., Primas, F., Mottini, M., et al. 2008, A&A, 488, 731 [NASA ADS] [CrossRef] [EDP Sciences] [Google Scholar]
- Schlegel, D. J., Finkbeiner, D. P., & Davis, M. 1998, ApJ, 500, 525 [NASA ADS] [CrossRef] [Google Scholar]
- Skowron, D. M., Skowron, J., Udalski, A., et al. 2021, ApJS, 252, 23 [Google Scholar]
- Spite, F., Richtler, T., & Spite, M. 1991, A&A, 252, 557 [Google Scholar]
- Stetson, P. B. 1987, PASP, 99, 191 [Google Scholar]
- Stetson, P. B. 1990, PASP, 102, 932 [NASA ADS] [CrossRef] [Google Scholar]
- Tsujimoto, T., & Bekki, K. 2009, ApJ, 700, 69 [Google Scholar]
- Zinn, R., & West, M. J. 1984, ApJS, 55, 45 [Google Scholar]
All Tables
All Figures
|
Fig. 1. Comparison of photometric precision in two fields of NGC 330 captured during the nights of 17 and 19 December 2008. Three upper panels: photometric errors from DAOPHOT for V, (b − y) and m1 (black points for the field from the first night, gray from the second). Three bottom panels: differences in metallicities determined for the first and second field for clusters, and old and young field giants, respectively. |
| In the text | |
|
Fig. 2. Residuals of the transformation to the standard system. Filled circles are for chip 1 and open circles for chip 2. |
| In the text | |
|
Fig. 3. Metallicity derived from Eq. (1) vs. assumed reddening in Lindsay 113 (points) and NGC 330 (squares). |
| In the text | |
|
Fig. 4. Reddening corrected two-color diagrams and unreddened CMDs for NGC 339 (upper panels) and its surrounding field stars (lower panels). Left panels: stars having photometry in vby filters (black points); stars excluded from metallicity determination (open squares); stars used to calculate the mean metallicity of a cluster and field (color-coded points, where colors represent metallicity distribution); lines of constant metallicity (dashed lines); additional selection criteria drawn after visual inspection of the plot (dotted line); obtained mean metallicities of cluster and field stars (black solid lines); the statistical and systematic errors of the mean metallicity of the cluster (darker and lighter shaded areas). The arrows indicate the reddening vectors. Right panels: Dartmouth and Padova best-fitting isochrones (gray and turquoise dashed lines, respectively) superimposed onto the field CMD, in order to illustrate the position of the cluster against field stars. |
| In the text | |
|
Fig. 5. Reddening corrected two-color diagrams and unreddened CMDs for NGC 330 (upper panels) and surrounding field stars (lower panels). Triangles indicate the young field giants. The meaning of other symbols is the same as in Fig. 4. |
| In the text | |
|
Fig. 6. Reddening corrected two-color diagrams and unreddened CMDs for OGLE-CL SMC 68 (upper panels) and surrounding field stars (lower panels). Triangles indicate the young field giants. The meaning of other symbols is the same as in Fig. 4. |
| In the text | |
|
Fig. 7. Reddening corrected two-color diagrams and unreddened CMDs for OGLE-CL SMC 99 (upper panels) and surrounding field stars (lower panels). Triangles indicate the young field giants. The meaning of other symbols is the same as in Fig. 4. The turquoise dashed line is a Padova best-fitting isochrone for the adopted metallicity and metallicity of young field giants. |
| In the text | |
|
Fig. 8. Metallicity map of the field (upper panel) and cluster (lower panel) stars in the SMC. The black cross indicates the center of the SMC at α0 = 12.54 deg; δ0 = −73.11 (Ripepi et al. 2017). North is up; east is left. |
| In the text | |
|
Fig. 9. Age map of the cluster stars in the SMC derived from the Dartmouth (upper panel) and Padova (lower panel) theoretical isochrones. The black cross indicates the center of the SMC as in Fig. 8. North is up; east is left. |
| In the text | |
|
Fig. 10. Age–metallicity relation for clusters studied in this work. Clusters with ages derived using Darthmouth isochrones (black squares); clusters with reliable number of stars for metallicity determination (open squares), having ages derived from the Padova isochrones; clusters with 1−4 stars for metallicity calculation with the Padova ages (open circles). Red dots indicate clusters whose metallicity was determined for the first time. Overplotted theoretical models: PT98 bursting model (solid line); closed box model for −0.6 dex and −0.5 dex (dashed and dash-dotted line, respectively); HZ04 model (dotted line); C13-B and C13-C models (blue dashed and dotted lines, respectively); TB09-1, TB09-2, and TB09-3 models (magenta dotted, dashed, and solid lines, respectively). |
| In the text | |
|
Fig. 11. Age–metallicity relation for clusters studied in this work compared with the literature (see Table 5). Values derived from two-color Strömgren diagram (black diamonds); values derived by Perren et al. (2017) using the ASteCA package (open circles); low-resolution spectroscopic metallicities expressed in ZW84 scale (gray squares); high-resolution spectroscopic metallicities in ZW84 scale (blue squares); values obtained from RGB slope method given in ZW84 scale (open triangles); values derived from fitting of theoretical isochrones to optical data (crosses); values derived from fitting of theoretical isochrones to data in Washington system (open crosses). Red squares and open circles indicate measurements from this work presented in Fig. 10 for comparison. Overplotted theoretical models are as in Fig. 10. |
| In the text | |
|
Fig. 12. Comparison of the metallicities for star clusters obtained in this work with the literature values from Fig. 11. The red solid line represents the 1:1 relation. |
| In the text | |
Current usage metrics show cumulative count of Article Views (full-text article views including HTML views, PDF and ePub downloads, according to the available data) and Abstracts Views on Vision4Press platform.
Data correspond to usage on the plateform after 2015. The current usage metrics is available 48-96 hours after online publication and is updated daily on week days.
Initial download of the metrics may take a while.