| Issue |
A&A
Volume 647, March 2021
|
|
|---|---|---|
| Article Number | A181 | |
| Number of page(s) | 17 | |
| Section | Extragalactic astronomy | |
| DOI | https://doi.org/10.1051/0004-6361/202038244 | |
| Published online | 30 March 2021 | |
Spatially resolved properties of galaxies with a kinematically distinct core
1
Division of Particle and Astrophysical Science, Nagoya University, Furo-cho, Chikusa-ku, Nagoya 464–8602, Japan
e-mail: This email address is being protected from spambots. You need JavaScript enabled to view it.
2
The Research Centre for Statistical Machine Learning, The Institute of Statistical Mathematics, 10–3 Midori-cho, Tachikawa, Tokyo 190–8562, Japan
Received:
24
April
2020
Accepted:
12
December
2020
Abstract
Aims. Interacting galaxies show unique irregularities in their kinematic structures. By investigating the spatially resolved kinematics and stellar population properties of galaxies that demonstrate irregularities, we can paint a detailed picture of the formation and evolutionary processes that took place during their lifetimes.
Methods. In this work, we focused on galaxies with a specific kinematic irregularity: a kinematically distinct stellar core (KDC). In particular, we considered counter-rotating galaxies in which the core and main body of are rotating in opposite directions. We visually identified 11 MaNGA galaxies with a KDC from their stellar kinematics, and we investigated their spatially resolved stellar and gaseous kinematic properties, namely the two-dimensional stellar and gaseous velocity and velocity-dispersion (σ) maps. Additionally, we examined the stellar population properties, as well as spatially resolved recent star formation histories, using the Dn4000 and Hδ gradients.
Results. The galaxies display multiple off-centred symmetrical peaks in the stellar σ maps. The gaseous velocity and σ maps display regular properties. The stellar population properties and their respective gradients show differing properties depending on the results of the spatially resolved emission line diagnostics of the galaxies, with some but not all galaxies showing inside-out quenching. The star formation histories also largely differ based on the spatially resolved emission line diagnostics, but most galaxies show indications of recent star formation either in their outskirts or core.
Conclusions. We find a distinct difference in kinematic and stellar population properties in galaxies with a counter-rotating stellar core, which depends on its classification using spatially resolved emission line diagnostics.
Key words: galaxies: kinematics and dynamics / galaxies: evolution / galaxies: interactions / galaxies: star formation
© ESO 2021
1. Introduction
The hierarchical growth of galaxies via merging is a commonly accepted pathway of galaxy evolution in the current Λ cold dark matter (ΛCDM) framework for structure formation in the Universe. There are small density fluctuations in the early, homogeneous, and expanding Universe. These perturbations grow over time, and in over-dense regions where the density difference becomes large compared to the under-dense regions, gravitational collapse occurs, creating protogalaxies. Gas in these protogalaxies forms stars to shape the first galaxies, which will further evolve from internal star formation events or external accretion events. One way galaxies undergo such accretion is through galaxy interaction and mergers.
Galaxy interactions are commonly associated with disturbances in galaxy kinematics. In interacting galaxies, we expect to find complex and disturbed kinematics, such as asymmetries and distortions in both the stellar and gaseous velocity fields (Jesseit et al. 2007). By investigating the spatially resolved stellar and gaseous properties of galaxies that show disturbances in their kinematics, we can develop an understanding of the interaction processes that took place during the galaxy’s existence and paint a picture of its formation and evolutionary pathways.
One type of disturbance that may form from galaxy interactions, and the main focus of this paper, is kinematic misalignments within a galaxy, where the galaxy has a core with a distinct rotation. Such a feature is referred to as a kinematically distinct stellar core (KDC). In this work, we focused on a specific type of KDC. Within KDCs, which have a broad definition of having a core and main body misalignment > 30 deg (Krajnović et al. 2011), we selected galaxies with a counter-rotating core, where the core and main body were rotating in opposite directions (=180 deg).
Such a feature is thought to be a relic of an external gas accretion event (Bertola et al. 1992). A significant amount of angular momentum is required to change the orientation of the co-rotating gas and external processes; for example, a major merger (e.g., Bender & Surma 1992; Barnes & Hernquist 1991) is more likely to provide this angular momentum than an internal one.
Investigating the stellar and gaseous properties of both the core and outer region/main body of galaxies with a counter-rotating core will give us an understanding of their formation and evolutionary pathways; however, there have been a number of limitations, mainly related to observational equipment, that have made studies of such properties difficult. Single fiber surveys such as the Sloan Digital Sky Survey (SDSS, York et al. 2000) are limited to the central region of the galaxy, and they cannot paint a picture of the behaviour of the entire galaxy. Similarly, long-slit surveys also have limitations, because while they are able to spatially resolve a target galaxy, this is limited to an elongated region. Recent advances in integral field spectroscopy have given us access to spatially resolved data, which will help us identify and analyse galaxies and their properties. In addition, these advancements have made the mapping of galaxies extending to their outer regions possible, allowing for a more thorough understanding of the galaxy. For example, projects such as SAURON (Bacon et al. 2001) and ATLAS3D (Cappellari et al. 2011) have been successful in spatially resolving local early-type galaxies out to 1 effective radius. This paper uses data from the integral field spectroscopy survey Mapping Nearby Galaxies at Apache Point Observatory (MaNGA, Bundy et al. 2015) to search for and analyse KDCs. In comparison to the projects above, the MaNGA survey can map out effective information out to 1.5 effective radius for two-thirds of its sample and 2.5 effective radius for one third of its sample (Yan et al. 2016), which allows for the coverage of the majority of light, as well as the observation of properties such as gradients and accretion events in galaxy outskirts. MaNGA also has a larger number of galaxies observed over a wider wavelength range compared to the above surveys. This paper is organised as follows: We briefly describe the MaNGA survey, its instrumentation, and sample selection criteria in Sect. 2. In Sect. 3, we describe our data analysis method. We show the physical properties of our sample in Sect. 4. We discuss our results in Sect. 5.
2. Data
The integral field spectroscopic survey MaNGA is one of the three core projects of Sloan Digital Sky Survey IV (SDSS-IV, Blanton et al. 2017). It uses the 2.5 meter telescope at the Apache Point Observatory (Gunn et al. 2006). MaNGA aims to map and acquire spatially resolved spectroscopic observations of 10 000 local galaxies, in a redshift range of 0.01 < z < 0.15, and at an average redshift of 0.037 (Law et al. 2016) by 2020. MaNGA spectra cover a wavelength range of 3600 Å−10 000 Å at a resolution of R ∼ 2000.
The MaNGA target selection is optimised in such a way that galaxies are selected based only on their SDSS i-band absolute magnitude and redshift, and the sample is unbiased based on their sizes or environments. The methodology and extensive efforts taken for this optimisation are highlighted in Wake et al. (2017). We used data from SDSS Data Release 16 (DR16), which includes 4675 unique MaNGA galaxies.
We selected our galaxy sample from our DR16 data by visual classification of 2D galaxy kinematic maps provided by MaNGA. We considered galaxies to be counter-rotating if their stellar velocity maps (a) had a rotational misalignment between the inner and outer galactic regions and (b) the misalignment was large enough that the inner and outer regions were rotating in opposite directions, meaning the core and main body were counter-rotating with respect to each other (=180 deg). We investigated the stellar velocity maps of 4671 of 4675 MaNGA galaxies, and identified eleven galaxies with a kinematically distinct core in their stellar maps. Of these eleven galaxies, we used the spatially resolved BPT diagrams (Baldwin et al. 1981) to identify three galaxies as star forming (SF), five as AGN-hosts, two non-classified, and one ambiguous. We investigated the spatially resolved kinematics, stellar population properties, and star formation histories of these galaxies. Table 1 shows our galaxy sample.
List of galaxy sample.
3. Data analysis
For this work, we focused on investigating the spatially resolved (a) stellar and gaseous kinematics, (b) stellar population properties, and (c) star formation histories of our sample. By investigating (a), we can check for consistency with previous works that suggest galaxies that have undergone an external accretion event are likely to have misaligned stellar and gaseous kinematics (Bertola et al. 1992). We investigated (b) to understand the process via which the KDC may have formed. We investigated (c) to check if the galaxy had recently experienced a star formation episode, and if so, where it occurred.
3.1. Stellar and gas kinematics
The kinematic maps of both stellar and ionised gas were obtained from the output of the data analysis pipeline (DAP) in MaNGA (Westfall et al. 2019). The DAP bins’ adjacent spaxels using the Voronoi binning method of Cappellari & Copin (2003) and the spectra of these spaxels are stacked and averaged to meet the target minimum signal-to-noise (S/N) ratio to obtain accurate stellar kinematics, which in this case is 10. The stellar continuum of each binned spectra was fitted using the penalised pixel-fitting (pPXF) method by Cappellari (2017) and hierarchically clustered MILES templates (MILES-HC, MILES stellar library: Sánchez-Blázquez et al. 2006). The stellar kinematic information (velocity and velocity dispersion) was obtained through this fitting process. Once the fitting was finished, emission line analysis was conducted. Emission line measurements were made in two ways, both from emission line moments and Gaussian emission-models, and they provided us with best-fit continuum models and fluxes and equivalent widths of emission lines. These measurements also gave us the information on the velocity and velocity dispersion, σ. For this work, we utilised Hα (6564 Å) emission lines to investigate gaseous kinematics.
3.2. Stellar population properties
To obtain the stellar population properties, such as metallicity and age, we referred to the MaNGA FIREFLY Value Added Catalogue (MaNGA FIREFLY VAC, Goddard et al. 2017; Parikh et al. 2018), which provides spatially resolved stellar population properties for MaNGA galaxies. The MaNGA FIREFLY VAC uses the full spectral fitting code FIREFLY (Wilkinson et al. 2017) to obtain the stellar population properties. FIREFLY is a χ2 minimisation fitting code that best fits a spectral energy distribution (SED) with a linear combination of simple stellar populations (SSPs). The best-fit combination provides light and mass-weighted ages log (Gyr) and metallicities [Z/H]. This code is applied to the spatially resolved spectra of MaNGA galaxies to give us spatially resolved properties and gradients. Details on how the ages and metallicities were obtained from spectra are written in Goddard et al. (2017). FIREFLY is applied to spectra binned using the Voronoi method with a minimum S/N of 10 per pixel. The on-sky position of each bin (relative to the galactic centre) was used to obtain the effective radius of each bin, and gradients were measured using a least-squares linear regression for data points out to 1.5 Re.
3.3. Star formation histories
To investigate the star formation history of the galaxies with a counter-rotating core, we used the Dn4000 versus HδA diagnostic diagram developed by Kauffmann et al. (2003). This diagnostic is based on two spectral indices, the 4000 Å break and the strength of the Hδ absorption line. The combination of these two indices can tell us about the recent star formation history of galaxies. The two indices are inversely correlated. Galaxies with recent star formation activity have a weaker Dn4000 value and deeper HδA absorption index.
The 4000 Å break is seen due to the accumulation of multiple spectral lines in a narrow wavelength region. This is due to two factors: one being the lack of hot blue stars, and the other being metals in the stellar atmosphere absorbing high energy radiation. Old stellar populations have a large 4000 Å break, and young stellar populations a small one. The Dn4000 index is a parameter defined by Bruzual (1983) as the ratio of the average flux density Fν in the bands 3750−3950 and 4050−4250 Å.
Strong Hδ absorption lines are an indicator of recently ceased starburst activity, with no star formation in the last 0.1−1 Gyr (Goto et al. 2003). The stellar population is dominated by A stars, which have a stronger Hδ absorption than O and B stars. The HδA index is defined as the equivalent width of the Hδ absorption feature in the bandpass 4083−4122 Å.
These indices were available in spatially resolved form for MaNGA galaxies in the MaNGA FIREFLY VAC. For the Dn4000 index, MaNGA FIREFLY VAC uses a narrower continuum band than defined by Bruzual (1983), that is, 3850−3950 and 4000−4100 Å, which was introduced by Balogh et al. (1999) to calculate the index. We therefore followed their method and adopted that for this work. For HδA, MaNGA FIREFLY VAC calculates this index using Eq. (2) of Worthey et al. (1994):
 (1)
(1)
where FIλ is the flux per unit wavelength in the index passband, FCλ the straight-line continuum flux in the index passband, and λ1 and λ2 the wavelength range.
The Dn4000−HδA plane introduced by Kauffmann et al. (2003) is a very powerful diagnostic to estimate star formation activity in a galaxy over the past 1−2 Gyr. In addition, the two indices are largely insensitive to dust attenuation, which can increase the chance of inaccuracies. Whereas Kauffmann et al. (2003) used this plane to identify whether or not a galaxy as a whole has had recent star formation, we used this plane on the spatially resolved indices of each galaxy in our sample to examine if and where the galaxy has experienced recent star forming activity.
4. Results
In the following sections, we discuss our findings with regard to the spatially resolved stellar and gaseous properties and star formation histories.
4.1. Stellar and gaseous properties
Figure 1 shows the SDSS optical images, and Fig. 2 shows the kinematic maps of our entire galaxy sample. From left to right in Fig. 2, the columns show the MaNGA plate-IFU identification, the stellar velocity, stellar σ, Hα velocity, and Hασ maps. We find that most of our samples have a decoupling between the stellar and gaseous velocity maps. Whereas the stellar velocity maps show the feature of a KDC, such a feature is absent from most of the gaseous velocity maps.
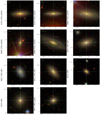 |
Fig. 1. SDSS optical images of the galaxies sampled in this work. The magenta hexagons indicate the surveyed area of the galaxy. |
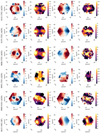 |
Fig. 2. Kinematic maps for our galaxy sample. The first column shows the MaNGA plate-ifu identification, the second the line-of-sight stellar velocity (km s−1), the third the line-of-sight stellar velocity dispersion (km s−1), the fourth the line-of-sight Hα velocity (km s−1), and the fifth the line-of-sight Hα velocity dispersion (km s−1). In the maps, 1 spaxel = 0.5 arcsec. |
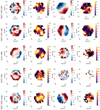 |
Fig. 2. continued. |
We also investigated the rotational direction of the stars and gas, and we noted the differences. The three SF galaxies and one of the AGN-hosting galaxies showed that the rotational direction of gas was opposite to that of the main stellar body, that is, the gas co-rotates with respect to the KDC of these galaxies. The four remaining AGNs showed that the rotational direction of the gas was the same as that of the main stellar body, meaning the gas counter-rotates with respect to the KDC of these galaxies. Of the two unclassified galaxies, the gas is co-rotating with the main body in 8143−1902. 8335−1901 does not have sufficient measurements to make any statement. The ambiguous galaxy 9027−1902 has gas co-rotating with the KDC.
Looking at the velocity dispersion maps, we find that many of the galaxies show two distinct peaks in the stellar σ maps, which decoupled with the Hασ maps. These two peaks have previously been referred to as ‘2-σ galaxies’ (Krajnović et al. 2011), with the two peaks in the stellar velocity dispersion maps lying symmetrically off-centred along the major axis of the galaxy. The Hασ maps show varying behaviour, with the SF galaxies showing peaks close to perpendicular to the stellar σ, and the AGN galaxies showing a central peak. The two unclassified galaxies lack sufficient data to allow us to make any statement about their Hασ maps. The ambiguous galaxy has a slightly off-centred peak.
4.2. Stellar population properties
Table 2 shows the age and metallicity gradients of our sample, with both values provided by the MaNGA FIREFLY VAC, obtained by linearly fitting the data points within 1.5 Re. Figure 3 graphs the gradients. Figure 4 shows the spatially resolved age and metallicity maps of our sample. The left diagram shows the ages, and the right the metallicities. Our results show that in the AGN-hosting galaxies, the ages showed relatively shallow gradients compared to the SF galaxies, and the metallicities showed more steep gradients in the AGN hosts compared to the SF galaxies. Two of the three SF galaxies, 9872−3701 and 8615−1902, show positive gradients, whereas 9027−3702 has a negative gradient. The two unclassified galaxies have positive age and negative metallicity gradients, however 8143−1902 has shallower gradients compared to 8335−1901. The ambiguous galaxy showed gradient steepnesses similar to those of the AGN hosts.
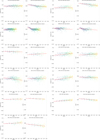 |
Fig. 3. Age (in units of log(Age(Gyr))) and metallicity (in units of [Z/H]) gradients of our sample. Two galaxies are shown per row. The first and third columns show the age gradients, and the second and fourth the metallicity gradients. Red lines indicate gradients from the MaNGA FIREFLY VAC. |
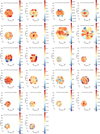 |
Fig. 4. Spatially resolved age (in units of log(Age(Gyr))) and metallicity (in units of [Z/H]) distributions of our sample. Two galaxies are shown per row. The first and third columns show the spatially resolved age distribution, and the second and fourth the spatially resolved metallicity distribution. |
Stellar population gradients given for our galaxy sample within 1.5 Re, obtained from the MaNGA FIREFLY VAC.
4.3. Star formation histories
Figure 5 shows the spatially resolved Dn4000 and HδA distributions of our sample. From left to right, the columns show the Dn4000 and HδA maps. Figure 6 shows the Dn4000 versus HδA plane plotted with their radial profiles. Our results show that two of the three SF galaxies, 9872−3701 and 8615−1902, show distinctly different behaviour compared to the rest of the sample.
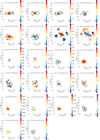 |
Fig. 5. Spatially resolved Dn4000 and HδA distributions of our sample. Two galaxies are shown per row. The first column shows the spatially resolved Dn4000 distribution, and the second the spatially resolved HδA distribution. |
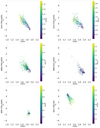 |
Fig. 6. Kauffmann et al. (2003) diagnostic, or Dn4000 as a function of HδA, colour-coded by the effective radius of our sample. Two galaxies are shown per row. |
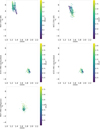 |
Fig. 6. continued. |
We see that 9872−3701 and 8615−1902 have increasing Dn4000 radially outward, with the core showing Dn4000 < 1.5, indicating young stellar populations in the core compared to the outskirts. The rest of the sample shows Dn4000 decreasing radially outward, with Dn4000 > 1.5 in the core, denoting old stellar populations. The outskirts of the AGN-hosting galaxies show younger stellar populations.
We also see that 9027−3703 and 8615−1902 have a high HδA in the core region and lower values in the outskirts. This indicates that recent star formation occurred in the galaxy core. The rest of the sample shows opposing behaviour, with the outskirts displaying a higher HδA than the core. However, the outskirts mostly display a lower value than the cores of the SF galaxies.
Looking at HδA plotted as a function of Dn4000 in Fig. 6, we can see that the radial gradient for 9027−3703 and 8615−1902 shows a decrease in HδA/increase in Dn4000 radially outward, which is opposite to the rest of the sample. The unclassified and ambiguous galaxies do not show much of a gradient in their distributions.
5. Discussion
The properties of kinematically misaligned or decoupled galaxies have been studied using MaNGA data in several works, such as Jin et al. (2016) and Li et al. (2021). However, these works do not focus specifically on the properties of galaxies with a KDC or galaxies with a counter-rotating core.
We investigated the spatially resolved kinematics, stellar population properties, and star formation histories of galaxies with a counter-rotating core. Specifically, these galaxies fall under 2-σ galaxies. We find that the stars and gas of these galaxies are decoupled, and the nature of decoupling differed depending on if the galaxy was identified as SF or as an AGN host. We find that the recent star formation history of these galaxies also differed based on their identification. Due to our small sample size of only five AGN galaxies (three SF, two unclassified, and one ambiguous), these observed properties may not be a trend but simply individual special cases. We hope to conduct this analysis on a greater sample size in future works so that we can make definitive conclusions.
5.1. Kinematic properties
We find that galaxies with a counter-rotating stellar core do not show a similar property in their gas kinematics, that is, the gaseous velocity maps show no kinematically distinct core. There are multiple possible explanations as to why the gaseous kinematics are as such.
A large kinematic misalignment, such as KDCs, is said to be a relic of an external accretion event, such as a galaxy merger (e.g., Bender & Surma 1992; Barnes & Hernquist 1991). When such an event occurs, the accreted material flow towards the centre of the galaxy with an angular momentum different from the main body of the galaxy. The fate of this accreted material may explain why the gas does not show a distinct core. There are a number of explanations as to what happened to the gas. Much of the accreted gas associated with the KDC may be consumed by a merger-induced star formation event that had ceased at the time of observation, leaving no kinematically decoupled gas in the core (Taylor et al. 2018). Another possible explanation is the difference in the collisionless/collisional nature of stellar and gaseous systems (Crocker et al. 2009) in interacting galaxies. In the timescale of galaxy interactions and mergers, stars are collisionless, and hence two systems of counter-rotating stars can co-exist in the same galaxy. However, because gaseous systems are collisional, one of the two systems must dominate over the other.
We also find that the rotational direction of the KDC differs depending on if the galaxy is classified as a SF galaxy or AGN. For the AGN-hosting galaxies, the stars of the KDC are counter-rotating with respect to the gaseous main body of the galaxy, and the gas and stars of the main body are co-rotating. The SF galaxies, on the other hand, have counter-rotating stars and gas, with the KDC co-rotating with the gaseous body. A possible explanation for the SF galaxies having a counter-rotating gaseous body is that the accreted counter-rotating gas is still present in the galaxy, as the dominant system and is contributing to current star formation. Once the accreted counter-rotating gas has been consumed and the star formation ceased, the co-rotating gas dominates, leaving us with observations as the ones seen in the AGN hosts and unclassified galaxy 8143−1902. The ambiguous galaxy demonstrates a rotational behaviour similar to that of the SF galaxies; however, we cannot make any definite statement because it is a single galaxy.
With the velocity dispersion (σ) maps, we find that the stellar and gaseous σ maps show peaks in different locations, with the stellar σ maps having two peaks; however, such a property is not seen in the gaseous σ map. This ‘2-σ’ feature is known to appear in the remnants of major mergers, as shown in simulation works such as Tsatsi et al. (2015). The origins of these peaks are considered to be from gas accretion (see Krajnović et al. 2011) or from merger events (see Crocker et al. 2009).
The gas σ maps show differing properties, with four of the five AGN hosts and the ambiguous galaxy seemingly showing central peaks, and all of the SF galaxies showing peaks perpendicular to the stellar velocity, with two of three showing no central peak. The stellar-gaseous decoupling shown in the AGN galaxies can be explained via the same process as the velocity maps. Since gaseous systems are collisional, the gaseous kinematics of either the accreted gas or the galaxy experiencing accretion must dominate.
The gaseous velocity dispersion distribution in the SF galaxies is distinctly different from those in the galaxies classified as AGN hosting and ambiguous. Among the three galaxies, two do not exhibit a central peak in the gaseous velocity maps. All three galaxies show symmetrical peaks in the outer regions, along the minor axis. The lack of a peak in the central region differs from the distribution of gaseous velocity dispersions of SF galaxies investigated in previous works studying MaNGA galaxies such as Yu et al. (2019), even with effects such as beam smearing taken into account. We also considered the possibility that these peaks coincide with local star formation. However, as shown from the Hα flux diagrams in Fig. 7, the locations of active star formation do not coincide with the peaks. As the peaks lie in the outer regions, we also looked into the local spectra of the areas where the peaks exist in order to check if the peaks were a result of errors or of a poor fit to intrinsic emission lines, which may be a consequence of noise or complex dynamics in the gas. However, the peaks do not coincide with regions of high error, which are masked in Fig. 2. With regard to the fits to emission lines, as we can see from the spectra of the peak Hα regions in Fig. 8, the Hα emission lines do not seem to have poor Gaussian fits for two of the three galaxies. 9872−3701 may be a result of a poor fit. The source of this lack of a central peak is not well understood, and we plan to discuss it in our future work.
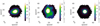 |
Fig. 7. Hα flux diagrams for the three SF galaxies. From left to right: 8615−1902, 9027−3703, 9872−3701. |
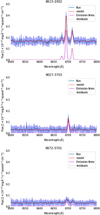 |
Fig. 8. Hα emission line region spectra of the Hα emission line peak spaxels for the three SF galaxies. From top to bottom: 8615−1902, 9027−3703, 9872−3701. |
5.2. Stellar population properties
To understand more about the KDC in each galaxy in our sample, we investigated the spatially resolved stellar population properties, namely the spatially resolved ages and metallicities of the KDC and the surrounding main body of the galaxy, as well as the gradients of these properties. Similar to the kinematics, we find that the gradients differ depending on whether the galaxy is classified as an AGN host or SF.
5.2.1. Age gradients
The steepness of the age gradients differ based on the BPT classification of the galaxies. The galaxies classified as AGN and the one ambiguous galaxy have shallow light-weighted age gradients compared to the SF classified galaxies. These shallow gradients are similar to the average gradients of early-type galaxies observed in the MaNGA survey, such as Goddard et al. (2017), which showed relatively shallow age gradients for early-type galaxies regardless of mass bin.
Two of the three SF galaxies, 9872−3701 and 8615−1902, show positive age gradients, whereas the third, 9027−3703, shows a negative age gradient. These gradients are more significant than the ones found in the AGN hosts. These gradients are not consistent with the age gradients found in Goddard et al. (2017). However, the SDSS morphological classification for 9027−3703 is a spiral galaxy; in such a case, the gradient is consistent with those of late-type galaxies in Goddard et al. (2017).
The two unclassified galaxies both show positive gradients; however, 8143−1902 shows a shallow gradient similar to that of the AGN hosts, whereas 8335−1901 shows a steeper gradient, much like two of the three SF galaxies. Because there are only two samples, we hope future studies will give us more samples from which we can formulate a statement on.
5.2.2. Metallicity gradients
Similar to the age gradients, the metallicity gradients show different properties depending on their classification. Four of the five AGN host galaxies have greater than solar metallicity in the core region, and has a relatively sharp negative metallicity gradient compared to the SF galaxies. This demonstrated gradient is consistent with those shown in previous MaNGA works such as Goddard et al. (2017). These works suggest an ‘outside-in’ formation scenario, where the outer region forms stars first, then the core forms younger, metal-rich stars later. However, this scenario contradicts our findings in the age gradients. The three SF galaxies show no distinct metallicity gradient. The unclassified galaxies both show negative gradients; however, much like their age gradients, 8143−1902 shows a shallower gradient compared to 8335−1901. Whereas 8143−1902 shows a similar age gradient to that of AGN hosts, the metallicity gradient is shallower compared to them, and these are also inconsistent with those shown in works such as Goddard et al. (2017). On the other hand, 8335−1901 shows a steep age gradient similar to that of SF galaxies in our sample, however, the metallicity gradient is not consistent with them. Again, these are only two samples, so we cannot make any statements as to whether or not there is a trend. There is a clear difference in the age and metallicity gradients between the AGN host galaxies and SF galaxies, but the gradients of individual galaxies do not give us a complete picture of their formation scenarios. This discussion will be reserved for a later paper.
5.2.3. Star formation histories
We discuss here the spatially resolved star formation histories of our sample using the using the Dn4000 versus HδA diagnostic diagram developed by Kauffmann et al. (2003). The AGN-hosting galaxies show a gradient where the galaxy is dominated by older stellar populations as indicated by their Dn4000 values, and the stellar population tends to get younger radially outwards. The lack of young stellar populations in the central regions is consistent with our findings in the kinematic maps, because they indicate no recent star formation. These galaxies exhibit an inside-out quenching star formation history, with the outer regions showing the most recent star formation. The SF galaxy 9072−3702 also shows a gradient where the stellar populations get younger radially outwards. However, the Dn4000 values indicate that the galaxy has experienced recent star formation, which is consistent with our findings in the kinematic maps.
All three SF galaxies are dominated by young stellar populations, as indicated by the galaxies being dominated by spaxels with Dn4000 > 1.5. The radial gradients for two of the three galaxies, 9027−3703 and 8615−1902, indicate that the most recent star formation occurred in the core. The gaseous velocity maps show that the gas is counter-rotating with the main stellar body. It is possible that the accreted counter-rotating gas, which is the dominating system for SF galaxies, is still present and forming stars. We require a larger number of samples to investigate whether or not the radial gradients of the star formation history differ depending on if the galaxy is SF or an AGN host. We hope to find more SF galaxies with a counter-rotating core in future studies so that we can make a definitive statement.
The two unclassified galaxies show stellar populations getting younger radially outwards, with the galaxy being dominated by older stellar populations, exhibiting inside-out quenching similar to the AGN host galaxies. The ambiguous galaxy does not show a gradient that follows outside-in or inside-out scenarios.
5.2.4. Comparison with previous studies of 2-σ galaxies
We have compared our findings in stellar population properties with previous works studying KDCs and 2-σ galaxies. The AGN-hosting galaxies show shallow age gradients, and four of the five galaxies show relatively sharp negative metallicity gradients. These results are similar to those found in works studying NGC 448 (e.g., Katkov et al. 2016; Nedelchev et al. 2019), which suggest rapid outside-in star formation. However, the diagnostic diagram indicates an opposing scenario, because the indicators of the most recent star formation lie in the outer region.
For the SF galaxies, two of the three galaxies, 9872−3701 and 8615−1902, show a relatively sharp positive age gradient, with the youngest stars in the core regions, and a shallower metallicity gradient compared to the AGN hosts. The stellar age gradients are consistent with the radial profiles obtained using the Kauffmann diagnostic, where the same two galaxies show the youngest stars in the inner regions, and 9027−3703 shows the youngest stars in the outer regions. The positive gradients are similar to what was seen in previous studies such as Coccato et al. (2011, 2012); however, the shallow metallicity gradients do not seem to match what was found in these studies.
Conducting spectral decomposition on the main and counter-rotating components may tell us more about the radial profiles of each component, as well as their star formation histories. This discussion is reserved for a later paper.
5.2.5. Comparison with galaxies without a counter-rotating core
We compared the results of our sample to AGN-hosting and SF galaxies without a counter-rotating core. The star formation histories of both AGN-hosting and SF galaxies without a counter-rotating core show a radial gradient where the core has an older stellar population compared to the outside regions. As both AGN-hosting and SF galaxies without a counter-rotating core and AGN-hosting galaxies with a counter-rotating core exhibit similar radial gradients that support inside-out quenching of star formation, it may be feasible to say that the SF galaxies with a counter-rotating core have a distinct star formation pathway, and the star formation history on its own cannot distinguish a galaxy with a counter-rotating core from a galaxy without one. These results are consistent with previous studies such as Davies et al. (2001) and McDermid et al. (2015), with the former finding that the core and main body of KDC galaxies have a similar formation history (i.e. indistinguishable from non-KDC galaxies), and the latter finding that kinematics alone do not place a large constraint on evolutionary pathways. Galaxies observed in the MaNGA survey have a higher percentage of inside-out quenching compared to outside-in quenching (Lin et al. 2019), so the distribution of star formation histories of our sample may be due to sampling bias.
6. Conclusion
We visually selected galaxies with a KDC that are also counter-rotating using two-dimensional galaxy kinematic maps, and we analysed their spatially resolved kinematic properties, stellar population properties, and star formation histories. We discovered that these properties may differ depending on whether the galaxies were classified as SF or AGN by their spatially resolved BPT diagrams. Our main findings include the following:
-
The rotational orientation of the galaxy main body and gas differ for SF and AGN galaxies. SF galaxies have counter-rotating stellar main bodies and gases, meaning the counter-rotating core is co-rotating with gas. AGN galaxies have co-rotating stellar main bodies and gases, so the core is counter-rotating with the main body and gas.
-
The stellar velocity dispersion maps indicate that galaxies with a counter-rotating core are 2-σ galaxies, which show two off-centred symmetrical peaks aligned with the major axis. The stellar σ maps and gaseous σ maps are decoupled for both SF and AGN galaxies. The SF galaxies show peaks along the minor axis in the gaseous σ maps, and AGN galaxies show a central peak.
-
The age and metallicity gradients of the AGN host galaxies are similar to those of the average of the field sample of MaNGA galaxies. However, the gradients observed in the SF galaxies showed gradients that are not similar to the average. The AGN galaxies show similar gradients to those of other 2-σ galaxies studied in previous works, whereas the SF galaxies do not.
-
Stellar populations of the sample indicate an inside-out quenching star formation history for most of the galaxies. Two of the SF galaxies show different behaviour, with the core having a younger population compared to the outskirts.
Based on our results, we can see that even though all of our galaxies can be seen as ones with counter-rotating cores, there is a distinct difference in their properties, which may depend on their ionisation source (AGN-host or SF). While the AGN hosts show properties similar to those found in previous works, the SF galaxies show properties not necessarily consistent with previous works. However, due to a small sample size, we cannot make any definitive statements. This difference may be an indicator of the evolutionary stage the galaxy is in of a merger/accretion process. The SF galaxies are in an earlier stage of merger/accretion, where the galaxy has accreted gas with a distinct angular momentum and is forming stars, most recently in the core region, with the same angular momentum as the gas. The AGN host galaxies are in a later stage of merger/accretion, where the accreted external gas has been consumed by star formation activity, leaving only the gas from the initial galaxy. On the other hand, the stars with the same angular momentum as the gas have not yet relaxed, and they have retained their kinematic information. The galaxy has undergone inside-out quenching, possibly as a result of AGN feedback.
Due to the above reasons, in future studies, instead of investigating these galaxies with a counter-rotating core as ‘SF’ or ‘AGN hosts’, it may be more feasible to conduct investigations with the consideration that galaxies with a counter-rotating core fall under a single evolutionary timeline, and the BPT classifications are an indicator of evolutionary stage. However, due to the small sample size, we cannot make a solid conclusion, and an increased sample size and further studies will be required to solidify this statement. Future SDSS data releases expect over 10 000 unique MaNGA targets, so we anticipate a greater number of galaxies with a counter-rotating core on which to conduct this investigation, allowing us to draw stronger conclusions.
Acknowledgments
We would like to thank the anonymous referees for their useful and helpful feedback and comments on the previous version of this manuscript. This work has been supported by JSPS Grants-in-Aid for Scientific Research (17H01110 and 19H05076). This work has also been supported in part by the Sumitomo Foundation Fiscal 2018 Grant for Basic Science Research Projects (180923), and the Collaboration Funding of the Institute of Statistical Mathematics “New Development of the Studies on Galaxy Evolution with a Method of Data Science”.
References
- Bacon, R., Copin, Y., Monnet, G., et al. 2001, MNRAS, 326, 23 [NASA ADS] [CrossRef] [Google Scholar]
- Baldwin, J. A., Phillips, M. M., & Terlevich, R. 1981, PASP, 93, 5 [NASA ADS] [CrossRef] [EDP Sciences] [Google Scholar]
- Balogh, M. L., Morris, S. L., Yee, H. K. C., Carlberg, R. G., & Ellingson, E. 1999, ApJ, 527, 54 [NASA ADS] [CrossRef] [Google Scholar]
- Barnes, J. E., & Hernquist, L. E. 1991, ApJ, 370, L65 [Google Scholar]
- Bender, R., & Surma, P. 1992, A&A, 258, 250 [NASA ADS] [Google Scholar]
- Bertola, F., Buson, L. M., & Zeilinger, W. W. 1992, ApJ, 401, L79 [NASA ADS] [CrossRef] [Google Scholar]
- Blanton, M. R., Bershady, M. A., Abolfathi, B., et al. 2017, AJ, 154, 28 [NASA ADS] [CrossRef] [Google Scholar]
- Bruzual, A. G. 1983, ApJ, 273, 105 [NASA ADS] [CrossRef] [Google Scholar]
- Bundy, K., Bershady, M. A., Law, D. R., et al. 2015, ApJ, 798, 7 [NASA ADS] [CrossRef] [Google Scholar]
- Cappellari, M. 2017, MNRAS, 466, 798 [NASA ADS] [CrossRef] [Google Scholar]
- Cappellari, M., & Copin, Y. 2003, MNRAS, 342, 345 [NASA ADS] [CrossRef] [Google Scholar]
- Cappellari, M., Emsellem, E., Krajnović, D., et al. 2011, MNRAS, 413, 813 [NASA ADS] [CrossRef] [Google Scholar]
- Coccato, L., Morelli, L., Corsini, E. M., et al. 2011, MNRAS, 412, L113 [NASA ADS] [CrossRef] [Google Scholar]
- Coccato, L., Morelli, L., Pizzella, A., et al. 2012, A&A, 549, A3 [Google Scholar]
- Crocker, A. F., Jeong, H., Komugi, S., et al. 2009, MNRAS, 393, 1255 [NASA ADS] [CrossRef] [Google Scholar]
- Davies, R. L., Kuntschner, H., Emsellem, E., et al. 2001, ApJ, 548, L33 [NASA ADS] [CrossRef] [Google Scholar]
- Goddard, D., Thomas, D., Maraston, C., et al. 2017, MNRAS, 466, 4731 [NASA ADS] [Google Scholar]
- Goto, T., Nichol, R. C., Okamura, S., et al. 2003, PASJ, 55, 771 [NASA ADS] [CrossRef] [Google Scholar]
- Gunn, J. E., Siegmund, W. A., Mannery, E. J., et al. 2006, AJ, 131, 2332 [Google Scholar]
- Jesseit, R., Naab, T., Peletier, R. F., & Burkert, A. 2007, MNRAS, 376, 997 [NASA ADS] [CrossRef] [Google Scholar]
- Jin, Y., Chen, Y., Shi, Y., et al. 2016, MNRAS, 463, 913 [NASA ADS] [CrossRef] [Google Scholar]
- Katkov, I. Y., Sil’chenko, O. K., Chilingarian, I. V., Uklein, R. I., & Egorov, O. V. 2016, MNRAS, 461, 2068 [NASA ADS] [CrossRef] [Google Scholar]
- Kauffmann, G., Heckman, T. M., Simon White, D. M., et al. 2003, MNRAS, 341, 33 [NASA ADS] [CrossRef] [Google Scholar]
- Krajnović, D., Emsellem, E., Cappellari, M., et al. 2011, MNRAS, 414, 2923 [NASA ADS] [CrossRef] [Google Scholar]
- Law, D. R., Cherinka, B., Yan, R., et al. 2016, AJ, 152, 83 [NASA ADS] [CrossRef] [Google Scholar]
- Li, S.-L., Shi, Y., Bizyaev, D., et al. 2021, MNRAS, 501, 14 [Google Scholar]
- Lin, L., Hsieh, B.-C., Pan, H.-A., et al. 2019, ApJ, 872, 50 [NASA ADS] [CrossRef] [Google Scholar]
- McDermid, R. M., Alatalo, K., Blitz, L., et al. 2015, MNRAS, 448, 3484 [NASA ADS] [CrossRef] [Google Scholar]
- Nedelchev, B., Coccato, L., Corsini, E. M., et al. 2019, A&A, 623, A87 [NASA ADS] [CrossRef] [EDP Sciences] [Google Scholar]
- Parikh, T., Thomas, D., Maraston, C., et al. 2018, MNRAS, 477, 3954 [NASA ADS] [CrossRef] [Google Scholar]
- Sánchez-Blázquez, P., Peletier, R. F., Jiménez-Vicente, J., et al. 2006, MNRAS, 371, 703 [NASA ADS] [CrossRef] [Google Scholar]
- Taylor, P., Federrath, C., & Kobayashi, C. 2018, MNRAS, 479, 141 [Google Scholar]
- Tsatsi, A., Macciò, A. V., van de Ven, G., & Moster, B. P. 2015, ApJ, 802, L3 [NASA ADS] [CrossRef] [Google Scholar]
- Wake, D. A., Bundy, K., Diamond-Stanic, A. M., et al. 2017, AJ, 154, 86 [NASA ADS] [CrossRef] [Google Scholar]
- Westfall, K. B., Cappellari, M., Bershady, M. A., et al. 2019, AJ, 158, 231 [NASA ADS] [CrossRef] [Google Scholar]
- Wilkinson, D. M., Maraston, C., Goddard, D., Thomas, D., & Parikh, T. 2017, MNRAS, 472, 4297 [NASA ADS] [CrossRef] [Google Scholar]
- Worthey, G., Faber, S. M., Gonzalez, J. J., & Burstein, D. 1994, ApJS, 94, 687 [NASA ADS] [CrossRef] [Google Scholar]
- Yan, R., Bundy, K., Law, D. R., et al. 2016, AJ, 152, 197 [NASA ADS] [CrossRef] [Google Scholar]
- York, D. G., Adelman, J., Anderson, J. E., Jr., et al. 2000, AJ, 120, 1579 [CrossRef] [Google Scholar]
- Yu, X., Shi, Y., Chen, Y., et al. 2019, MNRAS, 486, 4463 [CrossRef] [Google Scholar]
Appendix A: BPT diagrams of sample
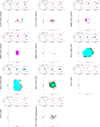 |
Fig. A.1. Spatially resolved BPT diagrams of our sample. Blue spaxels represent SF regions, pink and red spaxels represent AGN regions, green spaxels represent composite regions, and grey spaxels represent ambiguous regions. |
All Tables
Stellar population gradients given for our galaxy sample within 1.5 Re, obtained from the MaNGA FIREFLY VAC.
All Figures
|
Fig. 1. SDSS optical images of the galaxies sampled in this work. The magenta hexagons indicate the surveyed area of the galaxy. |
| In the text | |
|
Fig. 2. Kinematic maps for our galaxy sample. The first column shows the MaNGA plate-ifu identification, the second the line-of-sight stellar velocity (km s−1), the third the line-of-sight stellar velocity dispersion (km s−1), the fourth the line-of-sight Hα velocity (km s−1), and the fifth the line-of-sight Hα velocity dispersion (km s−1). In the maps, 1 spaxel = 0.5 arcsec. |
| In the text | |
|
Fig. 2. continued. |
| In the text | |
|
Fig. 3. Age (in units of log(Age(Gyr))) and metallicity (in units of [Z/H]) gradients of our sample. Two galaxies are shown per row. The first and third columns show the age gradients, and the second and fourth the metallicity gradients. Red lines indicate gradients from the MaNGA FIREFLY VAC. |
| In the text | |
|
Fig. 4. Spatially resolved age (in units of log(Age(Gyr))) and metallicity (in units of [Z/H]) distributions of our sample. Two galaxies are shown per row. The first and third columns show the spatially resolved age distribution, and the second and fourth the spatially resolved metallicity distribution. |
| In the text | |
|
Fig. 5. Spatially resolved Dn4000 and HδA distributions of our sample. Two galaxies are shown per row. The first column shows the spatially resolved Dn4000 distribution, and the second the spatially resolved HδA distribution. |
| In the text | |
|
Fig. 6. Kauffmann et al. (2003) diagnostic, or Dn4000 as a function of HδA, colour-coded by the effective radius of our sample. Two galaxies are shown per row. |
| In the text | |
|
Fig. 6. continued. |
| In the text | |
|
Fig. 7. Hα flux diagrams for the three SF galaxies. From left to right: 8615−1902, 9027−3703, 9872−3701. |
| In the text | |
|
Fig. 8. Hα emission line region spectra of the Hα emission line peak spaxels for the three SF galaxies. From top to bottom: 8615−1902, 9027−3703, 9872−3701. |
| In the text | |
|
Fig. A.1. Spatially resolved BPT diagrams of our sample. Blue spaxels represent SF regions, pink and red spaxels represent AGN regions, green spaxels represent composite regions, and grey spaxels represent ambiguous regions. |
| In the text | |
Current usage metrics show cumulative count of Article Views (full-text article views including HTML views, PDF and ePub downloads, according to the available data) and Abstracts Views on Vision4Press platform.
Data correspond to usage on the plateform after 2015. The current usage metrics is available 48-96 hours after online publication and is updated daily on week days.
Initial download of the metrics may take a while.