| Issue |
A&A
Volume 624, April 2019
|
|
|---|---|---|
| Article Number | A94 | |
| Number of page(s) | 7 | |
| Section | Planets and planetary systems | |
| DOI | https://doi.org/10.1051/0004-6361/201833827 | |
| Published online | 17 April 2019 | |
Connecting substellar and stellar formation: the role of the host star’s metallicity★
1
INAF – Osservatorio Astronomico di Palermo,
Piazza del Parlamento 1,
90134 Palermo,
Italy
e-mail: This email address is being protected from spambots. You need JavaScript enabled to view it.
2
Departamento Física Teórica, Facultad de Ciencias, Universidad Autónoma de Madrid, Campus de Cantoblanco,
28049 Madrid, Spain
Received:
11
July
2018
Accepted:
2
March
2019
Abstract
Context. Most of our current understanding of the planet formation mechanism is based on the planet metallicity correlation derived mostly from solar-type stars harbouring gas-giant planets.
Aims. To achieve a more extensive grasp on the substellar formation process, we aim to analyse in terms of their metallicity a diverse sample of stars (in terms of mass and spectral type) covering the whole range of possible outcomes of the planet formation process (from planetesimals to brown dwarfs and low-mass binaries).
Methods. Our methodology is based on the use of high-precision stellar parameters derived by our own group in previous works from high-resolution spectra by using the iron ionisation and equilibrium conditions. All values were derived in an homogeneous way, except for the M dwarfs where a methodology based on the use of pseudo equivalent widths of spectral features was used.
Results. Our results show that as the mass of the substellar companion increases the metallicity of the host star tends to lower values. The same trend is maintained when analysing stars with low-mass stellar companions and a tendency towards a wide range of host star’s metallicity is found for systems with low-mass planets. We also confirm that more massive planets tend to orbit around more massive stars.
Conclusions. The core-accretion formation mechanism for planet formation achieves its maximum efficiency for planets with masses in the range 0.2–2 MJup. Substellar objects with higher masses have higher probabilities of being formed as stars. Low-mass planets and planetesimals might be formed by core-accretion even around low-metallicity stars.
Key words: techniques: spectroscopic / stars: abundances / stars: late-type / planetary systems
Table A.1 is only available at the CDS via anonymous ftp to cdsarc.u-strasbg.fr (130.79.128.5) or via http://cdsarc.u-strasbg.fr/viz-bin/qcat?J/A+A/624/A94
© ESO 2019
1 Introduction
Exoplanetary science has succeeded in discovering an astonishing diversity of planetary systems. The role of the host star’s metallicity in planet formation has been largely discussed, with the finding that the frequency of giant planets is a strong function of the stellar metallicity (Gonzalez 1997; Santos et al. 2004; Fischer & Valenti 2005). The planet-metallicity correlation is usually interpreted in the framework of the core-accretion model (e.g. Pollack et al. 1996) as the final mass of cores via oligarchic growth increases with the solid density in proto-planetary discs (Kokubo & Ida 2002).
Initially found for gas-giant planets around solar-type stars (Gonzalez 1997; Fischer & Valenti 2005), many works have tried to probe whether the gas-giant planet metallicity correlation also holds for other kind of stars as well as other types of substellar objects, such as low-mass planets (Ghezzi et al. 2010b; Mayor et al. 2011; Sousa et al. 2011; Buchhave et al. 2012; Buchhave & Latham 2015), brown dwarfs (Sahlmann et al. 2011; Ma & Ge 2014; Mata Sánchez et al. 2014; Maldonado & Villaver 2017), stars with debris discs (Beichman et al. 2005; Chavero et al. 2006; Greaves et al. 2006; Bryden et al. 2009; Kóspál et al. 2009; Maldonado et al. 2012, 2015b; Gáspár et al. 2016), evolved (subgiant and red giant) stars (Sadakane et al. 2005; Schuler et al. 2005; Hekker & Meléndez 2007; Pasquini et al. 2007; Takeda et al. 2008; Ghezzi et al. 2010a; Maldonado et al. 2013; Mortier et al. 2013; Jofré et al. 2015; Reffert et al. 2015; Maldonado & Villaver 2016), and low-mass (M dwarf) stars (e.g. Neves et al. 2013), or if there are differences in the host star metallicity when close-in and more distant planets are present in the system (Sozzetti 2004; Maldonado et al. 2018; Wilson et al. 2018). It should be noted that most of these references refer to radial velocity planets.
As is clear from the references above, previous works focus on particular types of stars and planets and, to the very best of our knowledge, a global view of the planet-metallicity correlation and its implications on the planet formation process is still missing. This is precisely the goal of this work in which we analyse in the most homogeneous possible way a large sample of stars harbouring the full range of possible outcomes of the planet formation process (from debris discs to massive brown dwarfs) and without any restriction of the host star’s spectral type (from M dwarfs to early-F) or evolutionary status (from main sequence to giants). The analysis is completed with literature data of low-mass binary stars in order to set the results into a general context.
The paper is organised as follows. Section 2 describes the stellar sample. The completeness of the planet host subsample is analysed in Sect. 3. The analysis of the host star metallicities as a function of the substellar companion mass and the mass of the host star is performed in Sect. 4. The results are discussed in the context of current planet formation models in Sect. 5. A comparison with the results from the Kepler mission is performed in Sect. 6. Our conclusions follow in Sect. 7.
Architecture of the planetary systems in our stellar sample.
2 Stellar sample
Our stellar sample is selected from our previous works (Maldonado et al. 2012, 2013, 2015a,b, 2018; Maldonado & Villaver 2016, 2017), which can be consulted for further details. Briefly, high-resolution échelle spectra of the stars were obtained from two-to-three-metre class telescopes or obtained from public archives. Basic stellar parameters (Teff, log g, microturbulent velocity ξt, and [Fe/H]) were determined by using the code TGVIT1 (Takeda et al. 2005), which implements the iron ionisation, match of the curve of growth, and iron equilibrium conditions. Stellar age, mass, and radius were computed from HIPPARCOS V magnitudes (ESA 1997) and parallaxes (van Leeuwen 2007), when available, using the code PARAM2 (da Silva et al. 2006), together with the PARSEC set of isochrones (Bressan et al. 2012). For some planet hosts where the PARAM code failed to give a reasonable value, we took the mass values from the NASA exoplanet archive (specifically from the summary of stellar information table, for all stars but KOI 415 for which we took the value from the KOI stellar properties table). For the M dwarfs a different methodology was used. The analysis is based on the use of ratios of pseudo-equivalent widths of spectral features, which are sensitive to the effective temperature and the stellar metallicity (Maldonado et al. 2015a). Stellar masses and luminosities for M dwarfs were obtained from the derived temperatures and metallicities by using empirical calibrations.
The total number of stars in our sample amounts to 551. It is composed of 71 F-type stars, 261 G-type stars, 166 K-type stars, and 53 early Ms. Regarding their evolutionary state, 373 are in the main sequence, 63 are classified as subgiants, and 115 are giants.
The different architectures of the planetary systems harboured by our sample (type and number of substellar objects) are shown in Table 1, while Fig. 1 shows the Hertzsprung–Russell (HR) diagram of the stars analysed. Our sample is mainly composed of “mature” planetary systems as only ~7% of our stars have estimated ages younger than 500 Myr.
3 Sample completeness
A deep analysis of the completeness or detectability of our planet host sample is difficult to overcome as our targets are not selected from any particular exoplanet survey. Indeed, they were initially selected to address different individual aspects of the planet formation process (presence of discs, planet formation around evolved stars, brown dwarf versus planet formation, hot versus cool planets). Our planet host sample includes targets from different radial velocity surveys, such the HARPS search for southern extra-solar planets (Pepe et al. 2004), the Anglo-Australian planet search (Tinney et al. 2001), the N2K survey (Fischer et al. 2005), the UCO/Lick survey (Hekker et al. 2006), the PennState-Toruń Centre for Astronomy Planet Search (Niedzielski & Wolszczan 2008), the retired A stars project (Johnson et al. 2007), or the list of stars with brown dwarf companions by Ma & Ge (2014) and Wilson et al. (2016) among others. In other words, our planet host sample comes from a wide variety of planet search programmes with (most likely) different selection criteria, sensitivities, and biases, sampling significantly different regions of the HR diagram.
On the other hand, the comparison sample is mainly drawn from the HIPPARCOS catalogue (ESA 1997) and was chosen to cover similar stellar parameters as the stars with detected planets. For the sake of completeness, we give in Table A.1 the basic properties of the full sample of stars covered here. Further details can be found in our previous works (see references above).
In orderto estimate the detectability limits of our planet hosts, we proceeded as follows. For each star we searched for its corresponding radial velocity curve. Whenever possible, radial velocity data was taken from the NASA Exoplanet Archive3. Otherwise, we searched for the data in the corresponding discovery’s paper. We were able to recover the radial velocity series for 89.6% of our stars with planets. We subtracted the contribution of the known planets to each radial velocity data set by fitting a keplerian orbit using the code rvlin4 (Wright & Howard 2009). The fits were done by fixing the planetary period to the published values. When several planets were present around the same star, we subtracted them in a sequential way. We took into account the fact that data obtained with different instruments might be available for the same star. Once the contributions for the known planets have been removed from the radial velocity data sets, we considered the rms of the residuals to be representative of our measurement uncertainty (e.g. Endl et al. 2001).
For each planet host we computed the expected radial velocity semi-amplitude due to the presence of different types of planets considering circular orbits, as usually done in the literature (see e.g. Mayor et al. 2011, and references therein). We also note that it has been shown that even eccentricities as high as 0.5 do not have a strong influence on the planet detection’s limits (Endl et al. 2002; Cumming & Dragomir 2010). We sampled the planetary mass space in logarithmic space, with values ranging from 0.005 to 80 MJup. Regarding the orbital periods, we sampled the orbital frequencies (also in logarithmic space) from periods from one to 104 days. For each planet we computed the expected radial velocities keeping the same time as the original observations. A total of eleven realisations of the radial velocity, each simulation corresponding to a different phase offset (from 0 to 2π), were performed. We considered a planet to be detectable around a given star if the rms of the planet’s expected radial velocity is larger than the rms of the stellar radial velocity residuals in each of the simulated phases (Galland et al. 2005; Lagrange et al. 2012; Meunier et al. 2012). We are aware that this is a “conservative” approach, since it might overestimate the detection limits for some periods. It is, however, a fast and robust method, ideal for achieving a quick look and for obtaining an efficient determination of the detection limits (Meunier et al. 2012). It should be noted that for the scope of this work a conservative approach should be preferred in order to obtain robust conclusions.
Figure 2 shows the derived detection probability curves. They show for each period the percentage of stars from our sample for which planets with the corresponding minimum mass might be detected, that is, planets located in the region above the p% curve can be detected in p% of our stars.
Several main conclusions can be drawn from this plot: (i) first, most of the long-period planets (P > 100 days) are detectable in approximately more than 60–80% of our targets. Only for planets with periods longer than ~2000 days with a massof the order of few Jupiter masses and lower does our detectability fraction decrease to ~40% and below; (ii) low-mass planets, on the other hand, are detectable only in a small fraction of stars, between 2 and 20%; (iii) finally, it can be seen that planets with the mass of Jupiter and short periods are detectable in practically all stars.
As noted before, our approach is quite conservative, so it is not surprising that some planets are actually located in the region under the 2% probability curve. We will discuss at length the implications of these findings in our analysis in the next sections.
Figure 3 shows the detectability limits for different subsamples of interest (see Sect. 4). In addition to the conclusions from the previous figure, we see that the detectability curves for surveys aiming to detect low-mass planets are clearly shifted towards lower planetary mass companions, as expected. On the other hand, surveys of stars with brown dwarfs and especially surveys of giant stars show significantly higher detection limits. Stars with cool and hot Jupiters show nearly identical detection curves. Finally, we can see that we are mostly insensitive to the presence of small planets (especially evident in the case of surveys around evolved stars), which demonstrates the need for dedicated, intensive long-term surveys (and probably the development of specific techniques to deal with the stellar noise problem) in order to detect this kind of planet.
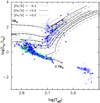 |
Fig. 1 Luminosity versus Teff diagram for the stars analysed. Stars with discs are plotted as green whilst stars without discs are shown in blue. Stars with planets are shown as filled circles and stars with companions in the brown dwarf regime are shown in filled stars. Some evolutionary tracks ranging from 0.7 to 3.0 solar masses from Girardi et al. (2000) are overplotted. For each mass, three tracks are plotted, corresponding to Z = 0.008 ([Fe/H] = −0.4 dex, dotted lines), Z = 0.019 ([Fe/H] = +0.0 dex, solid lines), and Z = 0.030 ([Fe/H] = +0.20 dex, dashed lines). |
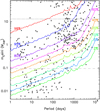 |
Fig. 2 Minimum mass versus planetary period diagram. Substellar companions analysed in this work are shown in grey circles. Detection probability curves are superimposed with different colours. Horizontal dashed lines indicate the standard mass loci of low-mass planets, and gas-giant planet companions. |
4 Analysis
Figure 4 compares the cumulative distribution function of the stellar metallicity of the different stars analysed in this work. The stars have been divided into stars hosting hot Jupiters (if planets are located at distances smaller than 0.1 au), stars hosting cool distant-gas-giant planets, giant stars with planets, stars harbouring low-mass brown dwarfs (MC sin i < 42.5 MJup), stars with high-mass brown dwarfs (MC sin i > 42.5 MJup), stars harbouring only low-mass planets (MC sin i < 30 M⊕), and stars hosting only debris discs. The figure shows that while the metallicity distribution of stars with hot and cool gas-giant planets are shifted towards high metallicity values, this is not the case for the other samples, which show metallicity distributions consistent with those of the comparison sample (i.e. stars without substellar companions).
Figure 5 shows the host star metallicity as a function of the (minimum) mass of the substellar companion. Colours and symbols indicate the mass of the host star. The figure clearly shows a tendency towards lower metallicity of the host star as the mass of the substellar companion increases. The figure also shows that more massive planets tend to orbit around more massive stars. It is clear from the figure that there is a lack of planets around stars with metallicities lower than approximately −0.4 dex. Stars with metallicities below this limit only harbour substellar companions in the brown dwarf regime. We note that this result refers to our sample and several planetary companions around more metal poor stars have been found.
Our results suggest that there is a non-universal planet formation mechanism. Different mechanisms may operate altogether and their relative efficiency change with the mass of the substellar object that is formed. For substellar objects with masses in the range 30 M⊕–1 MJup, high host star metallicities are found, suggesting that these planets are mainly formed by the core-accretion mechanism. As we move towards more massive substellar objects, the range of the host star metallicities increases towards more negative values, suggesting that a non-metallicity-dependent formation mechanism, such as gravitational instability or gravoturbulent fragmentation, might be at work.
In a recent work, Schlaufman (2018) computed the mass at which substellar companions no longer preferentially orbit metal-rich stars, finding that while objects with masses below 10 MJup orbit metal-rich stars, substellar companions with masses larger than 10 MJup do not orbitmetal-rich stars. We believe that our results are compatible with the findings by Schlaufman (2018) showing that the most massive substellar objects tend to form like stars. However, the results by Adibekyan (2019) do not support previous claims about the different formation mechanisms of planets with masses above and below 4 MJup although they suggest that planets of the same (high) mass might be formed through different channels depending on the disc mass.
Figure 6 shows the orbital period of the substellar companions as a function of the (minimum) mass of the substellar companions. Different colours indicate the eccentricity. The figure shows that the more massive substellar companions show larger periods and eccentricities (P > 100 days, e > 0.05). On the other hand, less massive companions have shorter periods and a wider range of eccentricities.
Putting together the trends from Figs. 5 and 6, it seems that as we move towards more massive planetary companions: (i) their host stars show a wider (towards negative values) range of metallicities and higher stellar masses; (ii) planets (or brown dwarfs) show longer periods and higher eccentricities. The differences in period and eccentricity distribution between both types of planets might be indicative of a different formation mechanism. In addition, the trend with the host star metallicity suggests that the higher the mass of the substellar companion, the higher the probability that it is formed by a non-metallicity-dependent formation mechanism. This general trend explains many of the correlations between the host star’s metallicity and planetary properties discussed in recent works.
-
More massive stars host more massive planets. It has been noticed that giant stars host more massive planets than their main sequence counterparts (e.g. Johnson et al. 2007; Lovis & Mayor 2007; Maldonado et al. 2013), although this result should be taken with caution as the detection of small planets around evolved stars is hampered by the large levels of stellar jitter in these stars (e.g. Niedzielski et al. 2016). We note that in our sample, stars in the mass range 1.5–2 M⊙ host onlyplanets with masses around 1 MJup, while for stars more massive than 2 M⊙ planets are more massive than 2 MJup. This trend might reflect a correlation between disc gas masses and giant planet masses (Alibert et al. 2011; Mordasini et al. 2012) as high-mass stars are likely to harbour more massive protoplanetary discs (e.g. Natta et al. 2000). In this scenario giant planet formation can occur in low metallicity but high-mass protoplanetary discs as the factor driving the planet formation process is the amount of metals in the disc (e.g. Ghezzi et al. 2018). The metallicity effect would depend on the mass of the disc, being the minimum metallicity required to form a massive planet lower for massive stars. Ghezzi et al. (2018) found that the relation between the amount of metals in the protoplanetary disc and the formation of giant planets does almost follow a linear relationship. The lack of a clear planet-metallicity correlation found for giant stars might be explained by the fact that they host more massive planets and these planets might find a way in their more massive planetary discs to bypass the core-accretion mechanism and form more like stars. Finally, we note a tendency of more massive giant stars with substellar companions to have higher metallicities in agreement with previous works (Maldonado et al. 2013; Jofré et al. 2015).
-
Trends in brown dwarfs hosts. Ma & Ge (2014) and Mata Sánchez et al. (2014) showed that unlike gas-giant planet hosts, stars with brown dwarfs do not show metal enrichment. Maldonado & Villaver (2017) found that stars with low-mass brown dwarfs tend to show higher metallicities than stars hosting more massive brown dwarfs. Ma &Ge (2014) and Maldonado & Villaver (2017) also discussed differences in the period-eccentricity distribution of massive and low-mass brown dwarfs. This result fits well with our interpretation that more massive substellar objects tend to form more like stars.
-
Close-in and more distant planets. Recent works (Sozzetti 2004; Maldonado et al. 2018; Wilson et al. 2018) have discussed whether stars that host hot Juptiers show higher metallicities than more distant planets. As more distant planets are more massive than hot Jupiters (Ribas & Miralda-Escudé 2007; Bashi et al. 2017; Santos et al. 2017; Jenkins et al. 2017; Maldonado et al. 2018; see also Fig. 6), they tend to orbit stars with a wider range of metallicities.
-
Planets around low-mass stars. Planets around low-mass stars (M⋆ < 1M⊙) are mainly low-mass planets and their host stars do not show metal enrichment. They have short periods and low eccentricities. On the other hand, very few gas-giant planets have been found orbiting around low-mass stars and their host stars show metal enrichment (Neves et al. 2013). We caution that these results refer to radial velocity planets. Results from transit surveys are discussed in Sect. 6.
We do not expect the general metallicity trends discussed in this work for massive planets and brown dwarfs to be severely affected by the different detection limits achieved for the different planet hosts. As discussed in Sect. 3, planets of the mass of Jupiter at short periods can be detected in more than 95% of our targets. More distant substellar companions (P > 100 days) might be detected in a significant, large percentage of our stars, between 60 and 80%. The possible trend between massive planetary companions and large periods might, however, be affected by our lower sensitivity to detect small gaseous planets (with masses of the order of the mass of Jupiter) at very long periods (P > 2000 days).
On the other hand, the results regarding low-mass planets should be regarded with caution as with the radial velocity data at hand these planets can only be detected at short periods and around a small fraction of our stars (2–20% according to our conservative simulations, see Fig. 2).
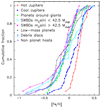 |
Fig. 4 [Fe/H] cumulative frequencies for the different samples analysed in this work. |
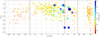 |
Fig. 5 Stellar metallicity of the host stars as a function of the minimum mass of the substellar companions. Different colours and symbol sizes indicate the mass of the host star. Vertical dashed lines indicate the standard mass loci of low-mass planets, gas-giant planets, brown dwarf, and stellar companions, from left to right respectively. |
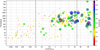 |
Fig. 6 Orbital period as a function of the minimum mass. Different colours and symbol sizes indicate the eccentricity values. Vertical dashed lines indicate the standard mass loci of low-mass planets, gas-giant planets, and brown dwarfs, from left to right. |
5 Planet-metallicity correlation in context
In order to discuss our results in a broader context, data from low-mass binaries have been included in Fig. 5. The data is taken from Mann et al. (2013) who compiled the metallicity of the primary stars mainly from high-resolution spectra. The mass of the late-K, M companions as well as the primaries are estimated by using a spectral type-stellar mass relationship based on the data provided by Cox (2000).
The figure shows that the tendency of a wider range of metallicities (lower values) towards more massive objects continues in the low-mass stellar range. Despite the fact we are comparing the minimum mass of substellar objects with estimates of the mass of stars, the trend that more massive substellar or stellar objects tend to form in a non-metallicity-dependent mechanism seems to hold, that is, there seems to be a continuity between substellar and stellar companions. According to this figure the core-accretion mechanism for planet formation would have its highest efficiency for forming planets with masses around one Jupiter mass (hot Jupiters).
It has been shown that the fraction of close binaries of solar-type stars decreases with the metallicity while the wide binary fraction is basically constant with metallicity at large separations (e.g. Moe et al. 2018; El-Badry & Rix 2019). Following the reasoning of Moe et al. (2018), massive and close substellar companions might form by fragmentation of the protostellar disc. Protostellar discs of solar-type stars are usually optically thick and lower metallicities imply lower opacities and enhanced cooling rates, which translate into higher probabilities of disc fragmentation5. On the other hand, massive and distant companions might form by turbulent fragmentation of molecular cores, a process which is known to beindependent of metallicity.
Figure 5 also reveals a possible tendency of wider metallicities towards low-mass planets that may still be formed by core accretion around low-metallicity stars. The low-metallicity environment implies long periods for forming a core able to accrete gas before the disc’s dissipation, so only small planets and planetesimals can be formed (e.g. Mordasini et al. 2012). However, the sample of M dwarf planet hosts is still too small to make a strong claim in this sense. We also should note our limited sensitivity to the detection of low-mass planets. The masses of debris discs do not help either as they are usually unavailable and subject to many assumptions.
6 Comparison with Kepler results
Given that our planet host sample is mainly selected from radial velocity surveys, a comparison with the results from the Kepler mission is mandatory in order to achieve a full vision of planets formation. In a recent work, Petigura et al. (2018) analyse a large sample of Kepler objects of interest with metallicities derived from spectroscopic observations, finding that planets smaller than Neptunes (RP < 4R⊕) are found around stars with a wide range of metallicities. On the other hand, sub-Saturns and Jupiters are found around metal-rich stars (their Fig. 3). The authors also note a gradual upward trend in mean host star metallicity from smaller to larger planets in agreement with previous analyses of smaller samples (Buchhave et al. 2012, 2014). These results support our findings that only stars hosting Jupiter-like planets show preferentially the metal-rich signature. As lower planetary radii imply lower planetary masses, although the relationship is complex and depends on the planet composition (e.g. Lopez & Fortney 2014), we conclude that the Kepler data support our suggestion that a tendency of lower metallicities towards low-mass planets might be present in Fig. 5 as discussed in Sect. 5.
Similar results have been found by Narang et al. (2018) who show that the host star metallicity increases with larger planetary radius and mass up to about 1 MJup or 4 R⊕. For planetary masses larger than 4 MJup the authors also found that more massive planets have on average lower host star metallicities, in agreement with our findings. The authors also suggest that hot transiting planets (periods less than ten days) orbit around stars with higher average metallicity, in agreement with our previous results (Maldonado et al. 2018) and this work.
Studies of the Kepler occurrence rates (Mulders et al. 2015a,b) have confirmed that small planets (1.0–3.0 R⊕) are more common around M dwarfs than around main sequence FGK stars (Howard et al. 2012). At larger planetary radii planets become more common around sun-like stars. Despite being different samples (1.0–3.0 R⊕ planets correspond to masses below ~8 M⊕, i.e. planets smaller than Neptune), a similar tendency of a larger occurrence of small planets towards less massive stars is found in our results from Fig. 5, where it can be seen that the vast majority of the low-mass planets (MC sin i < 30M⊕) orbit around stars with masses below 1 M⊙.
7 Conclusions
Achieving a full vision of how planets and planetary systems form and evolve is only possible by analysing in a homogeneous way large samples of stars covering the full domain of parameters, that is, by including the different outcomes of the planet formation process (from planetesimals to massive brown dwarfs and low-mass stars) as well as the full range of the host star’s masses and types. In this work we performed a detailed analysis of the planet-metallicity correlation by analysing in a cohesive way the data from our previous works, focused on certain types of stars and/or planets. Most of the studied stars (excluding the M dwarf subsample) was analysed in the same way using similar spectra and techniques.
Our results show a continuity between the formation of substellar and stellar companions driven by the metallicity of the host star. The core-accretion formation mechanism would achieve its maximum efficiency for planets with masses between ~0.2 and 2 MJup. For more massive substellar objects as well in low-mass binary companions the range of the host star’s metallicities increases towards lower values, suggesting that both kinds of objects tend to share similar formation mechanisms.
Anothertendency towards lower host star metallicities seems to be present towards the less massive outcomes of the planet formation process (low-mass planets and probably planetesimals), which may still be formed by the core-accretion method. However, this tendency might need additional confirmation.
Acknowledgements
This research was supported by the Italian Ministry of Education, University, and Research through the PREMIALEWOW 2013 research project under grant Ricerca di pianeti intorno a stelle di piccola massa. J.M. acknowledges support from the Ariel ASI-INAF agreement N. 2015-038-R.0. E.V. and C.E. acknowledge support from the On the rocks project funded by the Spanish Ministerio de Economía y Competitividad under grant AYA2014-55840-P. We sincerely appreciate the careful reading of the manuscript and the constructive comments of the anonymous referee.
References
- Adibekyan, V. 2019, Geosciences, 9, 105 [NASA ADS] [CrossRef] [Google Scholar]
- Alibert, Y., Mordasini, C., & Benz, W. 2011, A&A, 526, A63 [NASA ADS] [CrossRef] [EDP Sciences] [Google Scholar]
- Bashi, D., Helled, R., Zucker, S., & Mordasini, C. 2017, A&A, 604, A83 [NASA ADS] [CrossRef] [EDP Sciences] [Google Scholar]
- Beichman, C. A., Bryden, G., Rieke, G. H., et al. 2005, ApJ, 622, 1160 [NASA ADS] [CrossRef] [Google Scholar]
- Bouchy, F., Ségransan, D., Díaz, R. F., et al. 2016, A&A, 585, A46 [NASA ADS] [CrossRef] [EDP Sciences] [Google Scholar]
- Bressan, A., Marigo, P., Girardi, L., et al. 2012, MNRAS, 427, 127 [NASA ADS] [CrossRef] [Google Scholar]
- Bryden, G., Beichman, C. A., Carpenter, J. M., et al. 2009, ApJ, 705, 1226 [NASA ADS] [CrossRef] [Google Scholar]
- Buchhave, L. A., & Latham, D. W. 2015, ApJ, 808, 187 [NASA ADS] [CrossRef] [Google Scholar]
- Buchhave, L. A., Latham, D. W., Johansen, A., et al. 2012, Nature, 486, 375 [NASA ADS] [Google Scholar]
- Buchhave, L. A., Bizzarro, M., Latham, D. W., et al. 2014, Nature, 509, 593 [NASA ADS] [CrossRef] [Google Scholar]
- Chavero, C., Gómez, M., Whitney, B. A., & Saffe, C. 2006, A&A, 452, 921 [NASA ADS] [CrossRef] [EDP Sciences] [Google Scholar]
- Cox, A. N. 2000, Allen’s Astrophysical Quantities (New York: AIP Press) [Google Scholar]
- Cumming, A., & Dragomir, D. 2010, MNRAS, 401, 1029 [NASA ADS] [CrossRef] [Google Scholar]
- da Silva, L., Girardi, L., Pasquini, L., et al. 2006, A&A, 458, 609 [NASA ADS] [CrossRef] [EDP Sciences] [Google Scholar]
- El-Badry, K., & Rix, H.-W. 2019, MNRAS, 482, L139 [NASA ADS] [Google Scholar]
- Endl, M., Kürster, M., Els, S., Hatzes, A. P., & Cochran, W. D. 2001, A&A, 374, 675 [NASA ADS] [CrossRef] [EDP Sciences] [Google Scholar]
- Endl, M., Kürster, M., Els, S., et al. 2002, A&A, 392, 671 [NASA ADS] [CrossRef] [EDP Sciences] [Google Scholar]
- ESA, 1997, The Hipparcos and Tycho Catalogues. Astrometric and Photometric Star Catalogues Derived from the ESA Hipparcos Space Astrometry Mission, ESA SP, 1200 [Google Scholar]
- Fischer, D. A., & Valenti, J. 2005, ApJ, 622, 1102 [NASA ADS] [CrossRef] [Google Scholar]
- Fischer, D. A., Laughlin, G., Butler, P., et al. 2005, ApJ, 620, 481 [NASA ADS] [CrossRef] [Google Scholar]
- Galland, F., Lagrange, A. M., Udry, S., et al. 2005, A&A, 443, 337 [NASA ADS] [CrossRef] [EDP Sciences] [Google Scholar]
- Gáspár, A., Rieke, G. H., & Ballering, N. 2016, ApJ, 826, 171 [NASA ADS] [CrossRef] [Google Scholar]
- Ghezzi, L., Cunha, K., Schuler, S. C., & Smith, V. V. 2010a, ApJ, 725, 721 [NASA ADS] [CrossRef] [Google Scholar]
- Ghezzi, L., Cunha, K., Smith, V. V., et al. 2010b, ApJ, 720, 1290 [NASA ADS] [CrossRef] [Google Scholar]
- Ghezzi, L., Montet, B. T., & Johnson, J. A. 2018, ApJ, 860, 109 [NASA ADS] [CrossRef] [Google Scholar]
- Girardi, L., Bressan, A., Bertelli, G., & Chiosi, C. 2000, A&AS, 141, 371 [NASA ADS] [CrossRef] [EDP Sciences] [Google Scholar]
- Gonzalez, G. 1997, MNRAS, 285, 403 [NASA ADS] [CrossRef] [Google Scholar]
- Greaves, J. S., Fischer, D. A., & Wyatt, M. C. 2006, MNRAS, 366, 283 [NASA ADS] [CrossRef] [Google Scholar]
- Hekker, S., & Meléndez, J. 2007, A&A, 475, 1003 [NASA ADS] [CrossRef] [EDP Sciences] [Google Scholar]
- Hekker, S., Reffert, S., Quirrenbach, A., et al. 2006, A&A, 454, 943 [NASA ADS] [CrossRef] [EDP Sciences] [Google Scholar]
- Howard, A. W., Marcy, G. W., Bryson, S. T., et al. 2012, ApJS, 201, 15 [NASA ADS] [CrossRef] [Google Scholar]
- Jenkins, J. S., Jones, H. R. A., Tuomi, M., et al. 2017, MNRAS, 466, 443 [NASA ADS] [CrossRef] [Google Scholar]
- Jofré, E., Petrucci, R., Saffe, C., et al. 2015, A&A, 574, A50 [NASA ADS] [CrossRef] [EDP Sciences] [Google Scholar]
- Johnson, J. A., Fischer, D. A., Marcy, G. W., et al. 2007, ApJ, 665, 785 [NASA ADS] [CrossRef] [Google Scholar]
- Kokubo, E., & Ida, S. 2002, ApJ, 581, 666 [NASA ADS] [CrossRef] [Google Scholar]
- Kóspál, Á., Ardila, D. R., Moór, A., & Ábrahám, P. 2009, ApJ, 700, L73 [NASA ADS] [CrossRef] [Google Scholar]
- Lagrange, A. M., De Bondt, K., Meunier, N., et al. 2012, A&A, 542, A18 [NASA ADS] [CrossRef] [EDP Sciences] [Google Scholar]
- Lopez, E. D., & Fortney, J. J. 2014, ApJ, 792, 1 [NASA ADS] [CrossRef] [Google Scholar]
- Lovis, C., & Mayor, M. 2007, A&A, 472, 657 [NASA ADS] [CrossRef] [EDP Sciences] [Google Scholar]
- Ma, B., & Ge, J. 2014, MNRAS, 439, 2781 [NASA ADS] [CrossRef] [Google Scholar]
- Maldonado, J., & Villaver, E. 2016, A&A, 588, A98 [NASA ADS] [CrossRef] [EDP Sciences] [Google Scholar]
- Maldonado, J., & Villaver, E. 2017, A&A, 602, A38 [NASA ADS] [CrossRef] [EDP Sciences] [Google Scholar]
- Maldonado, J., Eiroa, C., Villaver, E., Montesinos, B., & Mora, A. 2012, A&A, 541, A40 [NASA ADS] [CrossRef] [EDP Sciences] [Google Scholar]
- Maldonado, J., Villaver, E., & Eiroa, C. 2013, A&A, 554, A84 [NASA ADS] [CrossRef] [EDP Sciences] [Google Scholar]
- Maldonado, J., Affer, L., Micela, G., et al. 2015a, A&A, 577, A132 [NASA ADS] [CrossRef] [EDP Sciences] [Google Scholar]
- Maldonado, J., Eiroa, C., Villaver, E., Montesinos, B., & Mora, A. 2015b, A&A, 579, A20 [NASA ADS] [CrossRef] [EDP Sciences] [Google Scholar]
- Maldonado, J., Villaver, E., & Eiroa, C. 2018, A&A, 612, A93 [NASA ADS] [CrossRef] [EDP Sciences] [Google Scholar]
- Mann, A. W., Brewer, J. M., Gaidos, E., Lépine, S., & Hilton, E. J. 2013, AJ, 145, 52 [NASA ADS] [CrossRef] [Google Scholar]
- Mata Sánchez, D., González Hernández, J. I., Israelian, G., et al. 2014, A&A, 566, A83 [NASA ADS] [CrossRef] [EDP Sciences] [Google Scholar]
- Mayor, M., Marmier, M., Lovis, C., et al. 2011, ArXiv e-prints [arXiv:1109.2497] [Google Scholar]
- Meunier, N., Lagrange, A. M., & De Bondt, K. 2012, A&A, 545, A87 [NASA ADS] [CrossRef] [EDP Sciences] [Google Scholar]
- Moe, M., Kratter, K. M., & Badenes, C. 2018, ApJ, submitted [arXiv:1808.02116] [Google Scholar]
- Mordasini, C., Alibert, Y., Benz, W., Klahr, H., & Henning, T. 2012, A&A, 541, A97 [NASA ADS] [CrossRef] [EDP Sciences] [Google Scholar]
- Mortier, A., Santos, N. C., Sousa, S. G., et al. 2013, A&A, 557, A70 [NASA ADS] [CrossRef] [EDP Sciences] [Google Scholar]
- Mulders, G. D., Pascucci, I., & Apai, D. 2015a, ApJ, 798, 112 [Google Scholar]
- Mulders, G. D., Pascucci, I., & Apai, D. 2015b, ApJ, 814, 130 [NASA ADS] [CrossRef] [Google Scholar]
- Narang, M., Manoj, P., Furlan, E., et al. 2018, AJ, 156, 221 [NASA ADS] [CrossRef] [Google Scholar]
- Natta, A., Grinin, V., & Mannings, V. 2000, Protostars and Planets IV (Tucson: University of Arizona Press), 559 [Google Scholar]
- Neves, V., Bonfils, X., Santos, N. C., et al. 2013, A&A, 551, A36 [NASA ADS] [CrossRef] [EDP Sciences] [Google Scholar]
- Niedzielski, A., & Wolszczan, A. 2008, in Extreme Solar Systems, eds. D. Fischer, F. A. Rasio, S. E. Thorsett, & A. Wolszczan, ASP Conf. Ser., 398, 71 [NASA ADS] [Google Scholar]
- Niedzielski, A., Nowak, G., Adamów, M., & Wolszczan, A. 2009, ApJ, 707, 768 [NASA ADS] [CrossRef] [Google Scholar]
- Niedzielski, A., Deka-Szymankiewicz, B., Adamczyk, M., et al. 2016, A&A, 585, A73 [NASA ADS] [CrossRef] [EDP Sciences] [Google Scholar]
- Pasquini, L., Döllinger, M. P., Weiss, A., et al. 2007, A&A, 473, 979 [NASA ADS] [CrossRef] [EDP Sciences] [Google Scholar]
- Pepe, F., Mayor, M., Queloz, D., et al. 2004, A&A, 423, 385 [NASA ADS] [CrossRef] [EDP Sciences] [Google Scholar]
- Petigura, E. A., Marcy, G. W., Winn, J. N., et al. 2018, AJ, 155, 89 [NASA ADS] [CrossRef] [Google Scholar]
- Pollack, J. B., Hubickyj, O., Bodenheimer, P., et al. 1996, Icarus, 124, 62 [NASA ADS] [CrossRef] [Google Scholar]
- Reffert, S., Bergmann, C., Quirrenbach, A., Trifonov, T., & Künstler, A. 2015, A&A, 574, A116 [NASA ADS] [CrossRef] [EDP Sciences] [Google Scholar]
- Ribas, I., & Miralda-Escudé, J. 2007, A&A, 464, 779 [NASA ADS] [CrossRef] [EDP Sciences] [Google Scholar]
- Sadakane, K., Ohnishi, T., Ohkubo, M., & Takeda, Y. 2005, PASJ, 57, 127 [NASA ADS] [Google Scholar]
- Sahlmann, J., Ségransan, D., Queloz, D., et al. 2011, A&A, 525, A95 [NASA ADS] [CrossRef] [EDP Sciences] [Google Scholar]
- Santos, N. C., Israelian, G., & Mayor, M. 2004, A&A, 415, 1153 [NASA ADS] [CrossRef] [EDP Sciences] [Google Scholar]
- Santos, N. C., Adibekyan, V., Figueira, P., et al. 2017, A&A, 603, A30 [NASA ADS] [CrossRef] [EDP Sciences] [Google Scholar]
- Schlaufman, K. C. 2018, ApJ, 853, 37 [NASA ADS] [CrossRef] [Google Scholar]
- Schuler, S. C., Kim, J. H., Tinker, Jr. M. C., et al. 2005, ApJ, 632, L131 [NASA ADS] [CrossRef] [Google Scholar]
- Sousa, S. G., Santos, N. C., Israelian, G., Mayor, M., & Udry, S. 2011, A&A, 533, A141 [NASA ADS] [CrossRef] [EDP Sciences] [Google Scholar]
- Sozzetti, A. 2004, MNRAS, 354, 1194 [CrossRef] [Google Scholar]
- Takeda, Y., Ohkubo, M., Sato, B., Kambe, E., & Sadakane, K. 2005, PASJ, 57, 27 [NASA ADS] [CrossRef] [Google Scholar]
- Takeda, Y., Sato, B., & Murata, D. 2008, PASJ, 60, 781 [NASA ADS] [CrossRef] [Google Scholar]
- Tinney, C. G., Butler, R. P., Marcy, G. W., et al. 2001, ApJ, 551, 507 [NASA ADS] [CrossRef] [Google Scholar]
- van Leeuwen F. 2007, A&A, 474, 653 [NASA ADS] [CrossRef] [EDP Sciences] [Google Scholar]
- Wilson, P. A., Hébrard, G., Santos, N. C., et al. 2016, A&A, 588, A144 [NASA ADS] [CrossRef] [EDP Sciences] [Google Scholar]
- Wilson, R. F., Teske, J., Majewski, S. R., et al. 2018, AJ, 155, 68 [NASA ADS] [CrossRef] [Google Scholar]
- Wright, J. T., & Howard, A. W. 2009, ApJS, 182, 205 [NASA ADS] [CrossRef] [Google Scholar]
Although for very low metallicities the disc becomes optically thin and the effect of lower metallicity would be the opposite.
All Tables
All Figures
|
Fig. 1 Luminosity versus Teff diagram for the stars analysed. Stars with discs are plotted as green whilst stars without discs are shown in blue. Stars with planets are shown as filled circles and stars with companions in the brown dwarf regime are shown in filled stars. Some evolutionary tracks ranging from 0.7 to 3.0 solar masses from Girardi et al. (2000) are overplotted. For each mass, three tracks are plotted, corresponding to Z = 0.008 ([Fe/H] = −0.4 dex, dotted lines), Z = 0.019 ([Fe/H] = +0.0 dex, solid lines), and Z = 0.030 ([Fe/H] = +0.20 dex, dashed lines). |
| In the text | |
|
Fig. 2 Minimum mass versus planetary period diagram. Substellar companions analysed in this work are shown in grey circles. Detection probability curves are superimposed with different colours. Horizontal dashed lines indicate the standard mass loci of low-mass planets, and gas-giant planet companions. |
| In the text | |
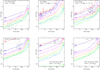 |
Fig. 3 Same as Fig. 2 but for the different subsamples described in Sect. 4. |
| In the text | |
|
Fig. 4 [Fe/H] cumulative frequencies for the different samples analysed in this work. |
| In the text | |
|
Fig. 5 Stellar metallicity of the host stars as a function of the minimum mass of the substellar companions. Different colours and symbol sizes indicate the mass of the host star. Vertical dashed lines indicate the standard mass loci of low-mass planets, gas-giant planets, brown dwarf, and stellar companions, from left to right respectively. |
| In the text | |
|
Fig. 6 Orbital period as a function of the minimum mass. Different colours and symbol sizes indicate the eccentricity values. Vertical dashed lines indicate the standard mass loci of low-mass planets, gas-giant planets, and brown dwarfs, from left to right. |
| In the text | |
Current usage metrics show cumulative count of Article Views (full-text article views including HTML views, PDF and ePub downloads, according to the available data) and Abstracts Views on Vision4Press platform.
Data correspond to usage on the plateform after 2015. The current usage metrics is available 48-96 hours after online publication and is updated daily on week days.
Initial download of the metrics may take a while.