| Issue |
A&A
Volume 597, January 2017
|
|
|---|---|---|
| Article Number | A7 | |
| Number of page(s) | 14 | |
| Section | Extragalactic astronomy | |
| DOI | https://doi.org/10.1051/0004-6361/201628921 | |
| Published online | 19 December 2016 | |
New low surface brightness dwarf galaxies in the Centaurus group
1 Departement Physik, Universität Basel, Klingelbergstr. 82, 4056 Basel, Switzerland
e-mail: oliver89.mueller@unibas.ch; bruno.binggeli@unibas.ch
2 Research School of Astronomy and Astrophysics, Australian National University, Canberra, ACT 2611, Australia
Received: 13 May 2016
Accepted: 24 August 2016
Context. The distribution of satellite galaxies around the Milky Way and Andromeda and their correlation in phase space pose a major challenge to the standard ΛCDM model of structure formation. Other nearby groups of galaxies are now being scrutinized to test for the ubiquity of the phenomenon.
Aims. We conducted an extensive CCD imaging survey for faint, unresolved dwarf galaxies of very low surface brightness in the whole Centaurus group region, encompassing the Cen A and M 83 subgroups lying at a distance of roughly 4 and 5 Mpc, respectively. The aim is to significantly increase the sample of known Centaurus group members down to a fainter level of completeness, serving as a basis for future studies of the 3D structure of the group.
Methods. Following our previous survey of 60 square degrees covering the M 83 subgroup, we extended and completed our survey of the Centaurus group region by imaging another 500 square degrees area in the g and r bands with the wide-field Dark Energy Survey camera at the 4 m Blanco telescope at CTIO. The surface brightness limit reached for unresolved dwarf galaxies is μr ≈ 29 mag arcsec-2. The faintest suspected Centaurus members found have mr ≈ 19.5 mag or Mr ≈ −8.8 mag at the mean distance of the group. The images were enhanced using different filtering techniques.
Results. We found 41 new dwarf galaxy candidates, which together with the previously discovered 16 dwarf candidates in the M 83 subgroup amounts to almost a doubling of the number of known galaxies in the Centaurus complex, if the candidates are confirmed. We carried out surface photometry in g and r, and report the photometric parameters derived therefrom, for all new candidates as well as previously known members in the surveyed area. The photometric properties of the candidates, when compared to those of Local Group dwarfs and previously known Centaurus dwarfs, suggest membership in the Centaurus group. The sky distribution of the new objects is generally following a common envelope around the Cen A and M 83 subgroups. How the new dwarfs are connected to the intriguing double-planar feature recently reported must await distance information for the candidates.
Key words: galaxies: dwarf / galaxies: individual: Centaurus group / galaxies: photometry
© ESO, 2016
1. Introduction
In addition to their traditional role as dark matter (DM) tracers by their internal dynamics (Walker 2013), faint dwarf galaxies are a very powerful testbed for DM and structure formation models by their mere abundance and spatial distribution. There is the long-standing missing satellite problem (e.g., Kauffmann et al. 1993; Klypin et al. 1999; Moore et al. 1999) and the too big to fail problem (Boylan-Kolchin et al. 2011), both of which might be attributable to an incomplete understanding of baryonic physics (e.g., Simon & Geha 2007; Wetzel et al. 2016). However, a major challenge for the standard picture of structure formation with DM is now posed by the highly asymmetric features found in the distributions of dwarf galaxies in the Local Group (Kroupa et al. 2005). There is the vast polar structure (VPOS; Pawlowski et al. 2015, 2012), which is a thin (rms height ≈30 kpc) highly inclined, corotating substructure of faint satellite galaxies, young globular clusters, and streams, spreading in Galactocentric distance between 10 and 250 kpc. Following an earlier suggestion by Koch & Grebel (2006), a similar feature was found in the Andromeda galaxy surroundings (Metz et al. 2007; Ibata et al. 2013), called the Great Plane of Andromeda (GPoA). Moreover, there are two galaxy planes (diameters of 1–2 Mpc) that contain all but one of the 15 nonsatellite galaxies in the Local Group (Pawlowski et al. 2013). Such planar structures on galactic and intergalactic scales are difficult to accommodate in a standard Λ cold dark matter (ΛCDM) scenario, where extreme satellite planes are found in <0.1% of simulated systems (e.g., Pawlowski et al. 2014). Still, the most conservative estimate from cosmological simulations including the look-elsewhere effect, but ignoring observational uncertainties, finds the frequency of two prominent satellite structures in the Local Group to be ~1 per cent (Cautun et al. 2015). These controversial results demonstrate the need for more observational data to scrutinize ΛCDM predictions and assess the degree of conflict with that model.
If the relative sparseness and asymmetric distributions of low-mass dwarf galaxies are a common phenomenon in the local universe, a major revision of our view of structure formation would be necessary. Recently, Tully et al. (2015) reported evidence of a double-planar structure in the nearby Centaurus group of galaxies, based on hitherto known (i.e., still fairly massive) galaxy members of the group. This result is encouraging, as it means that systematic studies of the spatial distribution of fainter dwarf galaxies in nearby groups can provide important observational constraints for further testing structure formation models. In a first step, deep and wide-field imaging is required to detect dwarf galaxy members of nearby galaxy groups with faint luminosity and surface brightness levels. Present-day technologies allow a dwarf galaxy census of other nearby groups down to MV ≈ −10, equivalent to Local Group dwarfs like Sculptor, Sextans, and Tucana, clearly surpassing the achievements of the Sloan Digital Sky Survey (SDSS; Ahn et al. 2014; York et al. 2000) with respect to the detection of unresolved dwarf candidates.
Several international teams have taken up the effort to conduct dedicated imaging surveys of other nearby galaxy groups in the search for faint and ultra-faint dwarf galaxies in the northern hemisphere; see, for example, Chiboucas et al. (2009, 2013) for the M 81 group (14 confirmed new members over 65 deg2), and Merritt et al. (2014) and Javanmardi et al. (2016) for the M 101 group (8 dwarf candidates over 7 deg2). In the southern hemisphere, the deep but spatially limited Panoramic Imaging Survey of Centaurus and Sculptor (PISCeS) of NGC 253 in the Sculptor group and NGC 5128 (Cen A) in the Centaurus group (Sand et al. 2014; Crnojević et al. 2014, 2016) revealed 9 extremely faint dwarf galaxies (25.0 < μr,0 < 27.3, −13 <MV < −7.2) in the vicinity (~11 deg2) of Cen A. Group memberships of these dwarfs have been confirmed with the tip of the red giant branch (TRGB) method.
In the same spirit we conducted a large-scale survey of the Centaurus Group using the Dark Energy Camera (DECam) at the 4 m Blanco telescope at CTIO. Our survey has a photometric surface brightness limit that is slightly less sensitive than PISCeS, but a 50 times larger footprint. The survey covers a region of ≈550 deg2, thus providing complete CCD coverage of this southern galaxy group, for the first time, going significantly deeper than with the SDSS in the north outside the Local Group. Owing to its greater depth, PISCeS is a search for resolved dwarf objects, while our survey is able to detect only unresolved dwarf members of the Centaurus group. This paper is the second report on our DECam survey of the Centaurus group region. We refer to the Centaurus group as the whole complex and the two main concentrations as Cen A and M 83 subgroup, respectively. The Cen A subgroup is dominated by the massive peculiar galaxy Cen A (=NGC 5128) at a mean distance of 3.8 Mpc and the M 83 subgroup by the giant spiral M 83 (=NGC 5236) at a mean distance of 4.9 Mpc (Karachentsev et al. 2004, 2013; Tully et al. 2015; Tully 2015). In our first paper (Müller et al. 2015, hereafter MJB15) we reported the discovery of 16 new dwarf galaxy candidates from our survey of the M 83 subgroup, covering an area of 60 deg2 based on the images taken with DECam. One of the new dwarfs, dw1335-29, has already been confirmed as group member based on HST archival data (Carrillo et al. 2016).
In this paper we present our extended DECam survey of the entire Centaurus group and report on the discovery of another 41 new dwarf candidates in addition to the 16 dwarf galaxy candidates reported in MJB15. Even if we assume that a few objects will turn out to be background galaxies, this sample essentially doubles the number of known galaxies in the Centaurus group.
The paper is organized as follows. In Sect. 2 we give the details of the DECam observations. Section 3 describes our search strategy for, and detection of, faint diffuse dwarf galaxy candidates in the survey footprint. In Sect. 4 we present the results from the surface photometry analysis conducted for the new candidates and the known Centaurus group members. Finally, a first assessment of the dwarf galaxy distribution and a critical discussion of our findings are given in Sect. 5, followed by our conclusions in Sect. 6.
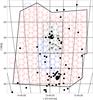 |
Fig. 1 Surveyed area of ≈550 square degrees in the Centaurus group. The individual DECam fields are represented by circles. The colors indicate the three different sets of data; the fields around M 83 were discussed in the MJB15 study and are shown as black circles. The blue and red fields were observed in 2014 and 2015, respectively, and analyzed for the present paper. The small black dots are the known dwarfs in the Centaurus group listed in the Local Volume Catalog (Karachentsev et al. 2004, 2013) complemented by the recently discovered nine dwarfs of Crnojević et al. (2014, 2016). The larger black dots are the two dominant group galaxies M 83 (13h37m00.9s, −29d51m56s) and Cen A (13h25m27.6s, −43d01m09s). |
2. Observations and photometric calibration
We obtained images in the g and r bands over two observing runs on 2014 July 17–19 and 2015 June 4–9 using the Dark Energy Camera at the 4 m Blanco telescope at Cerro Tololo Inter-American Observatory (CTIO) as part of the observing proposals 2014A-0624 and 2015A-0616 (both PI: H. Jerjen). With an array of 62 2k × 4k CCD detectors the DECam has a 3 square degree field of view and a pixel scale of  . In 2014 we obtained a complete data set for 24 fields under dark time conditions (blue circles in Fig. 1). Exposure times were 3 × 40 s in both bands. During the 2015 observing run two exposures were taken in each band for a total of 163 fields (red circles in Fig. 1). To fill the inter-chip gaps, we dithered diagonally by half of a CCD chip. The measured median seeing was
  . As we were observing under waning moon conditions, we strategically collected the r-band images in the first four nights with exposure times between 2 × 120 and 2 × 210 s and the g-band images in the last four nights with exposure times between 2 × 100 and 2 × 170 s, depending on the sky brightness and the angular distance of the target field from the moon.
The images were fully reduced and stacked using the DECam community pipeline (Valdes et al. 2014). Figure 1 shows the survey footprint superimposed on the distribution of the known galaxies in the Centaurus group. The circles correspond to the individual DECam fields while the colors indicate the different data sets. Black circles indicate the 22 DECam fields of MJB15.
To determine the photometric zero points and color terms for each DECam field, we matched the instrumental magnitudes of typically 100–200 stars in each field with their corresponding photometric data from the AAVSO Photometric All-Sky Survey (APASS) catalog (Henden & Munari 2014) using the DAOPHOT package (Stetson 1987) in IRAF and fitted the following two equations:

 where Zg and Zr are the photometric zero points, cg and cr are the color terms, kg and kr are the atmospheric extinction coefficients, and X is the mean airmass. The most recent extinction values kr = 0.10 and kg = 0.20 for CTIO were kindly provided by the Dark Energy Survey team. The airmass X was given in the header of each exposure.
To allow a direct comparison with available photometry for Local Group dwarf galaxies in the literature, we converted our gr photometry (see Sect. 4) into the V band using the transformation equation by Lupton (2005) as follows:  (1)This formula can be used for the total magnitudes and surface brightness parameters of the galaxy. To further compare our results from the Sérsic profile fitting with the B-band results for Local Group and Virgo cluster dwarf galaxies, we also converted the literature values from the B to r band using the equation (Lupton 2005),
  (2)where we adopted a color index of (g−r) = 0.6 suitable for early-type dwarf galaxies (Lisker et al. 2008). The entire survey area (this paper and MJB15) is subdivided into three different data sets (see Fig. 1). As we mentioned before, the exposure times for the fields obtained in the 2015 run (red circles in Fig. 1) were adjusted to compensate for the sky brightness variation due to lunar illumination to achieve approximately equal photometric depth across the survey area. To test photometric uniformity we sampled the faintest stars in different regions and measured their apparent magnitudes. The variance is in the range of 0.3 mag. Overlapping DECam fields from different data sets were also compared for their detection quality. We find no significant difference.
3. Search and detection of new dwarf candidates
Finding new dwarf galaxy candidates in the Centaurus group required the search for unresolved, low surface brightness objects in the DECam images. With the relative short exposure times we cannot resolve galaxies at the distance of the Centaurus group into RGB stars. A quick estimate of the TRBG magnitude shows that we miss the RGB tip by a few tenths of a magnitude. For this estimate we took the stellar population of the Sculptor dwarf galaxy as a reference with MI = −4.1 and V−I = 1.5 for its TRGB (Rizzi et al. 2007). This translates into Mr≈−2.8 with an assumed color index of V−r≈ 0.2. We assume a mean Galactic extinction of Ar = 0.15 for our survey field; see Table 2 for the exact extinction values for all the galaxies in the survey. At the distance of 4.9 Mpc (M 83) this gives an expected apparent magnitude of mr = 25.8 for the RGB tip. At the distance of 3.8 Mpc (Cen A) the expected apparent magnitude is mr = 25.3. The faintest stars detectable in the survey data have a magnitude ≈25, and thus we can expect to see the brightest stars in galaxies only if they have a shorter distance than Cen A. Faint individual stars are indeed visible in some of the galaxy candidates, but in most of the cases we miss the tip. Therefore this is a search for unresolved stellar systems.
All gr band images available for an individual DECam field were co-added using the SWarp program (Bertin et al. 2002). The SWarp program subtracts the background of every frame, resamples them onto a common coordinate system, stacks them, and puts the combined image into a single file (hereafter deep image). The frames were combined using the weighted co-addition algorithm.
Gray-level manipulation was applied on the deep images to enhance the contrast. We carefully estimated the local background rms noise and chose a range of 2 × rms below and above the estimated sky background level. This is the regime where we expect the low surface brightness dwarfs to be most prominent. In a first step, the deep images were visually inspected. Then different filtering techniques like the Gaussian convolution and the ring median filter (Secker 1995) were applied to enhance the presence of any low-surface brightness features. This strategy can potentially lead to losing high surface brightness objects, such as bright background galaxies or blue compact dwarfs (BCD) in the Centaurus group. We refer to Sect. 3 in MJB15 for more details about the search strategy.
The region of the Centaurus group is at low Galactic latitudes and thus has a relatively high level of contamination from foreground stars and Galactic cirrus. Although cirrus can sometimes resemble low surface brightness dwarf galaxies in shape and size, it is often possible to distinguish them morphologically. When a low surface brightness object was detected in or near a structure of Galactic nebula (cirrus) it was dismissed as a dwarf galaxy candidate (see Fig. 3 for an example). As part of this decision process real dwarf galaxies could have been accidentally rejected.
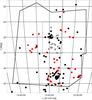 |
Fig. 2 Same as Fig. 1 but without the DECam pointings, showing the 41 newly detected dwarf galaxy candidates as red dots. The 16 dwarf candidates we previously reported in the vicinity of M 83 (MJB15; survey footprint shown as large rectangle) are indicated as small gray circles. The survey area of the Crnojević et al. (2014, 2016) study around Cen A is approximated with the small rectangle. |
We found 41 new Centaurus group dwarf galaxy candidates. Their distribution among the known group members is shown in Fig. 2 (red dots). A gallery of the r-band images of the candidates is presented in Fig. 4. The coordinates and morphological type are compiled in Table 1. The morphological type is based on the assumption that the object is a member of the Centaurus group. The photometric and structural parameters of the dwarf candidates are listed in Table 2.
Three new candidates are in the MJB15 footprint. Just outside of the MJB15 footprint, dw1343-34 is visible when comparing Figs. 1 and 2; albeit fully visible in MJB15, dw1321-27 and dw1322-27 were then rejected and assumed to be satellites of NGC 5101 in the background. With the background relation test carried out in this paper (see Fig. 8), we estimate that at least one of these candidates is too big in size relative to its surface brightness to be associated with the background galaxy, while the other candidate can be argued as background or foreground dwarf. Still, we list both of them here as new candidates of the Centaurus group. Distance measurements will give a final answer to their membership.
We also checked for 21 cm emission within 8 arcmin of the direction of the candidates using the spectra from the HI Parkes All Sky Survey (HIPASS) survey (Barnes et al. 2001). None of the galaxies were detected in HI. Using the faint HI signal of the Centaurus group member HIPASSJ1348-37 as a reference (Sint = 2.5 Jy km s-1), we derive an upper limit for the HI content of the new dwarfs at MHI< 8.5 × 10⁶M⊙.
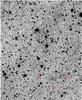 |
Fig. 3 Example of a low surface brightness feature (indicated with red lines) close to Galactic cirrus. The object was dismissed as dwarf galaxy candidate for reasons explained in the text. |
Names and coordinates of the 41 new dwarf galaxy candidates.
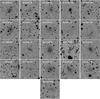 |
Fig. 4 Gallery showing DECam r-band images of the new Centaurus group dwarf galaxy candidates. One side of an image is 2.25 arcmin or 3.0 kpc at 4.5 Mpc. North is to the top, east to the left. |
4. Galaxy photometry
We measured gr surface photometry for the new dwarf candidates and for the known Centaurus group dwarfs in the surveyed region, where possible. Pixels affected by foreground stars, background galaxies, and cosmic rays were replaced with patches of sky from the surrounding area to match the statistical properties of the local sky background. To find the center of the galaxy, we fitted a circle at the outer isophotes and took its center as the galaxy center. For each photometric band, we computed the total apparent magnitude, the mean effective surface brightness ⟨ μ ⟩ eff, and the effective radius reff. To determine the sky brightness we varied the growth curve (cumulative intensity profile) of the galaxy until it became asymptotically flat at large radii. Radial surface brightness profiles were measured using a radial step size of  for galaxies visually larger than 13″ (radius) and
  for smaller galaxies. A circular aperture was used for the photometry. Sérsic profiles (Sersic 1968) were fitted at the radial surface brightness profiles using the equation
  where μ0 is the Sérsic central surface brightness, r0 the Sérsic scale length, and n the Sérsic curvature index. We note that some authors use 1 /n instead of n. Although we clearly stated that we use n, even we were confused and used 1 /n in Table 2 of MJB2015. In Fig. 6 of the same paper Sérsic indices were plotted with 1 /n instead of n for our photometry. Our group membership argument does not change because most of the values are in the range between 0.8 and 1.2, still falling into the relation. We plot the correct values in Fig. 9 here.
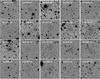 |
Fig. 4 continued. |
Photometric and structural parameters of the new Centaurus group dwarf candidates in the surveyed region.
The combined uncertainty for the total magnitudes was estimated to be on the order of 0.3 mag. Contributions to the error budget come from the star subtraction (≈0.2 mag), zero-point calibration (less than 0.04 mag) and the estimated sky background (≈0.2 mag); the star subtraction is estimated by the average difference in magnitudes between the galaxy with star removal and without, assuming no bright star is in the vicinity. An additional error for the absolute magnitudes (Col. 6 in Table 2) comes from the assumed distance (≈0.25 mag for an uncertainty of ± 0.5 Mpc). Uncertainties for the structural parameters arise from the determination of the growth curve (Δreff = 1 arcsec, Δ ⟨ μ ⟩ eff = 0.3 mag ) and for the Sérsic fit from numerics (see Table 2 for the corresponding errors).
One of our candidates (dw1326-35 from MJB15) is at the border of two different observation runs and is visible in both of them (see Fig. 2). We performed photometry on the images of both runs to test the internal consistency of our photometry pipeline. We calculated the differences in apparent magnitude, which were Δr = 0.21 mag and Δg = 0.06 mag. These values are well within the estimated total uncertainty of 0.3 mag. There exists an overlap of two known galaxies with the MJB15 region (KK200 and CenA-dE4). The photometric differences are ΔB = 0.095 mag and ΔB = −0.144 mag, respectively, which is well within the estimated error.
Another test of performance is to compare our photometry with literature values. For that purpose we transformed our gr photometry into a B-band magnitude using the formula given in Sect. 2. We plot the total B magnitude from the literature for 30 known dwarfs in our survey data versus the B magnitude from our photometry in Fig. 5. The references for the literature values are given in Table A.1, and no adjustments were made for different methods to derive the photometry. We note that 24 of the known dwarfs are missing in the lists provided in this paper and in MJB15 as they happen to lie either outside of our survey footprint (10), or are close to or even on the edge of a CCD field (7), are stretched over multiple CCD tiles (4), or in the case of the ultra-faint dwarfs are too faint to measure (3).
All but five galaxies (KK200, KKs53, KKs55, KK213, and CenA-MM-Dw1) agree within our estimated errors. If we exclude these five discrepant cases the mean difference and standard deviation are ⟨ Δμ ⟩ = 0.10 mag and σ = 0.37 mag, respectively. The discrepancy for the five objects can be explained as follows: (a) KK200 (Metcalfe et al. 1994) was only integrated to the μb = 26.75 mag arcsec-2 isophote, cutting the outskirts of the galaxy. The listed value is fainter than the real value (b) for KKs53, KKs55, and KK213 (Huchtmeier et al. 2001), and the magnitudes were estimated by visual inspection only; no quantitative photometry was performed; and (c) for CenA-MM-Dw1, the case is described in detail in the following.
Among the nine ultra-faint dwarfs found by Crnojević et al. (2014, 2016) photometry was possible for CenA-MM-Dw1, Dw4 and Dw9. We point out the good agreement for the photometric quantities of Dw4 and Dw9. For CenA-MM-Dw4, μ0,r = 25.1 and  versus μ0,r = 25.0 and
  (Crnojević et al. 2016); for CenA-MM-Dw9, μ0,r = 25.9 and
  versus μ0,r = 26.1 and
  (Crnojević et al. 2016); whereas for CenA-MM-Dw1, μ0,r = 25.1 and
  versus μ0,r = 27.0 and
  (Crnojević et al. 2014) clearly differs from our results. Private communication with D.C. confirmed that our values are correct. CenA-MM-Dw2 is also visible on our DECam images but its small angular size and the presence of a number of bright foreground stars (see Fig. 2 of Crnojević et al. 2016) prevented us from conducting accurate photometry. Moreover, Dw3 is a tidal dwarf galaxy that is extended over 1.5 degrees making it impossible to perform aperture photometry, while Dw5 and Dw7, with central surface brightnesses μ0,r ≈ 26.5, were too faint. Dw6 is just visible when knowing the position, but too faint to be detected as dwarf galaxy. Dw8 is on the edge of an image.
In Table 2 we present the photometric data for the 41 newly detected dwarf galaxy candidates. Where possible we also performed photometry for known Centaurus group dwarfs in the survey area (Table A.1). The quantities listed are as follows: (1) name of candidate, or name, morphological type, and coordinates of the known galaxy; (2+3) total apparent magnitude in the g and r bands; (4+5) Galactic extinction values in g and r according to Schlafly & Finkbeiner (2011); (6) extinction-corrected absolute r-band magnitude. The assumed distance for the candidates is the mean distance of the Centaurus group (4.5 Mpc). For the known galaxies we used the individual distances listed in the Updated Nearby Galaxy Catalog (Karachentsev et al. 2013); (7) extinction-corrected integrated g−r color; (8) Sérsic central surface brightness in the r band; (9) Sérsic scale length in the r band; (10) Sérsic curvature index in the r band; (11) mean effective surface brightness in the r band; and (12) effective radius in the r band.
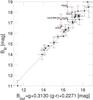 |
Fig. 5 Comparison of B-band photometry for known Centaurus group galaxies in our survey area. Values from the literature (for references see Table 3) versus the B-band magnitude we derived from our gr photometry. We adopt a conservative error of 0.4 mag for our data, which includes the uncertainties for both filters. Photometric uncertainties for the literature values were taken from the publications. The unity line is shown as a solid line. For five galaxies the magnitude difference is larger than the error tolerance (indicated in red). These discrepant cases are discussed in the text. |
5. Discussion
Prior to our study there were about 60 group members known in the whole Centaurus group (Karachentseva & Karachentsev 1998; Karachentsev et al. 2002, 2013; Jerjen et al. 2000a,b; Crnojević et al. 2014, 2016), half of these have accurate distances while the others got preliminary membership based on morphology or velocity measurements. This galaxy population has the potential to almost double in size if the majority of the 41 + 16 (MJB15) new dwarf galaxies are confirmed as group members. In this context a number of interesting questions arise: What are our detection limits? How plausible are the new candidates? Are their photometric and structural properties comparable to the Local Group and known Centaurus group dwarfs, or are they perhaps associated with background galaxies? Due to the lack of distance information these questions shall be addressed with the help of the available photometric results.
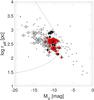 |
Fig. 6 For our candidates, log (reff)−M relation in the V band (red squares), all known dwarfs of the Centaurus group in the surveyed area for which photometry was possible (gray filled squares), Local Group dwarf galaxies (gray dots; McConnachie 2012) and the candidates from MJB15 (black squares). Also plotted are conservative error bars of 0.5 mag for MV and 0.05 for log (reff). Absolute magnitudes are based on a mean distance of 4.5 Mpc to all Centaurus galaxy candidates. The solid curve represents the completeness limit of the survey. It suggests that most low surface brightness galaxies larger than 26′′ in diameter at the isophotal magnitude of 28 mag arcsec-2 were detected (for more details see text). |
5.1. Detection limits
As mentioned at the end of Sect. 2, the photometric depth for the various DECam observing campaigns, including the one our previous study (MJB15) was based on, is uniform within a range of 0.3 mag. In MJB15 we conducted extensive artificial galaxy tests to determine the detection limits and efficiency of our search for low surface brightness objects. The results of this testing, also valid for the present study, are shown in Fig. 4 of MJB15. The figure shows the fraction of detected artificial galaxies as a function of total magnitude and central surface brightness. The detection efficiency is generally above 80% for galaxies brighter than m = 19 r mag and with a central surface brightness μ< 26.5 V mag. An alternative way to represent detection efficiency is the completeness boundary curve of Ferguson (1990) and Ferguson & Sandage (1988), assuming exponential surface brightness profiles (Sérsic Index n = 1) for the objects. The corresponding equation for this completeness curve is ![\begin{eqnarray*} m_{\rm tot}=\mu_{\rm lim} - \frac{r_{\rm lim}}{0.5487 r_{\rm eff}} - 2.5\log[2\pi\cdot (0.5958\cdot r_{\rm eff})^2], \end{eqnarray*}](/articles/aa/full_html/2017/01/aa28921-16/aa28921-16-eq232.png) meaning that (nearly) all, or most objects with a diameter larger than 2rlim at the surface brightness level of μlim should have been detected. Our best estimates for the two free limiting parameters in MJB15 (see Figs. 4 and 6 there) was rlim ≈ 20 arcsec and μlim ≈ 28V mag arcsec-2. For the present study we found a slightly smaller radius of rlim ≈ 13 arcsec gives a boundary curve that better fits the data.
meaning that (nearly) all, or most objects with a diameter larger than 2rlim at the surface brightness level of μlim should have been detected. Our best estimates for the two free limiting parameters in MJB15 (see Figs. 4 and 6 there) was rlim ≈ 20 arcsec and μlim ≈ 28V mag arcsec-2. For the present study we found a slightly smaller radius of rlim ≈ 13 arcsec gives a boundary curve that better fits the data.
To allow for a comparison of our results with the Local Group dwarfs (data from McConnachie 2012) we used Eq. (1) to transform our gr photometry to the V band. Having all the galaxies on the same photometric system, in Fig. 6 we plot the effective radius versus total V-band luminosity relation for our candidates, all known Centaurus dwarfs in the survey area for which we have photometry in Table A.1, Local Group dwarf galaxies, and the candidates from MJB15. Absolute magnitudes for the Centaurus galaxy candidates are based on a mean distance of 4.5 Mpc. The solid curve represents the completeness boundary curve given above with best estimates rlim ≈ 13 arcsec and μlim ≈ 28V mag arcsec-2, suggesting that we detected most dwarf galaxy candidates in our survey footprint with diameters larger than 26 arcsec (≈600 pc) at a surface brightness of 28 Vmag arcsec-2. These quantities translate roughly into a luminosity limit of MV ≈ −10 or Mr ≈ −9.5. The completeness boundary curve, properly transformed to the μ−M plane, is also shown in Fig. 8.
 |
Fig. 7 Radial surface brightness profiles and best-fitting Sérsic profiles with 1σ confidence intervals for all dwarf candidates in the r band. |
5.2. Centaurus group membership
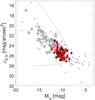 |
Fig. 8 For our dwarf candidates, μ0−M relation in the V band (red squares), all known dwarfs of the Centaurus group in the survey area (gray filled squares), Local Group dwarf galaxies (dots; McConnachie 2012) and the candidates from MJB15 (black squares). The newly discovered Centaurus dwarf candidates have similar properties to those of known Centaurus dwarfs and Local Group dwarfs. |
As we discussed in Sect. 3, the photometric depth of our survey data reached the brightest stars in some of the dwarf candidates, but photometry of red giant branch stars at least 1 mag fainter would be necessary to establish TRGB distances for the dwarf candidates. Another means to measure distances of galaxies is the surface brightness fluctuation method (SBF; Tonry & Schneider 1988). This method was successfully tested for early-type dwarfs by Jerjen et al. (2000b) and used to measure distances to five dE galaxies in the Centaurus group and many more in the Local Volume (Jerjen et al. 2001; Rekola et al. 2005). The minimum exposure time required for the SBF method to work can be calculate using Eq. (1) in Dunn & Jerjen (2006). Using μgal = 25 mag arcsec-2 for the mean surface brightness of a typical dwarf candidate in this survey, the sky surface brightness μsky = 21 mag arcsec-2, a distance modulus of 28.0 for the Cen A subgroup, the fluctuation luminosity of the underlying stellar population  mag, and the photometric zero point m1 = 24 mag gives an integration time of 2400 s (S/N = 5), which is six times longer than the exposure times of our DECam images.
As the new dwarf candidates are not resolved into stars and the SBF method requires longer integration times, the only way to test (or rather suggest) group membership at the moment is to compare the photometric and structural properties of the galaxy candidates with the known dwarfs in the Centaurus group and Local Group. This can be achieved with the surface brightness – luminosity relation. To calculate the luminosities of the candidates we placed them at the mean distance of the Centaurus group (4.5 Mpc). Because the surface brightness is a distance independent quantity, the only parameter that decides how well a candidate fits into the μ−M relation is the luminosity and thus the assumed distance. We plot the central surface brightness μ0 for all galaxies versus their estimated absolute magnitude MV for Local Group dwarfs, the known Centaurus dwarfs, candidates from MJB15, and candidates from this work in Fig. 8. The Local Group dwarf μ0 values come from King or exponential profiles, while our photometric parameter comes from Sérsic fits. Our candidates are in good accord with the photometric values of known dwarfs. They all fit into the relation outlined by the Local Group dwarfs and naturally bridge the gap to the more luminous dwarfs in the Centaurus group. This agreement provides qualitative evidence that the majority of the new dwarf candidates are indeed Centaurus group members.
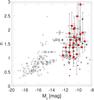 |
Fig. 9 Shape parameter – luminosity (Sérsic n−Mr) relation for early-type dwarf galaxies. The known Centaurus dSph dwarfs in the survey region (gray squares), Virgo dEs (plus signs; Binggeli & Jerjen 1998), M 81 dSph dwarfs (stars; Chiboucas et al. 2009), Local Group dSph (crosses; Jerjen et al. 2000a), MJB15 known and candidates dSph (small gray and red squares) and the new dSph known dwarfs and candidates of this study (gray and red squares), respectively. Error bars for our candidates and previously known dwarfs in the survey area come from numerics and are listed in Table 2. The error bars for the absolute magnitudes is globally chosen to be ±0.5 mag. We compare nB (Virgo) with nr (M 81, Local Group, MJB15, and this work). |
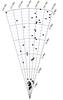 |
Fig. 10 Wedge diagram in right ascension for all galaxies with measured distances in the direction of the survey region (190°<α< 220° and −45°<δ< −20°). Data taken from the Cosmicflows-2 catalog (Tully et al. 2013). The Centaurus group is the prominent overdensity covering the distance interval 3 <D< 6.5 Mpc. The region behind the Centaurus group is the Local Void followed by a low density environment made up of a small number of field galaxies with distances D> 12 Mpc. |
Complementary to this we can compare the shape parameter n from the best-fitting Sérsic profiles of our dwarfs with the Sérsic indices of Local Group, Virgo, M 81, and the known Cen A dwarfs (Fig. 9). The faint end of the shape parameter – luminosity relation is notably widespread. Still, the Sérsic indices of the candidates are in good agreement with the known dwarfs and fit into the relation.
We can also look into the membership question by studying the 3D distribution of galaxies in the direction of the survey region. No massive galaxies are known in the immediate vicinity behind the Centaurus group. This is illustrated in Fig. 10, where we plot the wedge diagram in right ascension for the galaxies with measured distances. Data were taken from the Cosmicflows-2 catalog (Tully et al. 2013). The Centaurus group is the prominent overdensity covering the distance range 3.0 <D< 6.5 Mpc. Behind the group is the Local Void (Tully et al. 2008, 2015) followed by a low density environment made up of a population of field galaxies and small groups. There is no larger concentration of galaxies within 30 Mpc. The conclusion is that galaxies found in our survey area either belong to the Centaurus group or must be background galaxies at least 2–3 times further away.
We further tested the hypothesis that some of our candidates are satellites of luminous background galaxies. For example, dw1321-27 and dw1322-27 are approximately 20 arcmin away from the barred spiral galaxy NGC 5101, which has a velocity of 1868 km s-1 (Koribalski et al. 2004) and a luminosity-line width distance of 27.4 Mpc (Tully & Fisher 1988). At that distance the linear separation between these galaxies would be around 164 kpc. This is comparable with the distance between Fornax and the Milky Way (McConnachie 2012). Nine of our candidates have a background galaxy within a radius of 60 arcmin. We plotted these candidates again in the μ−M diagram (Fig. 11) this time with an absolute magnitude that corresponds to the velocity distance of the background galaxy. The three candidates, dw1301-30, dw1321-27, and dw1403-33, now fall outside of the relation defined by the known dwarfs, making their association to a background galaxy unlikely. The situation for the other six candidates remains ambiguous in this test, and thus they got a bg? label in Table 1. However, given that these candidates are located at the edge of the general trend makes them more likely to be Centaurus group members than background galaxies.
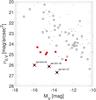 |
Fig. 11 μ0−M relation for the Local Group and Centaurus group galaxies. We added nine dwarf candidates (red squares) adopting the distances of background galaxies that were close to the dwarf in the sky. If a candidate is a satellite of the background galaxy, it should follow the same relation as defined by the Centaurus and Local Group dwarfs. We crossed out the candidates that we dismissed as possible background galaxies, meaning that they are more probably Centaurus group members. The candidates that are closer than 1 mag (radial distance) from any known dwarf in the relation could be background dwarf galaxies and are indicated as bg? in Table 1. All such bg? candidates are still outside of the relation, making them unlikely to be background dwarfs; this is why we still present them as possible Centaurus group members. |
Crnojević et al. (2014) found the first close pair of faint dwarf galaxies outside the Local Group in the halo of Cen A, namely the pair CenA-MM-Dw1 and CenA-MM-Dw2, with a projected distance of 3 kpc. Our galaxy sample contains two other potential pairs of dwarf galaxies in the same group, (dw1243-42, dw1243-42b) and (dw1251-40, dw1252-40). They are separated by 75 arcsec (1.6 kpc at 4.5 Mpc) and 135 arcsec (2.9 kpc at 4.5 Mpc), respectively.
5.3. Galaxy distribution
Tully et al. (2015) reported that almost all members of the Cen A subgroup with known distances are distributed in two thin parallel planes. The authors further noted that one of these planes points in the direction of M 83. Interestingly, all but one of the nine dwarfs detected in the PISCeS survey also belong to the two planes (Crnojević et al. 2016). Looking at the 2D distribution of our new dwarf candidates, we find that a significant number of those candidates in the vicinity of Cen A are aligned in the Cen A-M 83 direction (see Fig. 2). This confirms the result of the PISCeS survey that most of their galaxies were found in the northward direction. The opposite situation is observed in the M 83 subgroup where the MJB15 candidates are preferentially found southward of M 83 in the direction of Cen A. Intriguingly, even when looking on the galactic scale there is evidence of asymmetry, such as the lopsided distribution of star-forming regions in the outer disk of M 83 with a large number detected on the southern side and only a few on the northern side as evident in deep GALEX images (Thilker et al. 2005). Is this a hint of some kind of dwarf galaxy substructure between the two main galaxies, possibly a filament of dwarf galaxy infall, or an extension of the Cen A plane? Another interesting feature revealed by the new candidates is an elongated, filamentary structure that runs diagonally through the group, from (α/δ) ≈ (14:20, −33) to ≈(12:40, −43), seemingly separating the two subgroups (see Fig. 2). At the distance of 4.5 Mpc this structure extends over 1.8 Mpc. Accurate distances to the new dwarf galaxy candidates will be needed for a more quantitative assessment of the substructural properties of the Centaurus group.
6. Conclusions
We have conducted the first CCD-based, large-scale survey of the nearby Centaurus group covering an area of over 500 square degrees or 3.3 Mpc2. We found a total of 41 new dwarf galaxy candidates (in addition to 16 new candidates reported on previously in MJB15) in the magnitude range 17 <r< 20.5 mag and surface brightness range of 24 < ⟨ μ ⟩ eff,r< 27 mag asec-2 pushing the absolute magnitude limit of the galaxy population down to Mr ≈ −9.5. Although no distance information is currently available, except for dw1335-29 (Carrillo et al. 2016), the comparison of the photometric and structural parameters of the candidates with the known dwarf galaxies strongly suggests that the majority of the galaxies belong to the Centaurus group. Follow-up measurements of the distances are crucial to confirm their membership. There are a number of research areas that will greatly benefit from further analysis of the new galaxies. The mere abundance and spatial distribution of the Centaurus galaxies will be a new empirical benchmark to test structure formation processes and the cosmological models behind them. Is the Local Group a statistical outlier or does the conflict with ΛCDM also apply to the Centaurus group? In this context, understanding the two galaxy planes will play a central role. How were they formed and why are they almost parallel? Is there a dwarf galaxy bridge from Cen A to the M 83 subgroup? The expected small distance uncertainties in the range of 0.2–0.5 Mpc from the TRGB method will be instrumental to trace the 3D galaxy distribution along the 2 Mpc line-of-sight depth of the Centaurus group. It will be intriguing to see how the new dwarf galaxies are distributed in the double planar structure. One possibility is that they will increase the statistical significance of the bimodality, proving the double structure to be real beyond any doubt. The exact significance level will depend on the intrinsic thickness of the planes, the plane orientations relative to the line-of-sight, and the number of galaxies in each component. Another possible outcome is that the new galaxies fill the ≈0.1 Mpc gap between the two planes (see histogram on the right side of Fig. 1 of Tully et al. 2015) and thus reveal that the double planar structure was in fact an artifact of small number statistics. How do the stellar populations in the new Centaurus dwarfs compare to Local Group look-alikes? Crnojević et al. (2010, 2011a,b, 2012) conducted an extensive study of the resolved stellar content of dwarf galaxies in the Centaurus group. They investigated their star formation histories and metallicity content, and what effect the denser environment has on shaping these properties. With the large number of new dwarf galaxies available from our study, this work can be extended and pushed toward lower limits, allowing statistically more robust comparisons with the Local Group dwarf galaxy population.
Acknowledgments
O.M. and B.B. are grateful to the Swiss National Science Foundation for financial support. H.J. acknowledges the support of the Australian Research Council through Discovery projects DP120100475 and DP150100862. The authors would like to thank Dmitry Makarov and the anonymous referee for helpful comments that improved the paper. This project used data obtained with the Dark Energy Camera (DECam), which was constructed by the Dark Energy Survey (DES) collaborating institutions: Argonne National Lab, University of California Santa Cruz, University of Cambridge, Centro de Investigaciones Energeticas, Medioambientales y Tecnologicas-Madrid, University of Chicago, University College London, DES-Brazil consortium, University of Edinburgh, ETH-Zurich, Fermi National Accelerator Laboratory, University of Illinois at Urbana-Champaign, Institut de Ciencies de l’Espai, Institut de Fisica d’Altes Energies, Lawrence Berkeley National Lab, Ludwig-Maximilians Universitat, University of Michigan, National Optical Astronomy Observatory, University of Nottingham, Ohio State University, University of Pennsylvania, University of Portsmouth, SLAC National Lab, Stanford University, University of Sussex, and Texas A&M University. Funding for DES, including DECam, has been provided by the US Department of Energy, National Science Foundation, Ministry of Education and Science (Spain), Science and Technology Facilities Council (UK), Higher Education Funding Council (England), National Center for Supercomputing Applications, Kavli Institute for Cosmological Physics, Financiadora de Estudos e Projetos, Fundao Carlos Chagas Filho de Amparo a Pesquisa, Conselho Nacional de Desenvolvimento Cientfico e Tecnolgico and the Ministrio da Cincia e Tecnologia (Brazil), the German Research Foundation-sponsored cluster of excellence “Origin and Structure of the Universe” and the DES collaborating institutions. This research was made possible through the use of the AAVSO Photometric All-Sky Survey (APASS), funded by the Robert Martin Ayers Sciences Fund.
References
- Ahn, C. P., Alexandroff, R., Allen de Prieto, C., et al. 2014, ApJS, 211, 17 [NASA ADS] [CrossRef] [Google Scholar]
- Banks, G. D., Disney, M. J., Knezek, P. M., et al. 1999, ApJ, 524, 612 [NASA ADS] [CrossRef] [Google Scholar]
- Barnes, D. G., Staveley-Smith, L., de Blok, W. J. G., et al. 2001, MNRAS, 322, 486 [NASA ADS] [CrossRef] [Google Scholar]
- Bertin, E., Mellier, Y., Radovich, M., et al. 2002, in Astronomical Data Analysis Software and Systems XI, eds. D. A. Bohlender, D. Durand, & T. H. Handley, ASP Conf. Ser., 281, 228 [Google Scholar]
- Binggeli, B., & Jerjen, H. 1998, A&A, 333, 17 [NASA ADS] [Google Scholar]
- Boylan-Kolchin, M., Bullock, J. S., & Kaplinghat, M. 2011, MNRAS, 415, L40 [CrossRef] [Google Scholar]
- Carrillo, A. J., Bell, E. F., Bailin, J., & Monachesi, A. 2016, in AAS Meeting Abstracts, 227, 136.25 [Google Scholar]
- Cautun, M., Bose, S., Frenk, C. S., et al. 2015, MNRAS, 452, 3838 [NASA ADS] [CrossRef] [Google Scholar]
- Chiboucas, K., Karachentsev, I. D., & Tully, R. B. 2009, AJ, 137, 3009 [NASA ADS] [CrossRef] [Google Scholar]
- Chiboucas, K., Jacobs, B. A., Tully, R. B., & Karachentsev, I. D. 2013, AJ, 146, 126 [NASA ADS] [CrossRef] [Google Scholar]
- Crnojević, D., Grebel, E. K., & Koch, A. 2010, A&A, 516, A85 [NASA ADS] [CrossRef] [EDP Sciences] [Google Scholar]
- Crnojević, D., Grebel, E. K., & Cole, A. A. 2011a, A&A, 530, A59 [NASA ADS] [CrossRef] [EDP Sciences] [Google Scholar]
- Crnojević, D., Rejkuba, M., Grebel, E. K., da Costa, G., & Jerjen, H. 2011b, A&A, 530, A58 [NASA ADS] [CrossRef] [EDP Sciences] [Google Scholar]
- Crnojević, D., Grebel, E. K., & Cole, A. A. 2012, A&A, 541, A131 [NASA ADS] [CrossRef] [EDP Sciences] [Google Scholar]
- Crnojević, D., Sand, D. J., Caldwell, N., et al. 2014, ApJ, 795, L35 [NASA ADS] [CrossRef] [Google Scholar]
- Crnojević, D., Sand, D. J., Spekkens, K., et al. 2016, ApJ, 823, 19 [NASA ADS] [CrossRef] [Google Scholar]
- Dunn, L. P., & Jerjen, H. 2006, AJ, 132, 1384 [NASA ADS] [CrossRef] [Google Scholar]
- Ferguson, H. C. 1990, Ph.D. Thesis, Johns Hopkins Univ., Baltimore, MD [Google Scholar]
- Ferguson, H. C., & Sandage, A. 1988, AJ, 96, 1520 [NASA ADS] [CrossRef] [Google Scholar]
- Henden, A., & Munari, U. 2014, Contributions of the Astronomical Observatory Skalnate Pleso, 43, 518 [Google Scholar]
- Huchtmeier, W. K., Karachentsev, I. D., & Karachentseva, V. E. 2001, A&A, 377, 801 [NASA ADS] [CrossRef] [EDP Sciences] [Google Scholar]
- Ibata, R. A., Lewis, G. F., Conn, A. R., et al. 2013, Nature, 493, 62 [CrossRef] [Google Scholar]
- Javanmardi, B., Martinez-Delgado, D., Kroupa, P., et al. 2016, A&A, 588, A89 [NASA ADS] [CrossRef] [EDP Sciences] [Google Scholar]
- Jerjen, H., Binggeli, B., & Freeman, K. C. 2000a, AJ, 119, 593 [NASA ADS] [CrossRef] [Google Scholar]
- Jerjen, H., Freeman, K. C., & Binggeli, B. 2000b, AJ, 119, 166 [NASA ADS] [CrossRef] [Google Scholar]
- Jerjen, H., Rekola, R., Takalo, L., Coleman, M., & Valtonen, M. 2001, A&A, 380, 90 [NASA ADS] [CrossRef] [EDP Sciences] [Google Scholar]
- Karachentsev, I. D., Sharina, M. E., Dolphin, A. E., et al. 2002, A&A, 385, 21 [NASA ADS] [CrossRef] [EDP Sciences] [Google Scholar]
- Karachentsev, I. D., Karachentseva, V. E., Huchtmeier, W. K., & Makarov, D. I. 2004, AJ, 127, 2031 [Google Scholar]
- Karachentsev, I. D., Makarov, D. I., & Kaisina, E. I. 2013, AJ, 145, 101 [NASA ADS] [CrossRef] [Google Scholar]
- Karachentseva, V. E., & Karachentsev, I. D. 1998, A&AS, 127, 409 [NASA ADS] [CrossRef] [EDP Sciences] [Google Scholar]
- Kauffmann, G., White, S. D. M., & Guiderdoni, B. 1993, MNRAS, 264, 201 [NASA ADS] [CrossRef] [Google Scholar]
- Klypin, A., Kravtsov, A. V., Valenzuela, O., & Prada, F. 1999, ApJ, 522, 82 [Google Scholar]
- Koch, A., & Grebel, E. K. 2006, AJ, 131, 1405 [NASA ADS] [CrossRef] [Google Scholar]
- Koribalski, B. S., Staveley-Smith, L., Kilborn, V. A., et al. 2004, AJ, 128, 16 [NASA ADS] [CrossRef] [Google Scholar]
- Kroupa, P., Theis, C., & Boily, C. M. 2005, A&A, 431, 517 [NASA ADS] [CrossRef] [EDP Sciences] [Google Scholar]
- Lauberts, A., & Valentijn, E. A. 1989, The surface photometry catalogue of the ESO-Uppsala galaxies (Garching: European Southern Observatory) [Google Scholar]
- Lisker, T., Grebel, E. K., & Binggeli, B. 2008, AJ, 135, 380 [NASA ADS] [CrossRef] [Google Scholar]
- Lupton, R. 2005, Transformations between SDSS magnitudes and other systems https://www.sdss3.org/dr10/algorithms/sdssUBVRITransform.php/ [Google Scholar]
- Makarova, L., Karachentsev, I., Rizzi, L., Tully, R. B., & Korotkova, G. 2009, MNRAS, 397, 1672 [NASA ADS] [CrossRef] [Google Scholar]
- McConnachie, A. W. 2012, AJ, 144, 4 [NASA ADS] [CrossRef] [Google Scholar]
- Merritt, A., van Dokkum, P., & Abraham, R. 2014, ApJ, 787, L37 [NASA ADS] [CrossRef] [Google Scholar]
- Metcalfe, N., Godwin, J. G., & Peach, J. V. 1994, MNRAS, 267, 431 [NASA ADS] [CrossRef] [Google Scholar]
- Metz, M., Kroupa, P., & Jerjen, H. 2007, MNRAS, 374, 1125 [NASA ADS] [CrossRef] [Google Scholar]
- Moore, B., Ghigna, S., Governato, F., et al. 1999, ApJ, 524, L19 [Google Scholar]
- Müller, O., Jerjen, H., & Binggeli, B. 2015, A&A, 583, A79 [NASA ADS] [CrossRef] [EDP Sciences] [Google Scholar]
- Pawlowski, M. S., Pflamm-Altenburg, J., & Kroupa, P. 2012, MNRAS, 423, 1109 [NASA ADS] [CrossRef] [Google Scholar]
- Pawlowski, M. S., Kroupa, P., & Jerjen, H. 2013, MNRAS, 435, 1928 [NASA ADS] [CrossRef] [Google Scholar]
- Pawlowski, M. S., Famaey, B., Jerjen, H., et al. 2014, MNRAS, 442, 2362 [NASA ADS] [CrossRef] [Google Scholar]
- Pawlowski, M. S., McGaugh, S. S., & Jerjen, H. 2015, MNRAS, 453, 1047 [NASA ADS] [CrossRef] [Google Scholar]
- Rekola, R., Jerjen, H., & Flynn, C. 2005, A&A, 437, 823 [NASA ADS] [CrossRef] [EDP Sciences] [Google Scholar]
- Rizzi, L., Held, E. V., Saviane, I., Tully, R. B., & Gullieuszik, M. 2007, MNRAS, 380, 1255 [NASA ADS] [CrossRef] [MathSciNet] [Google Scholar]
- Sand, D. J., Crnojević, D., Strader, J., et al. 2014, ApJ, 793, L7 [NASA ADS] [CrossRef] [Google Scholar]
- Saviane, I., & Jerjen, H. 2007, AJ, 133, 1756 [NASA ADS] [CrossRef] [Google Scholar]
- Schlafly, E. F., & Finkbeiner, D. P. 2011, ApJ, 737, 103 [NASA ADS] [CrossRef] [Google Scholar]
- Secker, J. 1995, PASP, 107, 496 [NASA ADS] [CrossRef] [Google Scholar]
- Sersic, J. L. 1968, Atlas de galaxias australes (Cordoba, Argentina: Observatorio Astronomico) [Google Scholar]
- Simon, J. D., & Geha, M. 2007, ApJ, 670, 313 [NASA ADS] [CrossRef] [Google Scholar]
- Stetson, P. B. 1987, PASP, 99, 191 [NASA ADS] [CrossRef] [Google Scholar]
- Thilker, D. A., Bianchi, L., Boissier, S., et al. 2005, ApJ, 619, L79 [NASA ADS] [CrossRef] [Google Scholar]
- Tonry, J., & Schneider, D. P. 1988, AJ, 96, 807 [NASA ADS] [CrossRef] [Google Scholar]
- Tully, R. B. 2015, AJ, 149, 171 [NASA ADS] [CrossRef] [Google Scholar]
- Tully, R. B., & Fisher, J. R. 1988, Catalog of Nearby Galaxies (Cambridge University Press) [Google Scholar]
- Tully, R. B., Shaya, E. J., Karachentsev, I. D., et al. 2008, ApJ, 676, 184 [NASA ADS] [CrossRef] [Google Scholar]
- Tully, R. B., Courtois, H. M., Dolphin, A. E., et al. 2013, AJ, 146, 86 [NASA ADS] [CrossRef] [Google Scholar]
- Tully, R. B., Libeskind, N. I., Karachentsev, I. D., et al. 2015, ApJ, 802, L25 [Google Scholar]
- Valdes, F., Gruendl, R., & DES Project 2014, in Astronomical Data Analysis Software and Systems XXIII, eds. N. Manset, & P. Forshay, ASP Conf. Ser., 485, 379 [Google Scholar]
- Walker, M. 2013, Dark Matter in the Galactic Dwarf Spheroidal Satellites, eds. T. D. Oswalt, & G. Gilmore, 1039 [Google Scholar]
- Wetzel, A. R., Hopkins, P. F., Kim, J.-H., et al. 2016, ApJ, 827, L23 [NASA ADS] [CrossRef] [Google Scholar]
- York, D. G., Adelman, J., Anderson, Jr., J. E., et al. 2000, AJ, 120, 1579 [Google Scholar]
Appendix A: Additional table
Photometric parameters of known dwarf galaxies in the surveyed region.
All Tables
Photometric and structural parameters of the new Centaurus group dwarf candidates in the surveyed region.
All Figures
|
Fig. 1 Surveyed area of ≈550 square degrees in the Centaurus group. The individual DECam fields are represented by circles. The colors indicate the three different sets of data; the fields around M 83 were discussed in the MJB15 study and are shown as black circles. The blue and red fields were observed in 2014 and 2015, respectively, and analyzed for the present paper. The small black dots are the known dwarfs in the Centaurus group listed in the Local Volume Catalog (Karachentsev et al. 2004, 2013) complemented by the recently discovered nine dwarfs of Crnojević et al. (2014, 2016). The larger black dots are the two dominant group galaxies M 83 (13h37m00.9s, −29d51m56s) and Cen A (13h25m27.6s, −43d01m09s). |
| In the text | |
|
Fig. 2 Same as Fig. 1 but without the DECam pointings, showing the 41 newly detected dwarf galaxy candidates as red dots. The 16 dwarf candidates we previously reported in the vicinity of M 83 (MJB15; survey footprint shown as large rectangle) are indicated as small gray circles. The survey area of the Crnojević et al. (2014, 2016) study around Cen A is approximated with the small rectangle. |
| In the text | |
|
Fig. 3 Example of a low surface brightness feature (indicated with red lines) close to Galactic cirrus. The object was dismissed as dwarf galaxy candidate for reasons explained in the text. |
| In the text | |
|
Fig. 4 Gallery showing DECam r-band images of the new Centaurus group dwarf galaxy candidates. One side of an image is 2.25 arcmin or 3.0 kpc at 4.5 Mpc. North is to the top, east to the left. |
| In the text | |
|
Fig. 4 continued. |
| In the text | |
|
Fig. 5 Comparison of B-band photometry for known Centaurus group galaxies in our survey area. Values from the literature (for references see Table 3) versus the B-band magnitude we derived from our gr photometry. We adopt a conservative error of 0.4 mag for our data, which includes the uncertainties for both filters. Photometric uncertainties for the literature values were taken from the publications. The unity line is shown as a solid line. For five galaxies the magnitude difference is larger than the error tolerance (indicated in red). These discrepant cases are discussed in the text. |
| In the text | |
|
Fig. 6 For our candidates, log (reff)−M relation in the V band (red squares), all known dwarfs of the Centaurus group in the surveyed area for which photometry was possible (gray filled squares), Local Group dwarf galaxies (gray dots; McConnachie 2012) and the candidates from MJB15 (black squares). Also plotted are conservative error bars of 0.5 mag for MV and 0.05 for log (reff). Absolute magnitudes are based on a mean distance of 4.5 Mpc to all Centaurus galaxy candidates. The solid curve represents the completeness limit of the survey. It suggests that most low surface brightness galaxies larger than 26′′ in diameter at the isophotal magnitude of 28 mag arcsec-2 were detected (for more details see text). |
| In the text | |
|
Fig. 7 Radial surface brightness profiles and best-fitting Sérsic profiles with 1σ confidence intervals for all dwarf candidates in the r band. |
| In the text | |
|
Fig. 8 For our dwarf candidates, μ0−M relation in the V band (red squares), all known dwarfs of the Centaurus group in the survey area (gray filled squares), Local Group dwarf galaxies (dots; McConnachie 2012) and the candidates from MJB15 (black squares). The newly discovered Centaurus dwarf candidates have similar properties to those of known Centaurus dwarfs and Local Group dwarfs. |
| In the text | |
|
Fig. 9 Shape parameter – luminosity (Sérsic n−Mr) relation for early-type dwarf galaxies. The known Centaurus dSph dwarfs in the survey region (gray squares), Virgo dEs (plus signs; Binggeli & Jerjen 1998), M 81 dSph dwarfs (stars; Chiboucas et al. 2009), Local Group dSph (crosses; Jerjen et al. 2000a), MJB15 known and candidates dSph (small gray and red squares) and the new dSph known dwarfs and candidates of this study (gray and red squares), respectively. Error bars for our candidates and previously known dwarfs in the survey area come from numerics and are listed in Table 2. The error bars for the absolute magnitudes is globally chosen to be ±0.5 mag. We compare nB (Virgo) with nr (M 81, Local Group, MJB15, and this work). |
| In the text | |
|
Fig. 10 Wedge diagram in right ascension for all galaxies with measured distances in the direction of the survey region (190°<α< 220° and −45°<δ< −20°). Data taken from the Cosmicflows-2 catalog (Tully et al. 2013). The Centaurus group is the prominent overdensity covering the distance interval 3 <D< 6.5 Mpc. The region behind the Centaurus group is the Local Void followed by a low density environment made up of a small number of field galaxies with distances D> 12 Mpc. |
| In the text | |
|
Fig. 11 μ0−M relation for the Local Group and Centaurus group galaxies. We added nine dwarf candidates (red squares) adopting the distances of background galaxies that were close to the dwarf in the sky. If a candidate is a satellite of the background galaxy, it should follow the same relation as defined by the Centaurus and Local Group dwarfs. We crossed out the candidates that we dismissed as possible background galaxies, meaning that they are more probably Centaurus group members. The candidates that are closer than 1 mag (radial distance) from any known dwarf in the relation could be background dwarf galaxies and are indicated as bg? in Table 1. All such bg? candidates are still outside of the relation, making them unlikely to be background dwarfs; this is why we still present them as possible Centaurus group members. |
| In the text | |
Current usage metrics show cumulative count of Article Views (full-text article views including HTML views, PDF and ePub downloads, according to the available data) and Abstracts Views on Vision4Press platform.
Data correspond to usage on the plateform after 2015. The current usage metrics is available 48-96 hours after online publication and is updated daily on week days.
Initial download of the metrics may take a while.