| Issue |
A&A
Volume 548, December 2012
|
|
|---|---|---|
| Article Number | L2 | |
| Number of page(s) | 4 | |
| Section | Letters | |
| DOI | https://doi.org/10.1051/0004-6361/201219784 | |
| Published online | 20 November 2012 | |
High SiO abundance in the HH212 protostellar jet
1 LERMA, UMR 8112 du CNRS, Observatoire de Paris, École Normale Supérieure, Université Pierre et Marie Curie, Université de Cergy-Pontoise, 61 Av. de l’Observatoire, 75014 Paris, France
e-mail: sylvie.cabrit@obspm.fr
2 INAF, Osservatorio Astrofisico di Arcetri, Largo E. Fermi 5, 50125 Firenze, Italy
3 Institut de Planétologie et d’Astrophysique de Grenoble, UMR 5274, UJF-Grenoble 1/CNRS-INSU, 38041 Grenoble, France
4 IRAM, 300 rue de la Piscine, 38406 Saint-Martin-d’Hères, France
Received: 8 June 2012
Accepted: 26 October 2012
Context. Previous SiO maps of the innermost regions of HH212 set strong constraints on the structure and origin of this jet. They rule out a fast wide-angle wind, and tentatively favor a magneto-centrifugal disk wind launched out to 0.6 AU.
Aims. We aim to assess the SiO content at the base of the HH212 jet to set an independent constraint on the location of the jet launch zone with respect to the dust sublimation radius.
Methods. We present the first sub-arcsecond (0.″44 × 0.″96) CO map of the HH212 jet base, obtained with the IRAM Plateau de Bure Interferometer. Combining this with previous SiO(5–4) data, we infer the CO(2–1) opacity and mass-flux in the high-velocity jet and arrive at a much tighter lower limit to the SiO abundance than possible from the (optically thick) SiO emission alone.
Results. Gas-phase SiO at high velocity contains at least 10% of the elemental silicon if the jet is dusty, and at least 40% if the jet is dust-free, if CO and SiO have similar excitation temperatures. Such a high SiO content is challenging for current chemical models of both dust-free winds and dusty interstellar shocks.
Conclusions. Updated chemical models (equatorial dust-free winds, highly magnetized dusty shocks) and observations of higher J CO lines are required to elucidate the dust content and launch radius of the HH212 high-velocity jet.
Key words: ISM: individual objects: HH212 / ISM: jets and outflows / ISM: molecules / stars: protostars
© ESO, 2012
1. Introduction
The jet origin in accreting young stars and its impact on star and planet formation is still a major enigma. Although a magneto-hydrodynamical (MHD) process appears to be required, it is still debated which fraction of the mass-flux originates from the stellar surface, from reconnections in the magnetosphere-disk interaction zone, or from the disk surface, with all three regions probably contributing to some degree (see e.g. Ferreira et al. 2006, for a review). Rotation searches in atomic microjets from T Tauri stars set an upper limit of ≃ 0.2–3 AU on the launching radius of any atomic steady magneto-centrifugal disk wind (Anderson et al. 2003; Ray et al. 2007, and references therein). On the other hand, MHD disk winds launched beyond 0.2–1 AU are expected to be mostly molecular (Panoglou et al. 2012). Therefore the molecular component of jets holds an important clue to the total radial extent of the launch zone.
A key species in this respect is SiO, a specific tracer of molecular jets from the youngest Class 0 protostars, with minimal contamination by ambient swept-up gas (Guilloteau et al. 1992; Gueth et al. 1999; Hirano et al. 2006; 2010). The HH212 jet in Orion (Zinnecker et al. 1998) provides particularly interesting constraints on jet structure. An inner bipolar microjet peaking at ± 500–1000 AU from the source was discovered in SiO (Codella et al. 2007, hereafter Paper I). The fastest SiO gas reaches radial velocities ≃ ± 10 km s-1 from systemic, i.e. a flow speed Vp ≃ 150 km s-1 after correction for inclination ( ≃ 4° from the plane of the sky; Claussen et al. 1998), arguing that it is tracing material closely associated with the primary jet. This view is supported by its narrow width ≤ 90 AU (Cabrit et al. 2007, hereafter Paper II) and by the small blue/red overlap in SiO despite a quasi edge-on view, which restricts the opening angle of the fastest SiO gas to < 4°–6° (Paper I). At low radial velocities less than ± 6 km s-1 from systemic, SiO traces broader structures consistent with expanding jet-driven bowshocks (Lee et al. 2008). The pointed shape of these bowshocks requires that the wind speed drops sharply away from the axis. This appears to be inconsistent with the fast wide-angle wind predicted by the X-wind model (cf. Cai et al. 2008), and requires a slow wide-angle wind (if any) more compatible with an extended disk wind.
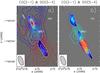 |
Fig. 1 CO(2–1) emission (blue and red contours) overlaid on top of SiO(5–4) emission from Paper I (color scale with white contours). Both maps were cleaned with the same beam of |
An extended MHD disk wind also seems favored by the tentative rotation signatures reported across the tip of the SiO bowshocks. A magneto-centrifugal launch radius of 0.3–0.05 AU was inferred assuming a flow speed Vp = 100 − 200 km s-1 (Lee et al. 2008); but the low mean radial velocity of the rotating gas, | V − Vsys | = 1.5 − 4 km s-1, implies a lower deprojected flow speed Vp ≃ 20 − 60 km s-1, hence a larger launch radius of 0.6 AU in both lobes (see Eq. (5) in Anderson et al. 2003), if the rotation interpretation is correct. Unfortunately, no rotation estimates are yet available for the fastest SiO jet material, as it remains unresolved laterally at 0 3 resolution (Paper I; Lee et al. 2008).
The SiO gas-phase abundance may offer an independent clue to the location of the jet origin with respect to the dust sublimation radius ( ≃ 0.2 AU), since silicon is one of the main grain constituents. Our previous line ratio analysis in the HH212 microjet shows that SiO is optically thick for Jup = 2 to 8. The implied minimum SiO abundance strongly depends on the poorly-known jet density and line-of-sight velocity gradient, and varies between 0.05% and 90% of the elemental silicon (Paper II). In this letter, we present new PdBI CO(2–1) observations of the HH212 microjet, which allow us to put more severe constrains on its density, mass-flux, and SiO abundance. We compare the latter with chemical models of dust-free vs. dusty winds, and outline the work required to proceed in solving this question.
2. Observations
CO(2–1) observations of the central region of the HH212 outflow were obtained in February 2008 and January, March, and April 2009 with the IRAM Plateau de Bure Interferometer (PdBI) in France. The six-element array was used in its A, B, and C configurations (baselines from 48 m up to 760 m) for a total time of ~23 h. The CO(2–1) line at 230.5380 GHz was observed with a 40 MHz (~50 km s-1) bandwidth and a channel sampling of ~0.1 km s-1, later smoothed to 1 km s-1 to increase the signal-to-noise ratio. Two units with a bandwidth of 320 MHz were used to measure the continuum. The data were reduced using the public GILDAS1 software. Amplitude and phase were calibrated on observations of 0528+134 and 0605–085. The absolute flux density scale was determined on MWC 349 with an estimated uncertainty of ~25%. Line and continuum maps were produced using natural weighting and were restored with a clean beam of  (PA = 20°). Since we are interested only in the innermost jet knots within ± 2′′ of the central source, no correction was applied for primary beam attenuation (HPBW ≃ 22′′). The flux, position, and size of the continuum source all agree with the 1.4 mm data presented in Paper I, except for the tentative source MM2, which is not confirmed. The secondary source seen at 850 μm by Lee et al. (2008) at Δα = +1′′, Δδ = –07 is also unconfirmed (see Fig. 1). In the following, we concentrate on our results in CO(2–1). Radial velocities are expressed in the VLSR rest frame unless otherwise specified.
3. Results
3.1. The inner 5′′: outflow cavity vs. jet emission
Figure 1 compares in two different velocity ranges the cleaned CO(2–1) map of the inner 5′′ of the outflow with the SiO(5–4) map from Paper I, restored here with the same synthesized beam as for CO(2–1). In the left-hand panel (Fig. 1a) both lines are summed over a medium-velocity interval (hereafter MV) covering [− 9.5 km s-1, − 1.5 km s-1] in the blue and [+ 4.5 km s-1, +9.5 km s-1] in the red. It can be seen that the CO MV emission peaks along the SiO axis, but also delineates a broader component not seen in SiO, with a biconical morphology opening away from the exciting source. This corresponds to the base of the CO swept-up cavity mapped on larger scale by Lee et al. (2006; 2007). Owing to this extended component and the lack of short spacings in our u − v coverage, the reconstructed CO brightness in the MV range is very sensitive to the chosen cleaning parameters. In the right-hand panel (Fig. 1b) both lines are summed over a high-velocity interval (hereafter HV) covering [− 16.5 km s-1, − 9.5 km s-1] in the blue and [+ 9.5 km s-1, + 12.5 km s-1] in the red. In this HV interval, CO is seen to trace the same gas as SiO, i.e. a narrow jet still unresolved in the transverse direction, with no significant contamination from the broad cavity. We verified that contrary to the MV emission, the HV emission is compact enough that its flux is robust and independent of cleaning parameters.
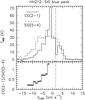 |
Fig. 2 Top panel: line profiles in CO(2–1) (solid) and SiO(5–4) (dashed) toward the northern SiO peak. Bottom panel: ratio of CO(2–1) to SiO(5–4). The vertical dot-dashed line marks the ambient LSR velocity (+1.6 km s-1; Wiseman et al. 2001). |
3.2. CO(2–1) opacity in the HV jet
As shown in Paper II and confirmed by Lee et al. (2008), SiO(5–4) is close to LTE and optically thick in the inner HH212 knots. On the other hand, the high ratio CO(3–2)/CO(2–1) > 1.5–2 seen at high velocity (Lee et al. 2007) requires that CO(2–1) is optically thin in the HV jet. We may then infer its opacity  from the line temperature ratio R of CO(2–1) to SiO(5–4) as
  (
( /
/ ), where and are the excitation temperatures of CO and SiO, respectively. Since CO has a lower dipole moment than SiO, it is even more easily at LTE and we expect that ≃ Tk. Furthermore, the SiO knots are sufficiently far from the protostar (500 AU) and from any other radiation source that mechanical heating (e.g. shocks, mixing-layers, ambipolar diffusion) will largely dominate over radiative heating (Shang et al. 2002; Panoglou et al. 2012). Therefore, any strong local gradient in Tk should come with a steep accompanying velocity gradient, and we will minimize the difference between and caused by such gradients by examining the ratio Ras a function of velocity.
In Fig. 2, we plot the main beam temperature ratio R as a function of velocity toward the (northern) blue SiO inner knot. In the HV blue range V < − 9.5 km s-1, the CO(2–1)/SiO(5–4) ratio is characterized by a low value R ≃ 0.2, and we infer that (/) ≃ 0.2. In the redshifted HV range, the ratio R appears similar but CO(2–1) is affected by a strong dip around VLSR ≃ + 9 km s-1, also seen in CO(3–2) (Lee et al. 2007). This dip is present at all positions and may be caused by an extended foreground component fully resolved-out by interferometers. Given this complicating circumstance, we focus on the blue HV jet below.
3.3. HV jet density and mass-flux
Since the HV blue material is optically thin (Lee et al. 2007), its beam-averaged CO column density, NCO(HVB), can be inferred from the CO(2–1) integrated intensity, without opacity correction. At the northern peak, we measure TmbdV = 8.2 K km s-1 over the HV range and infer that NCO(HVB)  cm-2 for LTE in the range ≃ 50 − 500 K determined in Paper II.
We may also infer a lower limit to the volume density of the HV blue jet at the northern peak. With a jet diameter  AU (cf. Paper II), and a beam size across the jet
  AU, we find
  cm-3, where XCO is the CO gas-phase abundance relative to H nuclei.
Assuming a steady flow along the jet axis, we may also estimate the one-sided jet mass-flux as given by (see Lee et al. 2007)  where Vj = 150 km s-1 is the relevant deprojected speed for the HV jet (cf. Sect. 1). This Ṁj is ten times lower than the value of Lee et al. (2007) for the same , because we excluded the MV CO emission (dominated by the slower bowshocks and the large-scale cavity). The appropriate choice of XCO depends on the assumed dust content in the jet. Chemical models of dense Class 0 jets show that CO self-screens efficiently against FUV photons and contains most of the available gas-phase carbon not locked in grains (Glassgold et al. 1991; Panoglou et al. 2012). Correspondingly, we expect XCO ≃ 3.5×10⁻⁴ (solar carbon abundance; Holweger 2001) when the wind is dust-free, and XCO ≃ 10-4 for an interstellar dust/gas ratio ≃ 1% (Flower & Pineau des Forêts 2003). Hence, the above values for Ṁj and nH are decreased by a factor ≃ 3.5 if the HV jet is grain-free, while they both increase by a factor 10 for a high = 500 K.
3.4. SiO abundance in the high-velocity jet
Using the on line RADEX code (Van der Tak et al. 2007) in the large velocity gradient (LVG) approximation, we compared the LTE opacities of SiO lines versus that of CO(2–1). For the SiO(2–1) line and Tk = 50–500 K, we find that 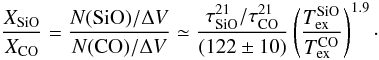 (1)With our result from Sect. 3.2 that (/) ≃ R = 0.2, and the observational constraint
  > 1 (cf. Paper II), we infer that XSiO/XCO > 0.04f (/)0.9. Adopting the XCO values discussed above and a solar elemental abundance for silicon [Si/H]⊙ ≃ 3.5×10⁻⁵ (Holweger 2001), we obtain that gas-phase SiO in the inner blue jet knot of HH 212 represents at least ≃ 10% of the elemental silicon if the wind is dusty, and at least ≃ 40% of it if the wind is dust-free, with an uncertainty factor of (/)0.9. The uncertainty in XSiO from this method is ≲ factor 2 in planar C-shock models.
4. Implications for the launch radius of the SiO jet
An SiO abundance reaching ≥ 10% − 40% of elemental silicon is challenging for current models of MHD winds – both dust-free and dusty. We discuss each of these two cases below.
The chemistry of dust-free MHD winds was investigated in 1D by Glassgold et al. (1991). The wind is launched from a 5000 K protostar of radius R0 = 10 R⊙ = 0.045 AU, and undergoes various degrees of acceleration and expansion. The fraction of silicon in the form of SiO reaches ≳ 50% only when the base density exceeds a critical value, corresponding to an isotropic mass-flux rate ≥ 3×10⁻⁶ M⊙/yr in their accelerating model. This is well above our estimate of Ṁj ≤ 3×10⁻⁷ M⊙ yr-1 for the HV jet in HH212, if dust free with Tk ≤ 500 K (see Sect. 3.3). Furthermore, when a flat far-ultraviolet (FUV) excess below 2000 Å is present, SiO is entirely photodissociated throughout the wind (see Fig. 10 of Glassgold et al. 1991). The assumed FUV photon flux at the SiO dissociation limit ≃ 8 eV is similar to that produced by an accretion shock of blackbody temperature 10 000 K and total luminosity 3.5 L⊙. The Class 0 protostar of 14 L⊙ driving the HH212 outflow (Claussen et al. 1998) should have a FUV flux from accretion at least as high, hence negligible SiO in the wind. Increasing the launch radius would not solve the problem, since both the base wind density and the radiation field would drop as  , keeping the same ratio of SiO reformation to photodissociation rates. Therefore, spherical dust-free winds do not seem able to reproduce the high SiO content in the HH212 jet.
A possible factor favoring SiO synthesis in dust-free winds would be if the jet does not arise from  but from a narrow equatorial annulus of width ΔR ≪ R0, e.g. as assumed in the X-wind model (Cai et al. 2008). This would increase the base density by a large factor R0/ΔR for the same jet mass-flux, thus enhancing Si+ recombination and SiO formation with respect to photodissociation. However, this hollow wind geometry would also enable the penetration of destructive FUV photons through the emptied polar regions (see Panoglou et al. 2012), an effect not included in the 1D calculations of Glassgold et al. (1991). Detailed chemical wind models in 2D with a FUV accretion excess are thus necessary to check whether an equatorial dust-free wind could reach an SiO abundance ≳ 40% of elemental Si, as estimated in the HV jet of HH 212.
An alternative scenario is that SiO would form by shock processing of silicate grains in a dusty wind launched from the disk (Chandler et al. 2001; Panoglou et al. 2012). Recent models of C-type shocks with ion-neutral decoupling suggest that sputtering of charged grains by drifting neutrals can release up to 5% of Si in the gas phase, which then reacts with O2 or OH to form SiO (Schilke et al. 1995; Gusdorf et al. 2008a). A possible problem with sputtering, raised in Paper II, is that the dynamical timescale for the inner SiO knots in HH212 is only 25 yr, which may be too short to complete the sputtering process and the conversion of Si into SiO (Gusdorf et al. 2008b). Fortunately, at the high densities ≥ 105 cm-3 of the HH212 inner knots (cf. Sect. 3.3), grain-grain collisions also become important (Caselli et al. 1997). They will alleviate this problem in two ways: first, by shattering dust grains into smaller fragments, they increase the coupling between charged and neutral fluids and shorten the C-shock timescale. Second, they induce grain vaporization, which directly releases SiO molecules into the gas-phase, reaching up to 5% of the total silicon at 40 km s-1 (see Guillet et al. 2011). The same process may also occur in single-fluid (J-type) shocks, with SiO reaching 2% of the total silicon at 50 km s-1 (Guillet et al. 2009). We note that the above SiO yields refer only to interstellar shock models with Alfvén speeds VA of a few km s-1, a value ≃ 10 times lower than expected at 500 AU in protostellar jets (Hartigan et al. 2007; Garcia et al. 2001). Extrapolating the trends with VA shown in Fig. 5 of Caselli et al. (1997) and Fig. 6 of Guillet et al. (2009) suggests that in dusty MHD jets, grain-grain collisions might be able to release ≳ 10% of Si in the form of SiO, compatible with our estimate in HH212 in the dusty wind case. Dedicated shock models with appropriate initial conditions would be necessary to verify this extrapolation.
In conclusion, ≳ 10%–40% of elemental silicon in the form of SiO is challenging for current chemical models of both dust-free winds and dusty shocks, and calls for additional modeling with more realistic assumptions to clarify the maximum SiO abundance that can be reached in either case. ALMA observations in CO(3–2) and CO(6–5) will also be essential for better constraining the jet temperature, width, mass-flux, and density, as well as the ratio / entering our SiO abundance estimate, all of which are key parameters for distinguishing among current MHD jet models.
Acknowledgments
We are grateful to G. Pineau des Forêts and M. Tafalla for useful discussions, to an anonymous referee for comments that helped to strengthen the paper, and to the IRAM staff for their support with observations. This research has made use of NASA’s Astrophysics Data System, and received financial support from the Programme National de Physico-Chimie du Milieu Interstellaire (PCMI). The IRAM Plateau de Bure Interferometer is funded by INSU/CNRS (France), MPG (Germany) and IGN (Spain).
References
- Anderson, J. M., Li, Z.-Y., Krasnopolsky, R., & Blandford, R. D. 2003, ApJ, 590, L107 [NASA ADS] [CrossRef] [Google Scholar]
- Cabrit, S., Codella, C., Gueth, F., et al. 2007, A&A, 468, L29 (Paper II) [NASA ADS] [CrossRef] [EDP Sciences] [Google Scholar]
- Cai, M. J., Shang, H., Lin, H.-H., & Shu, F. H. 2008, ApJ, 672, 489 [NASA ADS] [CrossRef] [Google Scholar]
- Caselli, P., Hartquist, T. W., & Havnes, O. 1997, A&A, 322, 296 [NASA ADS] [Google Scholar]
- Chandler, C., & Richer, J. S. 2001, ApJ, 555, 139 [NASA ADS] [CrossRef] [Google Scholar]
- Claussen, M. J., Marvel, K. B., Wootten, A., & Wilking, B. A. 1998, ApJ, 507, L79 [NASA ADS] [CrossRef] [Google Scholar]
- Codella, C., Cabrit, S., Gueth, F., et al. 2007, A&A, 462, L53 (Paper I) [NASA ADS] [CrossRef] [EDP Sciences] [Google Scholar]
- Ferreira, J., Dougados, C., & Cabrit, S. 2006, A&A, 453, 785 [NASA ADS] [CrossRef] [EDP Sciences] [Google Scholar]
- Flower, D., & Pineau des Forêts, G. 2003, MNRAS, 343, 390 [NASA ADS] [CrossRef] [Google Scholar]
- Garcia, P. J. V., Ferreira, J., Cabrit, S., & Binette, L. 2001, A&A, 377, 589 [NASA ADS] [CrossRef] [EDP Sciences] [Google Scholar]
- Glassgold, A., Mamon, G. A., & Huggins, P. J. 1991, ApJ, 373, 254 [NASA ADS] [CrossRef] [Google Scholar]
- Gueth, F., & Guilloteau, S. 1999, A&A, 343, 571 [NASA ADS] [Google Scholar]
- Guillet, V., Jones, A. P., & Pineau des Forêts, G. 2009, A&A, 497, 145 [Google Scholar]
- Guillet, V., Pineau des Forêts, G., & Jones, A. P. 2011, A&A, 527, A123 [NASA ADS] [CrossRef] [EDP Sciences] [Google Scholar]
- Guilloteau, S., Bachiller, R., Fuente, A., & Lucas, R. 1992, A&A, 265, L49 [NASA ADS] [Google Scholar]
- Gusdorf, A., Cabrit, S., Flower, D. R., & Pineau des Forêts, G. 2008a, A&A, 482, 809 [Google Scholar]
- Gusdorf, A., Pineau des Forêts, G., Cabrit, S., & Flower, D. R. 2008b, A&A, 490, 695 [NASA ADS] [CrossRef] [EDP Sciences] [Google Scholar]
- Hartigan, P., Frank, A., Varnière, P., & Blackman, E. G. 2007, ApJ, 661, 910 [NASA ADS] [CrossRef] [Google Scholar]
- Hirano, N., Liu, S.-Y., Shang, H., et al. 2006, ApJ, 636, L141 [NASA ADS] [CrossRef] [Google Scholar]
- Hirano, N., Ho, P. P. T., Liu, S.-Y., et al. 2010, ApJ, 717, 58 [NASA ADS] [CrossRef] [Google Scholar]
- Holweger, H. 2001, AIP Conf. Proc., 598, 23 [Google Scholar]
- Lee, C.-F., Ho, P., Beuther, H., et al. 2006, ApJ, 639, 292 [NASA ADS] [CrossRef] [Google Scholar]
- Lee, C.-F., Ho, P. T. P., Hirano, N., et al. 2007, ApJ, 659, 499 [NASA ADS] [CrossRef] [Google Scholar]
- Lee, C.-F., Ho, P. T. P., Bourke, T. L., et al. 2008, ApJ, 685, 1026 [NASA ADS] [CrossRef] [Google Scholar]
- McCaughrean, M., Zinnecker, H., Andersen, M., Meeus, G., & Lodieu, N. 2002, The Messenger, 109, 28 [NASA ADS] [Google Scholar]
- Panoglou, D., Cabrit, S., Pineau des Forêts, G., et al. 2012, A&A, 538, A2 [NASA ADS] [CrossRef] [EDP Sciences] [Google Scholar]
- Ray, T., Dougados, C., Bacciotti, F., Eisloeffel, J., & Chrysostomou, A. 2007, in Protostars and Planets V, eds. B. Reipurth, D. Jewitt, & K. Keil, 231 [Google Scholar]
- Schilke, P., Walmsley, C. M., Pineau des Forêts, G., & Flower, D. R. 1997, A&A, 321, 293 [NASA ADS] [Google Scholar]
- Shang, H., Glassgold, A. E., & Shu, F. H. 2002, ApJ, 564, 853 [NASA ADS] [CrossRef] [Google Scholar]
- Van der Tak, F. F. S., Black, J. H., Schier, F. L., Jansen, D. J., & van Dishoeck, E. F. 2007, A&A, 468, 627 [NASA ADS] [CrossRef] [EDP Sciences] [Google Scholar]
- Wiseman, J., Wootten, A., Zinnecker, H., & McCaughrean, M. 2001, ApJ, 550, L87 [NASA ADS] [CrossRef] [Google Scholar]
- Zinnecker, H., McCaughrean, M. J., & Rayner, J. T. 1998, Nature, 394, 862 [NASA ADS] [CrossRef] [PubMed] [Google Scholar]
All Figures
|
Fig. 1 CO(2–1) emission (blue and red contours) overlaid on top of SiO(5–4) emission from Paper I (color scale with white contours). Both maps were cleaned with the same beam of |
| In the text | |
|
Fig. 2 Top panel: line profiles in CO(2–1) (solid) and SiO(5–4) (dashed) toward the northern SiO peak. Bottom panel: ratio of CO(2–1) to SiO(5–4). The vertical dot-dashed line marks the ambient LSR velocity (+1.6 km s-1; Wiseman et al. 2001). |
| In the text | |
Current usage metrics show cumulative count of Article Views (full-text article views including HTML views, PDF and ePub downloads, according to the available data) and Abstracts Views on Vision4Press platform.
Data correspond to usage on the plateform after 2015. The current usage metrics is available 48-96 hours after online publication and is updated daily on week days.
Initial download of the metrics may take a while.