Fig. 1
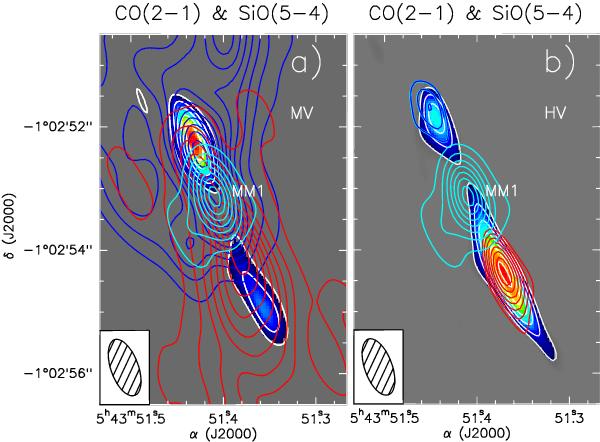
CO(2–1) emission (blue and red contours) overlaid on top of SiO(5–4) emission from Paper I (color scale with white contours). Both maps were cleaned with the same beam of  at PA = 20° (cf. filled ellipse in lower left corner). a) (Left panel) Medium-velocity (MV) emission, integrated over [–9.5, –1.5] km s-1 (blue), and [+3.5, +9.5] km s-1 (red). CO contours range from 6σ (13 K km s-1) to 78σ by 6σ. SiO contours range from 6σ (74 K km s-1) to 18σ by 3σ. b) (Right panel) High-velocity (HV) emission integrated over [–16.5, –9.5] km s-1 (blue), and [+9.5, +12.5] km s-1 (red). CO contours range from 6σ (1.4 and 1.1 K km s-1 for blue and red, respectively) to 13σ by 1σ. SiO contours range from 6σ (21.5 K km s-1) to 21σ by 3σ. In both panels, 1.4 mm continuum from the central source MM1 is shown in light-blue contours, ranging from 10σ (5 mJy beam-1) to 70σ by steps of 10σ.
Current usage metrics show cumulative count of Article Views (full-text article views including HTML views, PDF and ePub downloads, according to the available data) and Abstracts Views on Vision4Press platform.
Data correspond to usage on the plateform after 2015. The current usage metrics is available 48-96 hours after online publication and is updated daily on week days.
Initial download of the metrics may take a while.