| Issue |
A&A
Volume 546, October 2012
|
|
|---|---|---|
| Article Number | A24 | |
| Number of page(s) | 8 | |
| Section | Interstellar and circumstellar matter | |
| DOI | https://doi.org/10.1051/0004-6361/201219736 | |
| Published online | 28 September 2012 | |
High-contrast imaging of the close environment of HD 142527
VLT/NaCo adaptive optics thermal and angular differential imaging⋆,⋆⋆
1 Institut de Planétologie et d’Astrophysique de Grenoble, UJF, CNRS, 414 rue de la piscine, 38400 Saint-Martin d’Hères, France
e-mail: This email address is being protected from spambots. You need JavaScript enabled to view it.
2 LESIA-Observatoire de Paris, CNRS, UMPC Univ. Paris 6, Univ. Paris 7 Diderot, 92195 Meudon, France
3 European Southern Observatory, Alonso de Cordóva 3107, Vitacura, Santiago, Chile
4 Max-Planck-Institut für Astronomie Königstuhl 17, 69117 Heidelberg, Germany
Received: 1 June 2012
Accepted: 6 August 2012
Abstract
Context. It has long been suggested that circumstellar disks surrounding young stars may be the signposts of planets, and even more so since the recent discoveries of embedded substellar companions. According to models, the planet-disk interaction may create large structures, gaps, rings, or spirals in the disk. In that sense, the Herbig star HD 142527 is particularly compelling, as its massive disk displays intriguing asymmetries that suggest the existence of a dynamical peturber of unknown nature.
Aims. Our goal was to obtain deep thermal images of the close circumstellar environment of HD 142527 to re-image the reported close-in structures (cavity, spiral arms) of the disk and to search for stellar and substellar companions that could be connected to their presence.
Methods. We obtained high-contrast images with the NaCo adaptive optics system at the Very Large Telescope in L′-band. We applied different analysis strategies using both classical PSF-subtraction and angular differential imaging to probe for any extended structures or point-like sources.
Results. The circumstellar environment of HD 142527 is revealed at an unprecedented spatial resolution down to the subarcsecond level for the first time at 3.8 μm. Our images reveal important radial and azimuthal asymmetries that invalidate an elliptical shape for the disk. It instead suggests a bright inhomogeneous spiral arm plus various fainter spiral arms. We also confirm an inner cavity down to 30 AU and two important dips at position angles of 0 and 135 deg. The detection performance in angular differential imaging enables exploration of the planetary mass regime for projected physical separations as close as 40 AU. Use of our detection map together with Monte Carlo simulations sets stringent constraints on the presence of planetary mass, brown dwarf or stellar companions as a function of the semi-major axis. They severely limit any presence of massive giant planets with semi-major axis beyond 50 AU, i.e. probably within the large disk’s cavity which extends radially up to 145 AU or even farther outside.
Key words: instrumentation: adaptive optics / stars: variables: T Tauri, Herbig Ae/Be / stars: individual: HD 142527 / protoplanetary disks
Based on observations collected at the European Organization for Astronomical Research in the Southern Hemisphere, Chile, ESO: run 087.C-0299A.
Reduced images are only available at the CDS via anonymous ftp to cdsarc.u-strasbg.fr (130.79.128.5) or via http://cdsarc.u-strasbg.fr/viz-bin/qcat?J/A+A/546/A24
© ESO, 2012
1. Introduction
Since the discovery of the first exoplanet (Mayor & Queloz 1995) around the solar-like star 51 Pegasi, more than 760 have been detected so far using different observing techniques, from radial velocity measurements, photometric transit, microlensing or direct imaging. These discoveries reveal the great diversity of planetary systems in terms of physical properties (atmosphere and interior) and environment (single or multiple planets around single stars, in a circumstellar disk or even circumbinary planets). A new paradigm about the formation, structure, and composition of planets is emerging, wider than what we have learned so far from the Solar System. Moreover, most of the known detected giant planets orbit within 5 AU owing to the detection biases of radial velocity and transit techniques. The statistical properties of this population of close-in planets, the period-mass distribution, the planet-metallicity correlation, together with the densities of Hot Jupiter interiors (Udry & Santos 2007; Mayor et al. 2011) favor a formation mechanism by core accretion followed by gas capture (CA hereafter, Pollack et al. 1996).
At wider orbits, the distribution of giant planets is less well known. However, the discoveries of planetary mass companions to young, nearby stars in direct imaging (AB Pic b, Chauvin et al. 2005; RXJ 1609 b, Lafrenière et al. 2008), and furthermore around Fomalhaut (Kalas et al. 2008) and HR8799 (Marois et al. 2008, 2010) challenge the CA model. This scenario suffers from exceedingly long timescales and low disk surface density at large separations. Alternative scenarii could operate at wide orbits, either combined with CA, such as planet-planet scattering (Crida et al. 2009) and outward planetary migration (see for instance Mordasini et al. 2012) or alternative formation processes must be invoked like gravitational instability (GI hereafter Cameron 1978) or stellar binary mechanisms. These formation processes should lead to different physical and orbital distributions of giant planets (Boley 2009; Dodson-Robinson et al. 2009). As a result, new discoveries are needed to understand planet formation on all orbits.
The technique of direct imaging technique also offers the possibility of detecting giant planets in circumstellar disks to directly study the planet-disk interaction and even dynamically constrain the planets’s mass (Chiang et al. 2009; Lagrange et al. 2012a). Indirect signs of planetary formation, such as clumps, gaps, holes, and spiral arms (see a review in Papaloizou et al. 2007), have probably already been observed within several protoplanetary disks (e.g AB Aur, Fukagawa et al. 2004; TCha, Huélamo et al. 2011; Andrews et al. 2011, SAO 206462; Muto et al. 2012).
In this context, with high-contrast imaging, we observed the close environment of the star HD 142527, known to host an extended protoplanetary disk. HD 142527 is a Herbig star (Waelkens et al. 1996), classified as F6IIIe (Houk 1978). The Hipparcos measurement was revisited by van Leeuwen (2007) leading to a parallax of π = 4.29 ± 0.98 mas, i.e.  pc. However, HD 142527 has been identified as a member of the star-forming region Sco OB2-2 (Acke & van den Ancker 2004) or Upper Centaurus Lupus (de Zeeuw et al. 1999), so the distance would be d = 145 ± 15 pc in both cases. We chose to adopt this distance since we consider that the identification of the membership is more reliable. The age and the mass of the star are also matters of debate since Fukagawa et al. (2006, F06 hereafter) derived an age of
  Myr and M = 1.9 ± 0.3 M⊙ from its stellar UV/optical luminosities and isochrone (from Palla & Stahler 1999), whereas Verhoeff et al. (2011) find an age of ≃ 5 Myr and M = 2.2 ± 0.3 M⊙ based on a new estimation of the stellar luminosity and pre-main sequence isochrones (from Siess et al. 2000). Finally, Pecaut & Mamajek (2010) discuss the age of F-type members of the Sco-Cen OB association and estimate it to be in the range [5;20] Myr. We therefore considered an age between 2 and 20 Myr for further analysis.
HD 142527 properties.
The Table 1 summarizes the stellar properties of HD 142527. This system, resolved by F06 in NIR and Fujiwara et al. (2006) in IR, presents a circumstellar disk that is quite unusual with unprecedented infrared excess (FIR/F ⋆ = 0.98 and FNIR/F ⋆ = 0.32, Dominik et al. 2003) compared to other Herbig stars. Both the evidence of grain growth (deduced from thermal and scattered light observations) and the high level of crystallinity (MIDI observations, van Boekel et al. 2004; and NIR spectrum, Honda et al. 2009) reveal that the outer disk is characterized by highly processed dust. Moreover, F06 notes the presence of a spiral arm, a prominent cavity up to ≃ 150 AU and two asymmetric facing arcs within the disk and measured a stellar offset of ≃ 20 AU with respect to the center of the disk. Models have been computed to fit the infrared excess, the geometry of the inner disk, and the mineralogy of the dust by Verhoeff et al. (2011) who find a disk cavity between 30 and 130 AU separating an inner disk embedded in a halo and a massive outer disk extended to 200 AU. They conclude that ongoing giant planet formation is suggested from the highly evolved status of the disk surrounding HD 142527.
To get a more accurate view of the close-in structures (cavity, spiral arms) of the disk at unprecedented spatial resolution and to search for stellar and substellar companions that could be connected to their formation, we carried out VLT/NaCo observations at L′ band using angular differential imaging (ADI hereafter). We present the observing strategy and the data reduction in Sect. 2, the fine structures and the geometry of the cavity and of the outer disk in Sect. 3, and finally the detection performance and the constraints on the presence of giant planets in Sect. 4.
2. Observations and data reduction
2.1. Observing strategy and observing conditions
HD 142527 was observed on July 29, 2011 under good seeing conditions in the course of the thermal imaging survey of 56 young and dusty stars (Rameau et al., in prep.). We used the VLT/NaCo (Lenzen et al. 2003; Rousset et al. 2003) high-contrast adaptive optics system and imager in angular differential imaging mode (ADI, Marois et al. 2006). The L′-band (λ0 = 3.8 μm, Δλ = 0.62 μm) was used with the L27 camera (platescale ≃ 27.1 mas/pixel). Twilight flats were obtained for calibration. A first set of short unsaturated exposures with a neutral density filter (ND-Long) was acquired to serve as calibration for the point-spread function (PSF) and for the relative photometry and astrometry calibrations. A second set of saturated exposures, but without the neutral density filter, was obtained to image the environment of HD 142527 with a high dynamic range. Both sequences were composed of various offset positions on the detector for background subtraction and bad or hot pixels removal. A windowing mode (512 × 514 pixels) was chosen to allow short exposure times (DIT) and favor the temporal sampling using the NaCo cube mode. The parallactic angle variations (Δπ = 44.4 deg) are reported on Table 2, together with the exposure time, the number of frames per cube (NDIT), the number of cubes (Nexp), and the observing conditions. The star HD 181296 (A0, K = 5.01 mag), which was used as reference for classical PSF-subtraction, was observed with the same observing strategy during the same night.
Observing Log of HD 142527 in L′-band with and without the neutral density (ND), as well as for the reference star HD 181296.
2.2. Data processing
All images were reduced using the pipeline developed for ADI observations at the Institut de Planétologie et d’Astrophysique de Grenoble (see Lagrange et al. 2010; Bonnefoy et al. 2011; Delorme et al. 2012; Chauvin et al. 2012). All data were homogeneously flat-fielded, sky-subtracted, and bad and hot pixels were also cleaned from the images. The data were then recentered and bad quality images removed from the cubes. The result was a master cube containing all individual cleaned and recentered frames, along with their parallactic angles.
To probe the inner part of the environment of HD 142527, we used different PSF-subtraction strategies either adapted for the detection of faint extended structures or to search for point-like features. These four methods are described below:
-
1.
Spatial filtering combined with simple derotation (referred toas nADI). An azimuthal average of the radial profile is estimatedand subtracted from each image of the master cube, followed by aderotation and mean-stacking. A further step consists in anadditional median filtering (fnADI hereafter).
-
2.
Classical ADI (cADI). The median of all individual reduced images is subtracted from the master cube, followed by a derotation and mean-stacking of individual images.
-
3.
The LOCI algorithm (Lafrenière et al. 2007). The residuals are minimized for each image using linear combinations of all data to derive the PSF contribution at a given location in the image. For LOCI, we considered optimization regions of NA = 300 PSF cores, the radial-to-azimuthal width ratio g = 1, the radial width Δr = 1 and 2 × FWHM, and a separation criteria of 1.0 and 1.5 × FWHM. A slightly revisited version of LOCI was applied with an estimation of the reference that does not take the contribution of the region of interest into account (referred to as mLOCI, see Lagrange et al. 2012b; Milli et al. 2012).
-
4.
Finally, classical PSF-subtraction (e.g., Mawet et al. 2009). The observations were not designed to perform such a reduction afterwards, but we found that HD 181296 was observed in our survey (Rameau et al., in prep.) two hours later with the same parallactic angle conditions. We therefore used it as a reference (see Table 2 for the observing conditions). To optimally subtract the PSF to HD 142527’s mastercube, we first selected science and reference frames with similar parallactic angle variations (covering a total of 26 deg). From each individual science frame, the closest reference one in terms of parallactic angle (within 0.3 deg) was subtracted, after recentering and flux rescaling. This step enables optimizing the subtraction of the telescope+instrument static-speckles. The PSF-subtracted science frames are then derotated and mean-stacked. Different methods were applied to estimate the flux scaling factor between HD 142527 and HD 181296, and the best result was validated by visual check.
These four PSF-subtraction methods allowed us to reach optimal detection performance at all separations, identify biases, and nonphysical structures. Although ADI (as with high-pass filtering) processes are well adapted to point-like detections, they are not for axisymmetric disks with low inclination (in the present case i ≃ 30°), since the disks are heavily self-subtracted (Milli et al., submitted). However, they still enable the detection of nonaxisymmetric structures and sharp edges in the disk. On the other hand, nADI, low pass filtering, and PSF-reference subtraction reveal large-scale features, both in terms of separation and size. Careful checks have been done with the Airy ring patterns while interpreting the observed structures. The results of these four methods are discussed below in the context of the disk morphology and of the presence of close companions in the environment of HD 142527.
3. The circumstellar disk around HD 142527
3.1. Disk morphology
Our results on the disk morphology of HD 142527 are mainly based on the classical PSF-reference subtraction method, more adapted to the conservation of faint axisymmetric structures with low inclination. The complexity of this method is the determination of the flux scaling factor to avoid the creation of artifacts. After various tests, we ended up deciding that there is not optimal and unique scaling factor for all radii, and even a radial scaling factor was not convincing because of the asymmetric and highly contrasted structures leading to oversubtracted regions. Unresolved diffuse material seems to contribute strongly to the PSF-flux observed at L′, in addition to the observed structures farther away (see details below).
 |
Fig. 1 HD 142527 L′ image with a 4.2′′ × 4.2′′ field of view reduced with the PSF-reference technique and a scaling factor of 2.2. This factor seems to subtract the close-in flux better without an oversubtraction of the most external parts. North is up, east to the left; flux scale is linear. |
 |
Fig. 2 HD 142527 L′ images with a 4.2′′ × 4.2′′ field of view. North is up, east to the left. Left: fnADI using a high-pass filtering. Middle: cADI. Right: mLOCI using a mask to exclude the disk. The linear flux scale is different for each panel to reveal all structures. |
Nonetheless, it is evident from all images to probe fine highly contrasted structures. Figures 1 and 2 show the images of HD 142527 reduced using the classical PSF-reference subtraction and fnADI, cADI, mLOCI procedures within a reduced FoV of 4.2′′ × 4.2′′. However, the photometry of the features remains sensitive to the choice of the scaling factor. The images reveal new complex, nonaxisymmetrical structures in addition to those previously reported (F06; Fujiwara et al. 2006; Ohashi 2008). We discuss the main features below.
-
Spiral arms. One of the main resultsfrom F06 reveals two ellipticalfacing arcs in the east-west directions and a displacement of thestar with respect to the center of a fitted ellipse on the disk. Our datado not confirm this architecture but rather suggest spiral shapes.The fnADI image (Fig. 2, left) remains the mostadapted seeing the following features. From PA = 170 ± 4 deg to PA = 264 ± 2 deg, the arm goes closer to the central star, from 1.17 ± 0.04′′ to 0.95 ± 0.02′′, with a higher bending at 226 deg. A remarkable feature appears at PA = 265 ± 1 deg: the spiral arm shifts closer to the star of 0.11 ± 0.02′′. This represents a strong rupture to the axisymmetric structure suggested by F06. When going north, the arm moves away (up to 0.91 ± 0.03′′). We estimate an arm width of about 0.43′′ for PA = 227 deg after PSF-reference subtraction with sf = 2.2 (without data binning). Considering the east part of the disk (see Fig. 2, right), the separation increases from northwest (0.87 ± 0.03′′) to southeast (1.11 ± 0.05′′). This spiral arm is not homogenous, showing peaks and dips. This inhomogeneity is highlighted by revealing blobs with fnADI, cADI and LOCI. We also estimate the arm width for PA = 47 deg of about 0.38′′. Slighlty farther out of the main western spiral arm, we detect at least two spiral arms that are borne out at (1.1 ± 0.1′′, PA = 242 ± 3 deg) and (1,01 ± 0.04′′, PA = 261 ± 3 deg) and move away while going north. These spirals show up very well in cADI and mLOCI reduced images, up to the 9σ confidence level within the LOCI ones. However, the intensity is not uniform along these arms and their width are narrower than the ones in the PSF-reference images. These effects of ADI processing are detailed in Milli et al. (submitted). Farther out from the star, we confirm there is a spiral arm between (≃1.71′′, ≃243 deg), and (≃1.88′′, ≃302 deg), as observed in K and H-band in F06. As mentioned in previous papers at shorter wavelengths, we confirm that this arm is fainter with increasing wavelength.
-
The brightness asymmetry between the west and east directions. It clearly comes out from all images that the western side of the disk is brighter than the eastern one. This observation confirms the previous one by F06. At the same separation, the western arm is brighter than the easter one up to ≃ 2 mag/arcsec2 (see for instance the SBD profile in Fig. 3, bottom).
-
The prominent cavity. We confirm a cavity already observed by F06. It is redetected with an outer edge at 0.87 ± 0.06′′, i.e. ≃ 126 AU at 145 pc, along PA = 227 deg. F06 presents the cavity as elliptical and later simulations took this geometry into account. However, it is clear that the outer edge of the cavity differs from an ellipse. In particular, it is much more pronounced into the southwest and extends farther up to 145 AU when going south, as a consequence of the spiral shape described earlier. Considering the eastern part, the edge is located at 0.73 ± 0.02′′, PA = 64 deg, i.e. ≃ 106 AU.
-
Two azimuthal dips. We confirm the presence of two big dips, detected in the north (PA ∈ [351 ± 2;9 ± 5] deg) and southeast (PA ∈ [148 ± 6;164 ± 2] deg). The presence of point-like sources in these two dips is discussed below (Sect. 4.2).
3.2. Surface-brightness distribution
We extracted the surface-brightness distribution (SBD) of the HD 142527’s disk, using the classical PSF-subtracted image. We derived the radial profile to evaluate the extension, the slopes of the outer disk and the amplitude of features observed in the images towards several PA in 1 pixel-wide annulus. The resulting SBD toward the largest extension of the disk (i.e. PA = 47 and 227 deg) are shown in Fig. 3. The slope was measured between 0.87′′ and 1.3′′ for PA = 47 deg and between 1.2′′ and 1.8′′ for PA = 227 deg. We found that the SBD follows a simple power law with a slope of ≃ −4.6. Since the mass of gas in the disk is poorly constrained (Ohashi 2008) if the circumstellar disk around HD 142527 is gas-free disk, such an outer distribution would indicate the dust dynamics dominated by radiation pressure effects (e.g., Thébault & Wu 2008).
 |
Fig. 3 Observed radial surface-brightness distribution on HD 142527 L′ PSF-reference subtracted image with a scaling factor of 2.2 towards the extended part of the disk (47−227 deg). Dashed lines correspond to fitted straight line between 0.9′′ and 1.3′′ for PA = 47 deg and between 1.2′′ and 1.8′′ for PA = 227 deg. |
To investigate the brightness asymmetry between the west and east side of the disk, we used the GraTeR code (Augereau et al. 1999) to simulate, as a geometric approach since the tool is valid only for optically thin regime, the disk as a ring following a radial volumic distribution of grains: ((r/r0) − 2αin + (r/r0) − 2αout)-0.5. We chose r0 = 145 AU, αout = −αin = −3.71, the disk height scale ξ = 1 AU at r0, a Gaussian vertical profile with γ = 2, a linear disk flaring with β = 1, and an inclination of i = 30 deg. The disk width thus obtained is 0.48′′, which is larger than the one measured for PA = 227 deg, but 0.36′′ if we assume i = 45 deg. We simulated the disk with different scattering properties, from g = 0 (isotropic) to g = 0.5. An anisotropy with g = 0.25 could explain the flux ratio of 2 with i = 30 deg and also g = 0.15 with i = 45 deg. However, such a configuration could not explain the geometry asymmetry by itself. It might be created either by an offset of the disk center or by an asymmetry between the forward scattering branch and the backward scattering one.
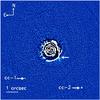 |
Fig. 4 fnADI with median filtering image of HD 142527 with a 11′′ × 11′′ FoV. The arrows indicate candidate companions; cc-1 and cc-2 are confirmed as background sources, whereas the third one is likely an ADI artefact created by the disk. The negative parts (black) close to the disk result from the azimuthal averaging. |
3.3. Role of a close-in binary companion?
Biller et al. (2012) have recently detected a close-in, low-mass star companion candidate, using the NaCo/Sparse Aperture Mode (Tuthill et al. 2010). This candidate has a predicted mass of 0.1−0.4 M⊙ for a physical projected separation of 88 ± 5 mas (≃13 AU). This candidate should lie at ≃3.3 pixels with a contrast of 5.2 mag with the primary in our NaCo ADI/L′-band images. However, we did not detect any point source or sighting of this companion owing to very small inner working angle hence numerous residual speckles. If confirmed with a second-epoch observation, the companion could be responsible for the nonaxisymmetric features of the circumstellar disk around HD 142527. Indeed, the secular perturbations from a central binary are known to create transient, outward propagating spiral structures in a circumbinary disk (see for instance the numerical investigations of Artymowicz & Lubow 1994; Bate 2000; de Val-Borro et al. 2011). The extent, evolution, and longevity of these spiral structures depend on several parameters, such as the binary mass ratio and orbital eccentricity, but also the spatial structure and density of the gas component of the disk. Detailed study of their evolution in the specific case of HD 142527 requires advanced numerical modeling that clearly exceeds the scope of the present paper, so it is left to future investigations.
Relative astrometry and photometry of the point-sources detected around HD 142527.
4. Additional companions around HD 142527
4.1. Detected point-like sources
We looked for point-like sources in a complete FoV of 19′′ × 19′′, obtained after considering all fields observed during the dithering pattern. We confirm there are two faint point sources (the companion candidates cc-1 and cc-2, see Fig. 4), already detected by F06. Combining the Subaru/CIAO dataset from 2006 and our NaCo observations, we confirm the background nature of these two sources. Their relative astrometry and photometry derived at each epoch are reported in Table 3.
At closer separations within 2′′, various point-like structures are detected in the cADI and LOCI images (see Fig. 1). Owing to the low inclination of the disk, the ADI processing may create artifacts, either extended (holes) or point-like ones (in the case of abrupt changes in the shape of extended structures). The bright signal located at 1.3′′ and PA = 227.5 deg) is for example, created by the elbow’s shape of the southwestern part of the disk. Consequently, we did not detect any unambiguous companion candidates within 2′′.
 |
Fig. 5 2D contrast in L′ at 5σ for point-like sources from LOCI reduction around HD 142527. |
4.2. Detection limits
To compute the ADI detection performance with LOCI and cADI, the flux loss of the ADI processing was estimated by injecting fake planets of given separation and contrast in a cube with empty frames (and in the data master cube for LOCI). The full pipeline was run. By comparing the injected fluxes to the recovered ones, we could derive the flux losses as a function of the separation. The second step was to estimate the noise in the residual maps using a sliding box of 9 × 9 pixels. The 5σ detection limits were then derived by correcting the noise from the flux loss and applying a normalization using the unsaturated PSF. We visually checked and confirmed the detection limits by inserting fake planets with several expected contrasts at several separations. The 2D-contrast map obtained with LOCI is shown in Fig. 5. We are sensitive to point-like sources with a contrast of ΔL′ = 10.5 mag at 700 mas (Δproj = 101 AU) and 12.5 mag at 1500 mas (similar performance was obtained with cADI). They correspond to planetary masses of 6.5 MJup and 2.5 MJup at 101 and 218 AU, respectively, using the predictions of the COND03 evolutionary models (Baraffe et al. 2003) for an age of 5 Myr. We also explored the performance towards the northern most prominent dip of the disk and in the southern direction within the large southern cavity. The 1D predicted mass vs projected separation (only one case is shown because similar performance is obtained in both directions) towards the south is reported in Fig. 6. Considering the large uncertainty on the age of the star, whereas the Herbig status and gas presence are evidence of young age, the explored masses between 2 and 20 Myr are plotted in the figure. We did not detect any planets more massive than 5 MJup in the northern disk’s dip and 4 MJup in the sourthern cavity. Careful consideration is required since the detection limits might be overestimated close to the edges of the disk and to the spiral arms due to the disk impact in ADI processes (see Milli et al. 2012).
 |
Fig. 6 Detection limits expressed in Jupiter mass towards the south direction with cADI (similar performance as LOCI). The aqua zone displays the explored masses between 2 and 20 Myr since the age of the star is not well established. The position of the disk as been added towards the same PA. |
4.3. Detection probabilities
To set constraints on the physical characteristics of unseen giant planets or brown dwarfs that could be responsible for several disk structures, we used the Multi-purpose Exoplanet Simulation System (the MESS code Bonavita et al. 2012). This analysis, initiated by Kasper et al. (2007), has been done extensively up to now, especially to constrain the giant planet population at wide orbits. We first assumed a population of planets coplanar with the disk by fixing the inclination to 30 deg. The code creates a planet population using a uniform (mass and semi-major axis) grid. We explored a parameter space of semi-major axis ranging between 1 and 500 AU and of masses between 1 and 20 MJup, resulting in a final grid of 100 × 100 points. For each point, the code has generated Ngen = 10 000 orbits and computed the projected position of the planet at the time of the observation. Using the 2D-contrast maps converted in terms of masses (using the COND model’s predictions, Baraffe et al. 2003) and projected physical separations, the code finally checked the detectability of each simulated planet and determined their detection probability given their masses and semi-major axis (see Fig. 7). Our NaCo observations set constraints for planetary-mass objects down to semi-major axis a ≥ 40 AU and did not completely explore the large cavity between the outer spiral structures of HD 142527 and the inner disk located at less than 30 AU. The detection probabilities unambiguously exclude the presence of massive planets with M ≥ 9 MJup and M ≥ 5 MJup for a semi-major axis of a ≥ 130 AU and 200 AU, respectively. To test the impact of inclination in our simulations, we ran simulations for i ∈ [10,50] deg, considering that a third component will not be necessarly coplanar if the binary companion detected by Biller et al. (2012) is confirmed. The detection probabilities have not changed our previous results significantly.
 |
Fig. 7 Detection probability map of a faint companion around HD 142527 as a function of mass and semi-major axis. The constraint of i = 30 deg has been set to orbital properties of the generated planets. This was calculated using the LOCI 2D detection limits within a 4.2′′ × 4.2′′ FoV. |
5. Summary and concluding remarks
Our observations using VLT/NaCo adaptive optics thermal and angular differential imaging reveal the disk surrounding HD 142527 at an unprecedented spatial resolution down to the subarcsecond level. The disk shows a vast and asymmetric cavity between 30 AU and 145 AU, as well as two important dips towards the north and southeast. We also resolved a bright and inhomogeneous spiral arm towards the west direction, several fainter spiral arms, and structured features rather than two elliptical facing arcs as proposed in previous studies. The observations in angular differential imaging allowed us to derive unprecedented detection performance of point-sources down to planetary mass at 40 AU from the star. Monte-Carlo simulations, combined with our detection map, set stringent constraints whether there are substellar companions orbiting HD 142527. We exclude any presence of brown dwarfs and massive giant planets in the outer part of the cavity and any presence of giant planets down to 5 MJup farther out.
The observed structures indicate that the disk is in an active phase of global evolution. We have already discussed the possibility that the binary companion candidate might be highly responsible for the creation of these features. However, other processes can be invoked, such as one or more unseen planets in formation in the disk.
Gravitational instability is known to create global spiral modes and, in some cases, fragmentation. However, given that the gas mass, as well as the surface density, had been poorly constrained so far, it is not possible to know if the conditions are favorable for gravitational instability. Type II migration of a high-mass planet can also be a mechanism able to produce such structures (e.g., Armitage & Rice 2005) in a gaseous disk. Thus, once again, constraints on the gas properties will allow the type II migration to be or not.
While this article was under review Casassus et al. (2012) reported Gemini/NICI Ks and L′ observations of the outer part of the HD 142527 circumstellar environment. Given similar performance of NICI and NaCo, it gives us the opportunity to validate the observed features and excluded them as instrumental or analysis artifacts. They confirm the presence of several structures: the spiral arms, the asymmetric inner cavity, the two north and south southeast dips, and the inhomogeneity of the east side. However, we do not confirm in our images that there is what they called a knot along the northwest arm. In their images, we also clearly see the offset of the main arm that we reported towards the west, even if they did not mentioned this peculiar morphology. Furthermore, they investigated a 10 MJ protoplanet at 90 AU through hydrodynamic simulations to reproduce the morphology of the inner cavity and of the outer disk. Given our detection performance, such a companion would have likely been detected thus ruling out the input parameters of this carving planet. They argue for additional ingredients within the simulations to reproduce all structures which one single planet cannot explain. Nevertheless, their approach is very interesting and could be improved by taking our detection limits into account to set planet characteristics and the inner binary candidate companion within FARGO simulations.
From the present data, it is fairly difficult to identify the cause of the nonaxisymmetric cavity and spiral arms owing to the lack of knowledge of the gas properties. However, we consider that they may be due to at least one bound-embedded object. More observations and important numerical investigations will be necessary to further test the origin of the highly structured disk of HD 142527.
The distribution slopes have been chosen to match the SBD slopes measured on the data.
Acknowledgments
This research made use of the SIMBAD database and the VizieR service. operated at the CDS, Strasbourg, France. We would like to thank M. Bonavita for providing the MESS code to perform MC simulations. JR also thanks the ESO staff for conducting the observations. We also acknowledge financial support from the French National Research Agency (ANR) through project grant ANR10-BLANC0504-01.
References
- Acke, B., & van den Ancker, M. E. 2004, A&A, 426, 151 [NASA ADS] [CrossRef] [EDP Sciences] [Google Scholar]
- Andrews, S. M., Wilner, D. J., Espaillat, C., et al. 2011, ApJ, 732, 42 [NASA ADS] [CrossRef] [Google Scholar]
- Armitage, P. J., & Rice, W. K. M. 2005 [arXiv:astro-ph/0507492] [Google Scholar]
- Artymowicz, P., & Lubow, S. H. 1994, ApJ, 421, 651 [NASA ADS] [CrossRef] [Google Scholar]
- Augereau, J. C., Lagrange, A. M., Mouillet, D., Papaloizou, J. C. B., & Grorod, P. A. 1999, A&A, 348, 557 [NASA ADS] [Google Scholar]
- Baraffe, I., Chabrier, G., Barman, T. S., Allard, F., & Hauschildt, P. H. 2003, A&A, 402, 701 [NASA ADS] [CrossRef] [EDP Sciences] [Google Scholar]
- Bate, M. R. 2000, MNRAS, 314, 33 [NASA ADS] [CrossRef] [Google Scholar]
- Biller, B., Lacour, S., Juhász, A., et al. 2012, ApJ, 753, L38 [NASA ADS] [CrossRef] [Google Scholar]
- Boley, A. C. 2009, ApJ, 695, L53 [NASA ADS] [CrossRef] [Google Scholar]
- Bonavita, M., Chauvin, G., Desidera, S., et al. 2012, A&A, 537, A67 [NASA ADS] [CrossRef] [EDP Sciences] [Google Scholar]
- Bonnefoy, M., Lagrange, A.-M., Boccaletti, A., et al. 2011, A&A, 528, L15 [NASA ADS] [CrossRef] [EDP Sciences] [Google Scholar]
- Cameron, A. G. W. 1978, Moon and Planets, 18, 5 [NASA ADS] [CrossRef] [EDP Sciences] [Google Scholar]
- Casassus, S., Perez, M. S., Jordán, A., et al. 2012, ApJ, 754, L31 [NASA ADS] [CrossRef] [Google Scholar]
- Chauvin, G., Lagrange, A.-M., Zuckerman, B., et al. 2005, A&A, 438, L29 [NASA ADS] [CrossRef] [EDP Sciences] [Google Scholar]
- Chauvin, G., Lagrange, A.-M., Beust, H., et al. 2012, A&A, 542, A41 [NASA ADS] [CrossRef] [EDP Sciences] [Google Scholar]
- Chiang, E., Kite, E., Kalas, P., Graham, J. R., & Clampin, M. 2009, ApJ, 693, 734 [Google Scholar]
- Crida, A., Masset, F., & Morbidelli, A. 2009, ApJ, 705, L148 [NASA ADS] [CrossRef] [Google Scholar]
- de Val-Borro, M., Gahm, G. F., Stempels, H. C., & Pepliński, A. 2011, MNRAS, 413, 2679 [NASA ADS] [CrossRef] [Google Scholar]
- de Zeeuw, P. T., Hoogerwerf, R., de Bruijne, J. H. J., Brown, A. G. A., & Blaauw, A. 1999, AJ, 117, 354 [NASA ADS] [CrossRef] [Google Scholar]
- Delorme, P., Lagrange, A. M., Chauvin, G., et al. 2012, A&A, 539, A72 [NASA ADS] [CrossRef] [EDP Sciences] [Google Scholar]
- Dodson-Robinson, S. E., Veras, D., Ford, E. B., & Beichman, C. A. 2009, ApJ, 707, 79 [NASA ADS] [CrossRef] [Google Scholar]
- Dominik, C., Dullemond, C. P., Waters, L. B. F. M., & Walch, S. 2003, A&A, 398, 607 [NASA ADS] [CrossRef] [EDP Sciences] [Google Scholar]
- Fujiwara, H., Honda, M., Kataza, H., et al. 2006, ApJ, 644, L133 [NASA ADS] [CrossRef] [Google Scholar]
- Fukagawa, M., Hayashi, M., Tamura, M., et al. 2004, ApJ, 605, L53 [NASA ADS] [CrossRef] [Google Scholar]
- Fukagawa, M., Tamura, M., Itoh, Y., et al. 2006, ApJ, 636, L153 [NASA ADS] [CrossRef] [Google Scholar]
- Honda, M., Inoue, A. K., Fukagawa, M., et al. 2009, ApJ, 690, L110 [Google Scholar]
- Houk, N. 1978, Michigan catalogue of two-dimensional spectral types for the HD stars [Google Scholar]
- Huélamo, N., Lacour, S., Tuthill, P., et al. 2011, A&A, 528, L7 [NASA ADS] [CrossRef] [EDP Sciences] [Google Scholar]
- Kalas, P., Graham, J. R., Chiang, E., et al. 2008, Science, 322, 1345 [NASA ADS] [CrossRef] [PubMed] [Google Scholar]
- Kasper, M., Apai, D., Janson, M., & Brandner, W. 2007, A&A, 472, 321 [NASA ADS] [CrossRef] [EDP Sciences] [Google Scholar]
- Lafrenière, D., Marois, C., Doyon, R., Nadeau, D., & Artigau, É. 2007, ApJ, 660, 770 [NASA ADS] [CrossRef] [Google Scholar]
- Lafrenière, D., Jayawardhana, R., & van Kerkwijk, M. H. 2008, ApJ, 689, L153 [NASA ADS] [CrossRef] [Google Scholar]
- Lagrange, A.-M., Bonnefoy, M., Chauvin, G., et al. 2010, Science, 329, 57 [NASA ADS] [CrossRef] [PubMed] [Google Scholar]
- Lagrange, A.-M., De Bondt, K., Meunier, N., et al. 2012a, A&A, 542, A18 [NASA ADS] [CrossRef] [EDP Sciences] [Google Scholar]
- Lagrange, A.-M., Milli, J., Boccaletti, A., et al. 2012b, A&A, in press, DOI: 10.1051/0004-6361/201219187 [Google Scholar]
- Lenzen, R., Hartung, M., Brandner, W., et al. 2003, SPIE, 4841, 944 [Google Scholar]
- Marois, C., Lafrenière, D., Doyon, R., Macintosh, B., & Nadeau, D. 2006, ApJ, 641, 556 [Google Scholar]
- Marois, C., Macintosh, B., Barman, T., et al. 2008, Science, 322, 1348 [NASA ADS] [CrossRef] [PubMed] [Google Scholar]
- Marois, C., Zuckerman, B., Konopacky, Q. M., Macintosh, B., & Barman, T. 2010, Nature, 468, 1080 [NASA ADS] [CrossRef] [PubMed] [Google Scholar]
- Mawet, D., Serabyn, E., Stapelfeldt, K., & Crepp, J. 2009, ApJ, 702, L47 [NASA ADS] [CrossRef] [Google Scholar]
- Mayor, M., & Queloz, D. 1995, Nature, 378, 355 [NASA ADS] [CrossRef] [Google Scholar]
- Mayor, M., Marmier, M., Lovis, C., et al. 2011, A&A, submitted [arXiv:1109.2497] [Google Scholar]
- Milli, J., Mouillet, D., Lagrange, A. M., et al. 2012, A&A, 545, A111 [NASA ADS] [CrossRef] [EDP Sciences] [Google Scholar]
- Mordasini, C., Alibert, Y., Benz, W., Klahr, H., & Henning, T. 2012, A&A, 541, A97 [NASA ADS] [CrossRef] [EDP Sciences] [Google Scholar]
- Muto, T., Grady, C. A., Hashimoto, J., et al. 2012, ApJ, 748, L22 [NASA ADS] [CrossRef] [Google Scholar]
- Ohashi, N. 2008, Ap&SS, 313, 101 [NASA ADS] [CrossRef] [Google Scholar]
- Palla, F., & Stahler, S. W. 1999, ApJ, 525, 772 [NASA ADS] [CrossRef] [Google Scholar]
- Papaloizou, J. C. B., Nelson, R. P., Kley, W., Masset, F. S., & Artymowicz, P. 2007, Protostars and Planets V, 655 [Google Scholar]
- Pecaut, M., & Mamajek, E. 2010, in BAAS 42, AAS Meeting Abstracts, 215, 455.30 [Google Scholar]
- Pollack, J. B., Hubickyj, O., Bodenheimer, P., et al. 1996, Icarus, 124, 62 [NASA ADS] [CrossRef] [Google Scholar]
- Rousset, G., Lacombe, F., Puget, P., et al. 2003, SPIE, 4839, 140 [Google Scholar]
- Siess, L., Dufour, E., & Forestini, M. 2000, A&A, 358, 593 [NASA ADS] [Google Scholar]
- Thébault, P., & Wu, Y. 2008, A&A, 481, 713 [NASA ADS] [CrossRef] [EDP Sciences] [Google Scholar]
- Tuthill, P., Lacour, S., Amico, P., et al. 2010, SPIE, 7735, 266 [Google Scholar]
- Udry, S., & Santos, N. C. 2007, ARA&A, 45, 397 [NASA ADS] [CrossRef] [Google Scholar]
- van Boekel, R., Min, M., Leinert, C., et al. 2004, Nature, 432, 479 [NASA ADS] [CrossRef] [PubMed] [Google Scholar]
- van Leeuwen, F. 2007, A&A, 474, 653 [NASA ADS] [CrossRef] [EDP Sciences] [Google Scholar]
- Verhoeff, A. P., Min, M., Pantin, E., et al. 2011, A&A, 528, A91 [NASA ADS] [CrossRef] [EDP Sciences] [Google Scholar]
- Waelkens, C., Waters, L. B. F. M., de Graauw, M. S., et al. 1996, A&A, 315, L245 [NASA ADS] [Google Scholar]
All Tables
Observing Log of HD 142527 in L′-band with and without the neutral density (ND), as well as for the reference star HD 181296.
Relative astrometry and photometry of the point-sources detected around HD 142527.
All Figures
|
Fig. 1 HD 142527 L′ image with a 4.2′′ × 4.2′′ field of view reduced with the PSF-reference technique and a scaling factor of 2.2. This factor seems to subtract the close-in flux better without an oversubtraction of the most external parts. North is up, east to the left; flux scale is linear. |
| In the text | |
|
Fig. 2 HD 142527 L′ images with a 4.2′′ × 4.2′′ field of view. North is up, east to the left. Left: fnADI using a high-pass filtering. Middle: cADI. Right: mLOCI using a mask to exclude the disk. The linear flux scale is different for each panel to reveal all structures. |
| In the text | |
|
Fig. 3 Observed radial surface-brightness distribution on HD 142527 L′ PSF-reference subtracted image with a scaling factor of 2.2 towards the extended part of the disk (47−227 deg). Dashed lines correspond to fitted straight line between 0.9′′ and 1.3′′ for PA = 47 deg and between 1.2′′ and 1.8′′ for PA = 227 deg. |
| In the text | |
|
Fig. 4 fnADI with median filtering image of HD 142527 with a 11′′ × 11′′ FoV. The arrows indicate candidate companions; cc-1 and cc-2 are confirmed as background sources, whereas the third one is likely an ADI artefact created by the disk. The negative parts (black) close to the disk result from the azimuthal averaging. |
| In the text | |
|
Fig. 5 2D contrast in L′ at 5σ for point-like sources from LOCI reduction around HD 142527. |
| In the text | |
|
Fig. 6 Detection limits expressed in Jupiter mass towards the south direction with cADI (similar performance as LOCI). The aqua zone displays the explored masses between 2 and 20 Myr since the age of the star is not well established. The position of the disk as been added towards the same PA. |
| In the text | |
|
Fig. 7 Detection probability map of a faint companion around HD 142527 as a function of mass and semi-major axis. The constraint of i = 30 deg has been set to orbital properties of the generated planets. This was calculated using the LOCI 2D detection limits within a 4.2′′ × 4.2′′ FoV. |
| In the text | |
Current usage metrics show cumulative count of Article Views (full-text article views including HTML views, PDF and ePub downloads, according to the available data) and Abstracts Views on Vision4Press platform.
Data correspond to usage on the plateform after 2015. The current usage metrics is available 48-96 hours after online publication and is updated daily on week days.
Initial download of the metrics may take a while.