| Issue |
A&A
Volume 544, August 2012
|
|
|---|---|---|
| Article Number | A7 | |
| Number of page(s) | 12 | |
| Section | Interstellar and circumstellar matter | |
| DOI | https://doi.org/10.1051/0004-6361/201219086 | |
| Published online | 19 July 2012 | |
Exploring the supernova remnant G308.4–1.4
Max Planck Institute for extraterrestrial Physics, PO Box 1312, Giessenbachstr., 85741 Garching, Germany
e-mail: This email address is being protected from spambots. You need JavaScript enabled to view it.
Received: 21 February 2012
Accepted: 22 May 2012
Abstract
Aims. We present a detailed X-ray and radio wavelength study of G308.4–1.4, a candidate supernova remnant (SNR) in the ROSAT All Sky Survey and the MOST supernova remnant catalog to identify it as a SNR.
Methods. The SNR candidate and its central sources were studied using observations from the Chandra X-ray Observatory, Swift, the Australian Telescope Compact Array (ATCA) at 1.4 and 2.5 GHz and WISE infrared observation at 24 μm.
Results. We conclude that G308.4–1.4 is indeed a supernova remnant because its morphology matches at X-ray, radio- and infrared wavelengths, its spectral energy distribution in the X-ray band, and its emission characteristics in the radio band. G308.4–1.4 is a shell-type SNR. X-ray, radio- and infrared emission is seen only in the eastern part of the remnant. The X-ray emission can best be described by an absorbed non-equilibrium collisional plasma with a hydrogen density of nH = (1.02 ± 0.04) × 1022 cm-2, a plasma temperature of 6.3-0.7+1.2 million Kelvin, and an under-abundance of iron, neon and magnesium, as well as an overabundance in sulfur with respect to the solar values. The SNR has a spectral index in the radio band of α = −0.7 ± 0.2. A detailed analysis revealed that the remnant is at a distance of 6 to 12 kpc and the progenitor star exploded ~ 5000 to 7500 years ago. Two faint X-ray point sources located near to the remnant’s geometrical center are detected. Both sources have no counterpart at other wavelengths, leaving them as candidates for the compact remnant of the supernova explosion.
Key words: ISM: supernova remnants / ISM: individual objects: G308.4 / 1.4 / stars: neutron
© ESO, 2012
1. Introduction
Supernovae (SNe), the core-collapse of massive stars or the thermonuclear disruption of white dwarfs, are rare events, occurring on average every 50 years in the Galaxy (Keane & Kramer 2008). However, only seven Galactic SNe have been observed with historical records in the past two thousand years – SN 185 (RCW 86), SN 386 (G11.2–0.3), SN 1006, SN 1181 (3C 58), Crab SN, Tycho SN, and the Kepler SN. Several other records of guest stars by ancient Chinese astronomers exists. However, no solid identification with a known supernova remnant (SNR) has been possible for most of them so far (Green & Stephenson 2003). Most Galactic SNe go unobserved owing to visible-band extinction by interstellar dust. For example, SN Cas A may belong to this group. No widespread reports of Cas A exist in the literature of the 17th century (cf. Hartmann et al. 1997). A more recent example is the youngest supernova known in our Galaxy, G1.9+0.3, which was totally missed by optical observatories about 100 years ago (Reynolds et al. 2008). The majority of supernova remnants that have been identified so far were found in radio surveys in which the observations are unhampered by interstellar dust (Green 2009, and references therein). Nevertheless, the radio band is not free of selection effects. Supernova remnants with a diameter of < 3′ are difficult to identify. Only three of the 274 remnants listed in the Green catalog fall into this category. In addition, most searches for SNRs focus on the Galactic plane, leaving remnants located at a higher galactic attitude underrepresented. Only five supernova remnants with | b | > 7° are listed in Green’s catalog. Hence, small remnants at high attitude are easily missed in radio surveys.
Most SNRs emit thermal radiation when the SN blast wave expands into the surrounding interstellar medium (ISM), forms a shock wave at the shock front, which then ionizes the atoms, and increases the temperature to 106 − 107 K. Therefore, the successful completion of the ROSAT All-Sky Survey (RASS) in the X-ray regime provided a new window for finding SNRs and the compact objects that may reside within them. The seven X-ray detected and radio-quiet central compact objects that were associated with SNRs (see Gotthelf & Halpern 2008, for a review) are a good example for the impact on pulsar and SN science of X-ray observatories. Additionally, X-ray observations of SNRs at moderate spectral resolution can determine remnant properties such as shock velocities, post-shock gas densities and temperature as well as swept-up shell mass and overall morphology.
The ROSAT All-Sky survey has demonstrated the potential power for finding new SNRs (Pfeffermann & Aschenbach 1996; Busser et al. 1996; Asaoka & Aschenbach 1994; Asaoka et al. 1996; Egger et al. 1996; Folgheraiter et al. 1996). This has motivated Busser (1998) and Schaudel et al. (2002) to investigate the all-sky survey data more systematically to search for unidentified supernova remnants. They analyzed RASS data in a systematic search for extended (≥5′) X-ray sources at Galactic latitudes (b ≤ ± 15°) by correlating them with databases such as SIMBAD, NED, NVSS, SUMSS, DSSII, NRAO, ATNF, Parkes, and the Effelsberg radio survey data. From their candidate list several sources have meanwhile been confirmed as SNR (e.g., Jackson et al. 2008; Robbins et al. 2012; Roberts & Brogan 2008; Stupar et al. 2007; Tian et al. 2010). These identifications suggest that many of their SNR candidates are indeed radio-under-luminous, explaining why past radio surveys could not detect or identify them before.
In Schaudel (2003) nine sources are listed that appear to be very promising SNR candidates. One of them is G308.4–1.4 designated with G308.3–1.4 in Schaudel et al. (2002) and Schaudel (2003). Since the RASS had only an average exposure time of ~400 s for sources in the Galactic plane the available ROSAT data do not support a detailed spectral and spatial analysis of these sources. However, G308.4–1.4 appears in the RASS data as a spherical center-filled X-ray source, whereas in the Sydney University Molonglo Sky Survey (SUMSS) two radio arcs have been detected that partly overlap with the RASS data (see Fig. 1). Moreover, G308.4–1.4 is listed in the MOST supernovae remnant catalog as a possible SNR candidate (Whiteoak & Green 1996).
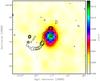 |
Fig. 1 ROSAT RASS 30′ × 30′ image of G308.4–1.4 (0.1–2.4 keV) overlaid with the SUMSS image at 843 MHz (contour lines at 4, 8, 12, 16, and 25 mJy). The half-power beam-width of the telescope is 43′′. The RASS image is binned with 0.75′ per pixel and smoothed by a Gaussian kernel of σ ≈ 2′. |
In this paper we report on the identification of G308.4–1.4 as an SNR using archival data from the Chandra, Swift, ATCA, and WISE observatories. The results of the spatial and spectral analysis of the X-ray and radio data are presented in Sects. 2 and 3, respectively. In Sect. 4 we report on data of G308.4–1.4 in other wavelength regimes. A concluding discussion about the identification of G308.4–1.4 and its central sources is given in Sect. 5. Furthermore, in the same section we use the inferred spectral parameters of the SNR to derive an estimate for the age, the radius, the expansion velocity and the distance to the remnant. Section 6 provides a summary.
2. X-ray observations and data analysis
The SNR candidate G308.4–1.4 was observed with the Advanced CCD Imaging Spectrometer (ACIS-I) on board the Chandra X-ray observatory on 26 and 27 June 2010 (obs. ID. 11249) for ≈ 15.1 ks. All data were uncontaminated by soft proton flares. After dead-time correction 14.9 ks of good data remained. Standard processed data were used with up-to-date calibration applied. The data were reduced with the Chandra Interactive Analysis software CIAO, version 4.3. For the spectral fitting we used the X-Ray Spectral Fitting Package (XSPEC) developed by NASA, version 12.7.0.
In addition to Chandra, we used the Swift observatory to analyze X-ray point sources detected in the central region of the remnant. G308.4–1.4 was observed three times with the Swift X-ray Telescope (XRT) on 17 June 2011 (obs. ID 00032030001), 7 (obs. ID 00032030002) and 11 August 2011 (obs. ID 00032030003) for 3.5 ks, 4.2 ks and 1.3 ks, respectively. These data were reduced with the HEASOFT software package, version 6.11. For the spatial and spectral analysis we used the high-resolution Chandra data because they contain five times more counts of G308.4–1.4.
To calculate the error in the X-ray flux we used a publicly available XSPEC tool1. For the spectral analysis of the extended source emission we restricted the energy range to 0.5–4.0 keV because the count rate detected at higher energies is too sparse for a meaningful spectral analysis. Below 0.5 keV the detector and telescope response is not well established. In all other cases the energy range was restricted to 0.1–5 keV. All errors in this publication represent the 1σ confidence range for one parameter of interest, unless stated otherwise.
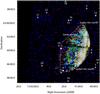 |
Fig. 2 Chandra ACIS-I color image of G308.4–1.4 (red 0.1–1.0 keV, green 1–1.5 keV and blue 1.5–5 keV). The images are binned with 1′′ per pixel and smoothed by a Gaussian kernel of σ = 3′′. 20 point sources were detected in the 12′ × 12′ area around the center of G308.4–1.4 (cf. Table 1). |
2.1. Spatial analysis
Inspecting Fig. 2, the X-ray image of G308.4–1.4 shows strong emission in the eastern part. This region has a circular shape with a diameter of ~8.4′. The radiation is fading toward the geometrical center of the source. The coordinate of the circle center is RAc = 13h41m23.9s ± 0.7s, Decc = −63°43′08′′ ± 04′′, which was obtained by fitting an annulus to the outer skirts of the extended emission.
Detected sources in a 12′ × 12′ box around G308.4–1.4.
Searching for point sources in a 12′ × 12′ box around G308.4–1.4 using a wavelet source detection algorithm (CIAO-tool wavdetect) yielded a list of 21 sources. Their position, positional error and signal-to-noise ratio are listed in Table 1. The sources themselves are marked in Fig. 2. Cross-correlating the sources with the help of the VizieR online tool2 we found seven matches. They are included with their positional error in Table 1.
Eight of the detected sources are located within the extended emission of G308.4–1.4 and two of them (#1 and #10) are within ≈ 1 arcmin of the geometrical center of the SNR candidate. Source 1 is the brightest among all detected point sources and its designation is CXOU J134124.22–634352.0. Its position is coincident with 2MASS J13412422–6343520. In the optical source catalogs this source has no information about its proper motion. Hence we cannot put better constraints on the positional coincidence of source #1 and the 2MASS object. Source 10 has no optical counterpart and is designated with CXOU J134127.12–634327.7.
2.2. Spectral analysis of G308.4–1.4
To extract the spectra of the SNR candidate we first removed all point-like sources and then selected all photons in a circular sector with a radius of 4.2′ and opening angle of ≈136° (see Fig. 2). The background spectrum was derived from all photons in an annular sector with the same opening angle as the circular one but with the radii 5.5′ and 7.2′. After subtracting the background contribution (0.054 cts/pix) 11 752 counts for the spectral analysis of the whole remnant-candidate remained. Additionally, the emission region of G308.4–1.4 was divided into four separate regions, which are illustrated in Fig. 2. The net counts are 4095 for the inner sector and 7658 for the outer shell, and 4499 for the northern part of the outer shell and 3158 for the southern part. The spectrum of every single region was binned with at least 50 counts per bin. Only the spectra of the southern and northern parts of the outer rim were binned with at least 75 counts per bin.
To fit the X-ray spectrum of G308.4–1.4 we tried various one- and two-component spectral models. However, only a model of an absorbed collisional plasma that is in non-equilibrium and allows a temperature evolution (Borkowski et al. 2001) reproduces the energy distribution of the extended source. In XSPEC this model is implemented as VGNEI. To improve the goodness of the fit and to obtain the abundance of metals in the plasma, we thawed the parameter of every single metal and monitored the improvement of the fit statistic.
The analysis results in a best-fit model with a reduced χ2 of 1.03 for 95 degrees of freedom (d.o.f.) and a hydrogen column density nH = 1.02 ± 0.04 × 1022 cm-2. The value for nH is lower than the integrated hydrogen column density toward G308.4–1.4, which is 1.31 × 1022 cm-2 (Kalberla et al. 2005) and 1.45 × 1022 cm-2 (Dickey & Lockman 1990). These values are based on HI emission line measurements at 21 cm and therefore refer to the entire hydrogen column density in the line of sight. The temperature of the plasma is found to be  million Kelvin. The best fit was obtained when thawing the abundance in neon, magnesium, sulfur and iron, which differ significantly from the solar values: Ne = (0.72 ± 0.14) Ne⊙,
  ,
,  , and
, and  Fe⊙. The ionization timescale τ0 = t0Ne (t0 is the remnant’s age and Ne the post-shock electron number density) is 2.7 × 10¹⁰ s/cm3 and the ionization timescale-averaged temperature
  keV (ts is the age of the shock). Thus, the unabsorbed flux of G308.4–1.4 in the energy band 0.5 − 4.0 keV is
  erg cm-2 s-1. The model fit and the raw spectrum are shown in Fig. 3. The fitted parameters are listed in Table 2.
Spectral parameters of the best-fit model for different parts of SNR G308.4–1.4.
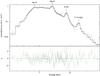 |
Fig. 3 Spectrum and fitted model of the X-ray emission of the whole remnant. |
Adding a second plasma component that is in non-equilibrium results in  for 91 d.o.f. and hence is no improvement over a single component model. The other models that we fitted to the spectral distribution are a hot diffuse gas model (VMEKAL,
  for 96 d.o.f.), a model for a collisionally ionized diffuse gas (VAPEC,
  for 96 d.o.f.) and a thermal bremsstrahlung model (
 for 101 d.o.f.). None of these models can reproduce the spectrum of G308.4–1.4. However, all three model fits result in nH ≈ 1 × 1022 cm-2 and a plasma temperature of ~0.5 keV.
2.2.1. The inner sector and the outer rim
As mentioned in Sect. 2.2, the extended source was divided into four regions. This was done to investigate the spatial variation of the hot plasma. To extract the background spectra of the inner sector and the outer rim we used the same area on the detector as for the whole remnant. The northern and southern region of the outer rim were analyzed separately. For the background we used only the part of this annular sector that has the same opening angle as the source region.
First we fitted the plasma model with free nH. In every one of the four spectral fits we found a hydrogen column density that agrees well with the nH of the whole remnant. Second, we fitted the spectra with an nH fixed to the value of the whole remnant. The fitted value for nH and the results of the fits with a fixed column density are summarized in Table 2. The spectra with the respective fits are shown in Fig. 4.
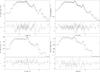 |
Fig. 4 Spectrum and fitted model of the X-ray emission of the various regions. Upper left: inner part of the remnant, upper right: outer rim, lower left: outer rim north and lower right: outer rim south. |
Within the statistical uncertainties, all regions turned out to have a similar temperature. Only the ionization timescale-averaged temperature was varying. The large statistical uncertainty also prevents us from concluding on a temperature evolution with the distance to the expected center of the remnant. No variation of the neon and magnesium abundance over the surface of the remnant is detectable. The only noticeable change in abundance is in sulfur and iron in the outer rim. The spectrum in the northern rim shows an abundance in iron comparable with the solar value. In the southern rim no significant deviation from the solar value was found in the abundance of sulfur. Furthermore, the ionization timescale varies with distance from the remnant’s center and the direction of the expanding shock wave into the ISM. The highest values for τ were found for the inner sector (8.1 × 10¹⁰ s/cm3) and the lower one in the southern part of the rim (2.0 × 10¹⁰ s/cm3), which implies a different post-shock electron number density in the inner and outer regions of the SNR candidate.
2.3. The central sources
As mentioned above, two point sources were detected close to the presumed center of the remnant, source #1 (CXOU J134124.22–634352.0) and #10 (CXOU J134127.12–634327.7). For the spectral analysis of source #1 we used all photons within a circular region of radius 10 arcsec centered on the source position. The background was extracted from an annulus with radii 15′′ and 20′′. After background correction 195 source counts in the energy band between 0.5 and 10.0 keV remained. We used the CIAO tool psextract to compute the response matrices necessary to compensate for the changing spectral response of the CCD and the telescope with energy and off-axis angle. The spectrum was binned with at least 20 counts per bin.
A single absorbed blackbody or a single absorbed power law model for fitting the spectral distribution gives poor results. In the case of a blackbody spectrum the reduced χ2 = 2.67 for 6 degrees of freedom is inacceptably large. The power law model fit results in a reduced χ2 of 0.94 (6 d.o.f.). However, the post-fit residuals show systematic derivations between the data points and the fitted model. Therefore, we used a two-component absorbed blackbody model that resulted in χ2 = 1.62 (4 d.o.f.) and a  cm-2. To better constrain the spectral parameters we fixed nH to the hydrogen column density obtained from fits to G308.4–1.4. This yielded a reasonable fit with χ2 = 1.96 for 5 d.o.f. (see Fig. 6). The temperatures of the two blackbodies are
  K and
K and  K. The normalization factors of the two blackbodies are
  and K2 = (1.3 ± + 0.4) × 10-6. Using these values and the distance to the source D10 in units of 10 kpc we estimated the emitting source radius R as follows:
 ![Mathematical equation: \begin{equation} \label{equ.Remit_vs_D} R_i=\sqrt{\frac{K_i \times 10^{39}}{4 \pi \sigma_{\rm B} D^2_{10} T^4}}~\mathrm{[m]}, \end{equation}](/articles/aa/full_html/2012/08/aa19086-12/aa19086-12-eq142.png) (1)where σB is the Stefan-Boltzmann constant. Because we do not know the distance to G308.4–1.4 we considered the emitting radius as a function of the distance to the source. This is illustrated in Fig. 5. The result for the second blackbody is
(1)where σB is the Stefan-Boltzmann constant. Because we do not know the distance to G308.4–1.4 we considered the emitting radius as a function of the distance to the source. This is illustrated in Fig. 5. The result for the second blackbody is  m. The unabsorbed flux in the energy band 0.5 to 10 keV is
  erg cm-2 s-1 and in the energy band 0.3 to 3.5 fX = (4 ± 2) × 10-12 erg cm-2 s-1.
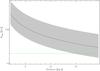 |
Fig. 5 Dependence of the blackbody-emitting radius R1 of the first blackbody in the double blackbody spectral fit on the distance to source #1 in kpc (Eq. (1)). The error range is gray shaded and the green line indicates the upper limit on the radius of a neutron star. |
Additionally, we tried a model composed of a blackbody and a power law with the same fixed nH as before. This gives a reasonable fit with χ2 = 2.17 (5 d.o.f.). The photon index is  and the blackbody temperature is (1.3 ± 0.3) × 106 K. With the normalization of
  the emitting radius is
  km. The unabsorbed flux in the energy band 0.5 to 10 keV is
  erg cm-2 s-1.
Spectral fit results of the central source #1.
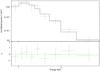 |
Fig. 6 Spectrum of source #1 fitted with a double blackbody spectrum. |
As mentioned in Sect. 2.1, the position of source #1 is consistent with 2MASS J13412422–6343520, a star with a magnitude of B = 19.7, R = 19.6, J = 14.0, H = 13.3 and K = 13.1. This implies an X-ray-to-visual flux ratio of log (fX/fV) = log (fX) + V/2.5 + 5.37 = 1.55 (Maccacaro et al. 1988). Here fX is the X-ray flux in the 0.3 − 3.5 keV band in erg cm-2 s-1, V is the visual magnitude; we assumed that V ≈ R.
In addition we tried to fit various plasma models to the source spectrum. The only reasonable fit was found when using a collisionally ionized diffuse gas model (APEC). The goodness of fit that we found for 6 d.o.f. was  for the following spectral parameters: nH < 0.47 × 1022 cm-2,
  K. For this model the flux in the 0.3 to 3.5 keV range is
  erg cm-2 s-1. Thus, the X-ray-to-visual flux ratio is log (fX/fV) = 0.25. Again no variation in the spectral parameters between the flaring and quiescence epoch are detectable. All fitted models and their inferred spectral parameters are listed in Table 3.
2.3.1. Temporal analysis of source #1
To search for any temporal variability we binned the photon time of arrivals with 400 s per bin (see Fig. 7). The data clearly show a flare in the first kilo-seconds of the observation. The spectral parameter of the double blackbody in the flaring and quiescence epoch match the overall spectrum within the error bars. Varying only the normalizations of the two blackbodies, the flux in the quiescence epoch is with  ± 0.3) × 10-12 erg cm-2 s-1 slightly lower than the flux in the total exposure. However, the flux in the time interval when the source was flaring is
  erg cm-2 s-1, three times the quiescence flux. However, the sparse photon statistics lead to large uncertainties in the derived errors of the quiescence and flaring fluxes and thus they are only rough estimates. Merging the Swift observations we cannot detect a source at the position of source # 1. In the merged image a total of four counts were recorded within a circle with radius 15 arcsec (equals an encircled energy of 70%) centered on the position of source # 1. The total exposure time of the source was 8344 s. Hence, the 3σ upper limit for the counting rate is approximately 8.6 × 10⁻⁴ cts/s. Using the mission count rate simulator for X-ray observatories WebPIMMS3 with the Swift response and the spectral parameters derived for a double blackbody spectrum, the upper limit on the flux is ≈ 5.3 × 10⁻¹³ erg cm-2 s-1. For the APEC model the upper limit is ≈ 2.3 × 10⁻¹⁴ erg cm-2 s-1. These limits are less than 25% of the average flux in the Chandra observation, clearly indicating that the source flux is variable on time scales of at least several hours to weeks.
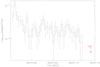 |
Fig. 7 Flux variation of source #1 in the Chandra observation binned with 400 s per bin and scaled with the mean flux in the whole exposure. The red arrow indicates the 3σ upper limit derived with the Swift observations. |
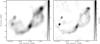 |
Fig. 8 Gray-scale image of SNR G308.4–1.4. The left image displays the SNR at 1.4 GHz and on the right the same region at 2.5 GHz. The 1.4 GHz image is smoothed with a beam of 63.6′′ × 53.2′′ and the 2.5 GHz with a beam of 35.2′′ × 29.3′′. |
2.3.2. Extent of source #1
With the help of a one-dimensional distribution of the counts per 0.5′′ bin along a vertical line in the Chandra image around source #1 we checked if the source is extended. The resulting diagram was obtained by integrating all counts within 5′′ × 0.5′′ rectangular apertures moving along the western direction with 0.5′′ steps. We compared this with the count distribution of a point source simulated with MARX4. However, no excess emission of point source #1 could be detected.
For source #10, the other source located close to the center of the remnant, we detected only eight net counts. Hence, the count rate is (5.1 ± 1.9) × 10-4 cts/s, but no spectral analysis is possible because of the limited statistics.
3. Radio observation and data analysis
The source G308.4–1.4 was observed for 11.25 h with the Australia Telescope Compact Array, a synthesis telescope near Narrabri, New South Wales on 11 January 2002 at 1.432 and 2.448 GHz with 13 channels per band. The single-pointing continuum observations of the source G308.4–1.4 were carried out with the array configuration 0.75C (maximum baseline length is 750 m). All four Stokes parameters have been recorded.
The flux density calibration was performed through observations of PKS B1934–638, which is the standard primary calibrator for ATCA observations. Phases were calibrated using observations of secondary calibrating sources PKS 1329–665. Since the primary beam response is frequency-dependent, we did not merge the data from two observing bands before imaging and cleaning. Every single observing run and each of the two observing bands were calibrated separately following the standard procedures for ATCA observations.
The reduction was carried out using the ATNF release of the Multichannel Image Reconstruction, Image Analysis and Display (MIRIAD, Sault et al. 1995). A number of steps in the reduction process (i.e. “flagging”) were performed interactively.
Because of the poor phase stability during the observation, the scalar averaging of gains over the interval of 5 min (the length of secondary calibrator scan) was performed. Then, a total-intensity continuum image square region was formed using multi-frequency synthesis, uniform weighting and a cell size of 10 arcsec. At the stage of the dirty map production all correlations with 6th baseline were excluded to obtain images with better signal-to-noise ratio. The next step was to de-convolved both images using the standard CLEAN algorithm (Clark 1980) with 10 000 iterations. The resulting images were restored and corrected for the mean primary beam response of the ATCA antennas. The final images have synthesized beam sizes of 63.6′′ × 53.2′′ and 35.2′′ × 29.3′′ for the 1.384 GHz and 2.496 GHz band, respectively.
In both frequency bands the images show two radio arcs (see Fig. 8). The eastern arc matches the X-ray emission region. For the western arc no counterpart is visible in the X-ray regime. There are also two radio-bright knots within the arcs that have neither a counterpart in X-rays (see Fig. 9) nor in the optical band (dss2red). No difference can be seen to the morphology of the extended source in the SUMSS 843 MHz map.
The flux densities of G308.4–1.4 without the two bright knots are 235, 174, and 110 mJy at 843, 1384, and 2496 MHz, respectively. These values were obtained by integrating the emission within multiple polygons enclosing the remnant. The 843 MHz flux density was deduced from the SUMSS image. The bright southern knot has a flux density of 110, 75, and 70 mJy at 843, 1384, and 2496 MHz, whereas for the northern knot we measured a flux density of 96, 76, and 56 mJy at 843, 1384, and 2496 MHz. In all cases we assumed a conservative error of 20% in the flux density.
The rms noise levels are 0.28 mJy beam-1 and 0.05 mJy beam-1 for the 1.384 GHz and 2.496 GHz image. The levels were measured by integrating over nearby source-free regions. The spectral indices were computed using the total flux density measurements in all available frequencies (0.843, 1.384, and 2.496 GHz). Fitting the data with a power law Sν ∝ να, we obtained a spectral index for the northern knot α = −0.50 ± 0.14 and for the southern knot α = −0.49 ± 0.16, respectively. The radio emission of the two arcs, however, have a spectral index α = −0.7 ± 0.2. No significant polarized radio emission could be detected.
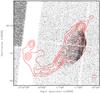 |
Fig. 9 Chandra 15′ × 15′ image of G308.4–1.4 overlaid with the ATCA data at 1.4 GHz. The contour levels are 4, 8, 12, 16, and 24 mJy beam-1. The radio image has a full width at half maximum (FWHM) of 63.6′′ × 53.2′′ and the X-ray image is binned with 1′′ per pixel. |
4. Observations in other wavelength regimes
The region around G308.4–1.4 was observed in the four infrared bands 3, 5, 12, and 22 μm during the Wide-field Infrared Survey (WISE, Wright et al. 2010). With the 22 μm filter an extended infrared emission is detectable that overlaps with the radio and X-ray emission regions (see Fig. 10). After subtracting the background contribution the intensity image in the 22 μm band was converted into a flux image using the explanatory supplement to the WISE All-Sky Data Release Products5. We did not apply color correction because the emission mechanism in the infrared regime is uncertain. In addition, the integrated flux was not corrected for extinction. To compare the infrared with the 1.4 GHz image the flux density in the 22 μm observation was scaled to Jy/beam, where the beam is 63.6 × 53.2 arcsec2. Using the region of infrared emission that is clearly associated with the remnant, the integrated flux of G308.4–1.4 in the 22 μm band is ≈ 1.7 Jy.
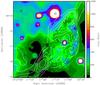 |
Fig. 10 10′ × 10′ WISE image around G308.4–1.4 at 22 micron with the radio contour lines in white at 3, 8, 12, 16, and 24 mJy and the X-ray contours in black. |
The shock wave of an SN that is running into the interstellar medium can interact with adjacent molecular clouds and produce γ-rays via decays of π0 (Abdo et al. 2011). We therefore checked the archive of the Fermi Large-Area Telescope for a γ-ray source at the position of G308.4–1.4. The Fermi γ-ray satellite monitors the sky continuously since August 2008. However, no source has been detected close to G308.4–1.4 in the Fermi-LAT Second Source Catalog (Nolan et al. 2012) and investigating the images ourselves we found no γ-ray emission matching the X-ray morphology.
5. Discussion and conclusion
Comparing the fitted nH with the integrated hydrogen column density toward the source of Kalberla et al. (2005) and Dickey & Lockman (1990) places G308.4–1.4 within our Galaxy.
The plasma model we used to fit the energy spectrum of G308.4–1.4 was especially designed to improve the modeling of X-ray spectra of SNR. Other plasma models assume ionization equilibrium and are therefore not able to reproduce the spectra of young SNRs that are not evolved enough to reach ionization equilibrium (Borkowski et al. 2001). Furthermore, the temperature of the plasma of approximately 6 million Kelvin is in the typical range for SNRs (McKee 1987).
The analysis of the archival ATCA radio data revealed non-thermal emission with a spectral index of ≈−0.7, which is typical for young to middle-aged SNRs (Dickel 1991). The spectral index has a large error due to the noise in the 2.5 GHz observation but still agrees with the expected value of 0.4 to 0.5 for middle-aged SNR.
Infrared radiation from SNRs is expected to come either from thermal emission of dust grains in the hot plasma that are heated through collision, or from the forbidden lines of elements such as neon, oxygen, and iron (Seok et al. 2008). Several authors were able to show that by comparing the infrared and radio emission it is possible to distinguish between SNRs and HII-regions (Fürst et al. 1987; Broadbent et al. 1989; Pinheiro Gonçalves et al. 2011). Moreover, in the work by Pinheiro Gonçalves et al. (2011) the ratio between the flux density in the MIPSGAL 24-μm (Carey et al. 2009) and the 1.4-GHz band was used. These authors found that the ratio is ≤ 10 for SNR and higher than 30 for HII-regions. For SNR G308.4–1.4 the 22 μm band was observed, which covers roughly the wavelength range from 20 μm to 27 μm. Thus, the band is comparable with the MIPSGAL 24 μm band, which is sensitive for infrared emission in the range from 20 μm to 30 μm (Pinheiro Gonçalves et al. 2011). The 22-μm to 1.4-GHz ratio for G308.4–1.4 is ≈ 10. Hence, the infrared emission matching the radio and X-ray morphology and the measured 22-μm to 1.4-GHz ratio additionally supports that G308.4–1.4 is an SNR.
The lack of γ-ray emission from G308.4–1.4 can be explained by the poor spatial resolution of the Fermi-LAT telescope (~1° at 1 GeV), which makes it hard to distinguish faint extended sources from the diffuse emission of the Galactic plane. Of the 274 known SNRs only seven have been detected by Fermi-LAT so far (Nolan et al. 2012).
There are various physical scenarios to show what might cause a plasma to emit X-rays. However, the two emission models for hot diffuse (MEKAL, Mewe et al. 1986) and collisionally ionized diffuse gas (APEC, Smith et al. 2001), which are often used to describe the X-ray emission of Galaxy Clusters (ClGs), cannot reproduce the spectrum of G308.4–1.4. Moreover, the temperature of ClGs is normally several 107 K (Böhringer & Werner 2010), one order of magnitude higher than the fitted value. Thus, we can conclude that G308.4–1.4 is not a ClG. In addition, we can exclude that G308.4–1.4 is a planetary nebula (PN) because the X-ray flux of G308.4–1.4 is three orders of magnitude higher than the flux of the brightest PN detected in X-rays, which is at a distance of ≈ 1 kpc (Guerrero et al. 2006) and because of the low 22-μm to 1.4-GHz flux ratio. Furthermore, the temperature of G308.4–1.4 is a factor of two higher than the highest measured temperature of the hotter, type 2 PNe (Guerrero et al. 2000).
Based on these results we conclude that G308.4–1.4 is indeed a supernova remnant. Only the eastern part of the remnant can be seen in the radio-, infrared- and X-ray regime, which is is not unusual for SNR (e.g., Castro et al. 2011). A reason for that could be that its shock wave is expanding in more dense ISM in the east or the emission in the western part is absorbed by ISM that is in front of the SNR. Figure 10 shows an extended and infrared-bright region in the northwestern part of the SNR, whose emission is not correlated with the SNR.
Using the inferred spectral parameters we can estimate fundamental characteristics of the remnant, such as the distance from Earth and its age.
5.1. Distance
To derive a rough estimate for the distance to SNR G308.4–1.4 we used a method described by various authors (Sun et al. 1999; Safi-Harb et al. 2001; Gonzalez & Safi-Harb 2003): from the distribution of mean color excess ⟨EB − V⟩ per kiloparsec derived by Lucke (1978) we found ⟨EB − V⟩ = (0.3 ± 0.1) mag kpc-1. Using the fitted hydrogen column density for the whole remnant nH = (1.02 ± 0.04) × 1022 cm-2, the relation between the hydrogen column density nH and the visual extinction AV of Predehl & Schmitt (1995)nH = (1.79 ± 0.03) × 1021 cm-2 AV and adopting the relation between AV and the color excess AV/ ⟨EB − V⟩ = (3.2 ± 0.2) (Zombeck 2007), the distance to G308.4–1.4 is d = 5.9 ± 2.0 kpc. We note that this distance is a lower boundary of the real distance. This is because the mean color excess ⟨EB − V⟩ we used was derived for reddening layer up to 2 kpc. For distance estimates for Galactic PNe the reddening inferred distances are mostly significantly shorter than distances derived with other methods (Phillips 2006). This leads us to assume that d ≈ 6 kpc is the lower boundary limit for the distance to SNR G308.4–1.4.
Another approach to determine the distance to G308.4–1.4 uses the fact that the radius of the remnant Rs can be determined in two ways, where Rs depends on the distance d with different exponents. The first equation is a result of the Sedov analysis discussed in the next section (Eq. (4)) and depends on d1/6. The second equation to determine d is simply the comparison of the radius of the remnant in pc (Rs) and in arcmin (θ), d = Rs/θ, which depends linearly on the distance unit d. Using these dependencies we derive ![Mathematical equation: \begin{equation} d=7420 \, (\theta~[\mathrm{arcmin}])^{-3/5}\left(\frac{E_{51}}{T_\mathrm{s}[\mathrm{K}]}\right)^{2/5}\left(\frac{f}{\mathrm{Norm}} \right)^{1/5}=9.8^{+0.9}_{-0.7}~\mathrm{kpc}, \end{equation}](/articles/aa/full_html/2012/08/aa19086-12/aa19086-12-eq260.png) (2)where Ts is the post-shock temperature and E51 the SN explosion released kinetic energy in units of 1051 erg.
(2)where Ts is the post-shock temperature and E51 the SN explosion released kinetic energy in units of 1051 erg.
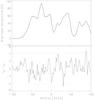 |
Fig. 11 Top: HI spectrum on- and off-source (continuous and dotted line, respectively) in the direction of SNR G308.4–1.4. Bottom: difference profile with the 3σ level indicated by a dotted vertical line. |
Furthermore, with the help of the ATCA radio observations and the publicly available HI data from the Southern Galactic Plane Survey (SGPS; McClure-Griffiths et al. 2005), it is possible to constrain the distance using the Galactic rotation model of Fich et al. (1989). For the region around G308.4–1.4 the SGPS archive provides ATCA data observed with a beam size of 130′′ × 130′′ and a 1σ sensitivity of ~1.6 K. However, the data cover only the northern part of the remnant. The SGPS archive also holds Parkes data that cover the region around the SNR, but with an angular resolution of 15′. This beam is twice the size of the remnant’s diameter. Therefore, we chose to use the ATCA data for the subsequent analysis.
First, we convolved the radio continuum image at 1.4 GHz to the same beam size as the SGPS data. We assumed that the emission of the remnant does not vary significantly across the emission region. Second, the convolved image was used to generate an on-source spectrum of SNR G308.4–1.4 by averaging the HI emission for every velocity bin in the HI data cube at which the radio continuum emission was higher than 5 mJy. The off-source spectrum was computed by taking the average of the emission in the surrounding of the on-source region of the remnant. These two profiles and the difference plot between these two profiles are shown in Fig. 11. The difference profile is dominated by drifts in the zero level. This is because the source is at the border of the image and as we are using public data, the pointing is not perfect for the method applied. In addition to the drifts, we detect one absorption feature with a significance of > 3σ at Vr ~ 30 km s-1. With the standard IAU parameter for the distance to the center of the Galaxy R0 = 8.5 kpc and the solar orbit velocity of V0 = 220 km s-1 derived by Kerr & Lynden-Bell (1986) and the already mentioned Galactic rotation model we deduce a distance to G308.4–1.4 of 2.0 ± 0.6 kpc and 12.5 ± 0.7 kpc. For the error estimate we assumed an uncertainty in the velocity-to-distance conversion of 7 km s-1 as suggested by various authors (e.g., Clifton et al. 1988) and used the FWHM of the feature as the uncertainty in the velocity determination. Based on the calculated lower limit for the distance of the remnant we can rule out the lower value as unreasonable. The low significance of the absorption feature leads to the conclusion that the Sedov-analysis-based distance approximation is the more reliable estimate for the distance to SNR G308.4–1.4. Thus, in the following all important quantities are given in units of d9.8 = d/9.8 kpc. Using the flux values deduced for G308.4–1.4 we compute its X-ray luminosity to be 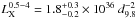 erg/s.
5.2. Age of SNR G308.4–1.4
First we deduced the post-shock hydrogen density NH. Using the normalization constant derived in the model fit of a collisional plasma that is in non-equilibrium (VGNEI) and assuming that the hydrogen and electron densities are constant over the volume V of the emission region, we derived the following relation:  cm-6. V can be approximated by a sphere with radius
  of which only a fraction of ~
  is sufficiently bright to be detected in the X-ray regime. Therefore, the volume is
 ![Mathematical equation: \hbox{$V=1.14\times 10^{54}~(r[\mathrm{arcmin}])^3 d^3_{\rm kpc}~\mathrm{cm}^3=7.98\times 10^{58} d^3_{9.8}~\mathrm{cm}^3$}](/articles/aa/full_html/2012/08/aa19086-12/aa19086-12-eq279.png) . Here dkpc is the distance to G308.4–1.4 in kpc. For a fully ionized plasma with cosmic abundances ( ≈ 10% He) the ratio between hydrogen and electron density can be estimated by NH/Ne ≈ 0.8. Thus, the post-shock hydrogen density
. Here dkpc is the distance to G308.4–1.4 in kpc. For a fully ionized plasma with cosmic abundances ( ≈ 10% He) the ratio between hydrogen and electron density can be estimated by NH/Ne ≈ 0.8. Thus, the post-shock hydrogen density  cm-3 and the corresponding swept-up mass
  (Slane et al. 2002).
The age of the remnant can be approximated by (McKee 1987) 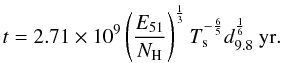 (3)Assuming that the explosion energy is equal to the canonical value of 1051 ergs and the fitted temperature is approximately Ts, the derived value for the hydrogen density suggests an age of ≈ 5000–7500 years for SNR G308.4–1.4. Using this result we can calculate the theoretical radius of the remnant (Culhane 1977)
 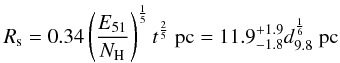 (4)and the shock velocity (Sedov 1959)
 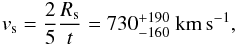 (5)which is independent of the assumed distance. The age for the transition from the Sedov-phase into the radiative phase is about 29 kyr (Blondin et al. 1998). The fact that G308.4–1.4 is much younger than the transition time scale suggests that G308.4–1.4 is in the Sedov-phase. Furthermore, the energy spectrum of the remnant supports that G308.4–1.4 is in the Sedov-phase.
However, the derived parameters should only be seen as rough estimates because we were unable to determine whether a full temperature equilibrium is already established. If this is not the case, a generally higher ion temperature, which determines the SNR dynamics, would lead to a higher shock velocity and subsequently to, e.g., an overestimation of the remnant’s age.
5.3. The central sources CXOU J134124.22–634352.0 and CXOU J134127.12–634327.7
No radio counterpart for CXOU J134124.22–634352.0 has been detected in the ATCA and SUMSS observations of G308.4–1.4. An explanation could be that the variable source is also variable in the radio band and therefore the source was missed in all previous observations of this region. To decide if this is the case new observations are needed.
Additionally, CXOU J134124.22–634352.0 has no compact/extended X-ray emission as seen in other young and powerful pulsars. Its best-fit spectral model consists of two blackbodies. Thus, source #1 shows some properties that have been also seen in central compact objects (CCO, see Gotthelf & Halpern 2008, for a review). These CCOs are young neutron stars that are located in SNRs with an age of less than 10 kyr. They have X-ray luminosities between 1032 and 1033 erg/s in the energy range 0.5–10 keV. No CCO has a detected counterpart in the radio and optical band so far. For one member of the CCO group, 1E 161348–5055 in RCW 103, flares have been detected in which the flux varies between 0.8 and 60 × 10-12 erg cm-2 s-1. This is comparable to source #1 whose maximum flux is ≈ 10-11 erg cm-2 s-1 and the upper limit derived from the Swift observations is ≈ 5 × 10-13 erg cm-2 s-1.
Using the distance derived in Sect. 5.1 the luminosity of CXOU J134124.22–634352.0 is 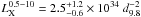 erg/s. This is slightly higher than the derived luminosity for the normal population of CCO (Becker 2009, p. 121), only the flaring CCO in RCW 103 has a comparable luminosity of 0.1 − 8 × 1034 erg/s (de Luca 2008).
Krautter et al. (1999) found for all X-ray-bright stars with an optical counterpart a ratio of log (fX/fV) = −2.46 ± 1.27 in the ROSAT All-Sky Survey. Therefore, the X-ray-to-visual flux ratio of 1.55 and the fitted nH, which is on the order of what has been observed for G308.4–1.4, suggest a CCO interpretation for source # 1.
Assuming that the source is indeed the compact remnant, we can derive the proper motion of the object  using the inferred center and the age of the SNR. We deduce the proper motion to be μ = 7 ± 2 mas/yr = 320 ± 100 km s-1. The upper limit on μ is higher than the mean two-dimensional proper motion of pulsars in SNRs of ~227 km s-1 (Hobbs et al. 2005), but would not be an exception. For example, the CCO RX J0822-4300 in the SNR Puppis A has a 2d proper motion of 672 ± 115 km s-1 (Becker et al. 2012).
Nevertheless, the lower limit of the inferred emitting radius of the blackbody in the double blackbody or the power law-blackbody spectral fit is on the order of the expected value for the neutron star radius of 10 to 20 km only if the source is at a distance larger than 14.5 kpc (see Fig. 5). Moreover, we found an infrared and optical source whose position is consistent with source #1. The spectral distribution of the source allows us to fit a collisionally ionized diffuse gas model (APEC), which Osten et al. (2005) used to model the energy distribution in the X-ray band of the M dwarf flare star EV Lacertae. In addition, the fitted hydrogen column density is consistent with that of a nearby star and the X-ray-to-visual flux ratio is 0.25, only 2σ higher than the value for stars derived by Krautter et al. (1999).
Using the stellar density in the direction of G308.4–1.4 we can derive the chance association of the observed 2MASS source with the compact remnant candidate. The chance association is given by  , where N is the number of sources detected within a rectangular region of length lRA and width lDec, and δRA, δDec are the errors in the position of the source. The 2MASS catalog contains 2206 point-like sources in a box with side length of 5 arcmin around the center of the remnant and the chance association is 1.3%. Thus, the possibility of a false association between the X-ray and the 2MASS source cannot be excluded.
Until now, we did not discuss the western radio arc, which has no counterpart in the X-ray and infrared image. The arc could be interpreted as a relativistic radio jet of a source at the geometrical center of the SNR. If that is the case, the central source is either a black hole of stellar mass or a neutron star in a binary system (Mirabel & Rodríguez 1999, and reference therein). Especially the possibility that the central source is a black hole is an interesting speculation which, if proven, would mean that G308.4–1.4 is the remnant of a type II core-collapse SN. Thus, would be the first one known that left a black hole.
To obtain a rough estimate of the source flux of the other source in the center of the remnant, source #10, we assumed that the source is a CCO, should have at least a spectrum with a blackbody of temperature 2.6 million Kelvin as the CCO in Puppis-A (cf. Table 6.4, Becker 2009). Using the WebPIMMS tool with the source count rate and the fitted nH of the SNR the flux in the 0.3 − 3.5 keV range is fX ≈ 2.2 × 10⁻¹⁴ erg cm-2 s-1 and in the 0.5 − 10 keV range is fX ≈ 1.9 × 10⁻¹⁴ erg cm-2 s-1. The normalization of a blackbody with this flux, temperature and nH is 2.5 × 10⁻⁵, which corresponds to an emitting radius of the source of ≈  km. This value perfectly agrees with the expected value for the neutron star radius. The corresponding luminosity in the energy band 0.5 − 10 keV is
 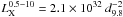 erg/s, a typical value for CCOs. Furthermore, the X-ray-to-visual flux ratio is log (fX/fV) > 0.11 taking into account that no optical source was detected in the USNO-B1.0 catalog and the limiting magnitude of this catalog is 21 (Monet et al. 2003). Thus, no clear evidence for the origin of the emission of source #10 could be found.
Finally we mention that the detector support structure of Chandra covers the central part of G308.4–1.4 (see Fig. 2). It is therefore not excluded from our observations that other faint X-ray point sources are located at this position. However, the non-detection of a source in the Swift data at the assumed position of the remnant’s expansion center sets a strict upper limit of 5 × 10-13 erg cm-2 s-1 on the flux of such an object.
6. Summary
The high-resolution imaging and spectroscopic capability of Chandra revealed that the X-ray emission of the source is an extended plasma and G308.4–1.4 is indeed a supernova remnant. The emission region is spherically symmetric with a diameter of 8.4 arcmin and an excess emission toward the east.
The radio morphology at 0.843, 1.384 and 2.496 GHz is characterized by two arcs. The eastern arc matches the X-ray and infrared contours. The second arc, which is bending in the west and shows a decreasing brightness toward the center of G308.4–1.4, has no counterpart in other wavelengths. The remnant without the two bright knots has a spectral index of α = −0.7 ± 0.2
The Sedov analysis lead to the conclusion that the SNR is about 6200 years old and is expanding with a velocity on the order of ≈ 730 km s-1. All fundamental parameters of the SNR are summarized in Table 4.
The X-ray point-like source CXOU J134124.22–634352.0, located close to the geometrical center of the SNR G308.4–1.4, is seen to exhibit variable and flaring X-ray emission. However, no certain conclusion on the origin of this source and the other central source CXOU J134127.12–634327.7 could be drawn. Deeper observations of the central part of SNR G308.4–1.4 are needed to resolve the obvious ambiguities.
Fundamental parameters of SNR G308.4–1.4.
fluxerror.tcl, see http://heasarc.nasa.gov/xanadu/xspec/fluxerror.html
MARX is a software that can be used to simulate the performance of the Chandra X-ray observatory; see http://space.mit.edu/cxc/marx/
Acknowledgments
T.P. acknowledges support from and participation in the International Max-Planck Research School on Astrophysics at the Ludwig-Maximilians University. The authors acknowledge discussions with M. D. Filipović.
References
- Abdo, A. A., Ackermann, M., Ajello, M., et al. 2011, ApJ, 734, 28 [NASA ADS] [CrossRef] [Google Scholar]
- Asaoka, I., & Aschenbach, B. 1994, A&A, 284, 573 [NASA ADS] [Google Scholar]
- Asaoka, I., Egger, R., & Aschenbach, B. 1996, in Röntgenstrahlung from the Universe, eds. H. U. Zimmermann, J. Trümper, & H. Yorke, 233 [Google Scholar]
- Becker, W. 2009, in Astrophys. Space Sci. Lib. 357, ed. W. Becker, 91 [Google Scholar]
- Becker, W., Prinz, T., Winkler, P. F., & Petre, R. 2012, ApJ, submitted [arXiv:1204.3510v1] [Google Scholar]
- Blondin, J. M., Wright, E. B., Borkowski, K. J., & Reynolds, S. P. 1998, ApJ, 500, 342 [NASA ADS] [CrossRef] [Google Scholar]
- Böhringer, H., & Werner, N. 2010, A&A Rev., 18, 127 [CrossRef] [Google Scholar]
- Borkowski, K. J., Lyerly, W. J., & Reynolds, S. P. 2001, ApJ, 548, 820 [NASA ADS] [CrossRef] [Google Scholar]
- Broadbent, A., Osborne, J. L., & Haslam, C. G. T. 1989, MNRAS, 237, 381 [NASA ADS] [CrossRef] [Google Scholar]
- Busser, J.-U. 1998, Ph.D. Thesis, LMU, Germany [Google Scholar]
- Busser, J.-U., Egger, R., & Aschenbach, B. 1996, in Röntgenstrahlung from the Universe, eds. H. U. Zimmermann, J. Trümper, & H. Yorke, 239 [Google Scholar]
- Carey, S. J., Noriega-Crespo, A., Mizuno, D. R., et al. 2009, PASP, 121, 76 [NASA ADS] [CrossRef] [Google Scholar]
- Castro, D., Slane, P. O., Gaensler, B. M., Hughes, J. P., & Patnaude, D. J. 2011, ApJ, 734, 86 [NASA ADS] [CrossRef] [Google Scholar]
- Clark, B. G. 1980, A&A, 89, 377 [NASA ADS] [Google Scholar]
- Clifton, T. R., Frail, D. A., Kulkarni, S. R., & Weisberg, J. M. 1988, ApJ, 333, 332 [NASA ADS] [CrossRef] [Google Scholar]
- Culhane, J. L. 1977, in Supernovae, ed. D. N. Schramm, Astrophys. Space Sci. Lib., 66, 29 [Google Scholar]
- de Luca, A. 2008, in 40 Years of Pulsars: Millisecond Pulsars, Magnetars and More, eds. C. Bassa, Z. Wang, A. Cumming, & V. M. Kaspi, AIP Conf. Ser., 983, 311 [Google Scholar]
- Dickel, J. 1991, in Supernovae, ed. S. E. Woosley, 675 [Google Scholar]
- Dickey, J. M., & Lockman, F. J. 1990, ARA&A, 28, 215 [NASA ADS] [CrossRef] [MathSciNet] [Google Scholar]
- Egger, R., Greiner, J., & Aschenbach, B. 1996, in Röntgenstrahlung from the Universe, eds. H. U. Zimmermann, J. Trümper, & H. Yorke, 247 [Google Scholar]
- Fich, M., Blitz, L., & Stark, A. A. 1989, ApJ, 342, 272 [NASA ADS] [CrossRef] [Google Scholar]
- Folgheraiter, E. L., Watson, M. G., & Warwick, R. S. 1996, in Röntgenstrahlung from the Universe, eds. H. U. Zimmermann, J. Trümper, & H. Yorke, 253 [Google Scholar]
- Fürst, E., Reich, W., & Sofue, Y. 1987, A&AS, 71, 63 [NASA ADS] [CrossRef] [MathSciNet] [PubMed] [Google Scholar]
- Gonzalez, M., & Safi-Harb, S. 2003, ApJ, 591, L143 [NASA ADS] [CrossRef] [Google Scholar]
- Gotthelf, E. V., & Halpern, J. P. 2008, in 40 Years of Pulsars: Millisecond Pulsars, Magnetars and More, eds. C. Bassa, Z. Wang, A. Cumming, & V. M. Kaspi, AIP Conf. Ser., 983, 320 [Google Scholar]
- Green, D. A. 2009, BASI, 37, 45 [NASA ADS] [Google Scholar]
- Green, D. A., & Stephenson, F. R. 2003, in Supernovae and Gamma-Ray Bursters, ed. K. Weiler, Lect. Notes Phys. (Berlin: Springer Verlag), 598, 7 [Google Scholar]
- Guerrero, M. A., Chu, Y.-H., & Gruendl, R. A. 2000, ApJS, 129, 295 [NASA ADS] [CrossRef] [Google Scholar]
- Guerrero, M. A., Chu, Y.-H., & Gruendl, R. A. 2006, in The X-ray Universe 2005, ed. A. Wilson, ESA SP, 604, 85 [NASA ADS] [Google Scholar]
- Hobbs, G., Lorimer, D. R., Lyne, A. G., & Kramer, M. 2005, MNRAS, 360, 974 [NASA ADS] [CrossRef] [Google Scholar]
- Jackson, M. S., Safi-Harb, S., Kothes, R., & Foster, T. 2008, ApJ, 674, 936 [NASA ADS] [CrossRef] [Google Scholar]
- Kalberla, P. M. W., Burton, W. B., Hartmann, D., et al. 2005, A&A, 440, 775 [NASA ADS] [CrossRef] [EDP Sciences] [Google Scholar]
- Keane, E. F., & Kramer, M. 2008, MNRAS, 391, 2009 [NASA ADS] [CrossRef] [Google Scholar]
- Kerr, F. J., & Lynden-Bell, D. 1986, MNRAS, 221, 1023 [NASA ADS] [CrossRef] [Google Scholar]
- Krautter, J., Zickgraf, F.-J., Appenzeller, I., et al. 1999, A&A, 350, 743 [NASA ADS] [Google Scholar]
- Lucke, P. B. 1978, A&A, 64, 367 [NASA ADS] [Google Scholar]
- Maccacaro, T., Gioia, I. M., Wolter, A., Zamorani, G., & Stocke, J. T. 1988, ApJ, 326, 680 [NASA ADS] [CrossRef] [Google Scholar]
- McClure-Griffiths, N. M., Dickey, J. M., Gaensler, B. M., et al. 2005, ApJS, 158, 178 [NASA ADS] [CrossRef] [Google Scholar]
- McKee, C. F. 1987, in Spectroscopy of Astrophysical Plasmas, eds. A. Dalgarno, & D. Layzer, 226 [Google Scholar]
- Mewe, R., Lemen, J. R., & van den Oord, G. H. J. 1986, A&AS, 65, 511 [NASA ADS] [Google Scholar]
- Mirabel, I. F., & Rodríguez, L. F. 1999, ARA&A, 37, 409 [NASA ADS] [CrossRef] [Google Scholar]
- Monet, D. G., Levine, S. E., Canzian, B., et al. 2003, AJ, 125, 984 [NASA ADS] [CrossRef] [Google Scholar]
- Nolan, P. L., Abdo, A. A., Ackermann, M., et al. 2012, ApJS, 199, 31 [NASA ADS] [CrossRef] [Google Scholar]
- Osten, R. A., Hawley, S. L., Allred, J. C., Johns-Krull, C. M., & Roark, C. 2005, ApJ, 621, 398 [NASA ADS] [CrossRef] [Google Scholar]
- Pfeffermann, E., & Aschenbach, B. 1996, in Röntgenstrahlung from the Universe, eds. H. U. Zimmermann, J. Trümper, & H. Yorke, 267 [Google Scholar]
- Phillips, J. P. 2006, Mex. Astron. Astrofis., 42, 229 [NASA ADS] [Google Scholar]
- Pinheiro Gonçalves, D., Noriega-Crespo, A., Paladini, R., Martin, P. G., & Carey, S. J. 2011, AJ, 142, 47 [NASA ADS] [CrossRef] [Google Scholar]
- Predehl, P., & Schmitt, J. H. M. M. 1995, A&A, 293, 889 [NASA ADS] [Google Scholar]
- Reynolds, S. P., Borkowski, K. J., Green, D. A., et al. 2008, ApJ, 680, L41 [NASA ADS] [CrossRef] [Google Scholar]
- Robbins, W. J., Gaensler, B. M., Murphy, T., Reeves, S., & Green, A. J. 2012, MNRAS, 419, 2623 [NASA ADS] [CrossRef] [Google Scholar]
- Roberts, M. S. E., & Brogan, C. L. 2008, ApJ, 681, 320 [NASA ADS] [CrossRef] [Google Scholar]
- Safi-Harb, S., Harrus, I. M., Petre, R., et al. 2001, ApJ, 561, 308 [NASA ADS] [CrossRef] [Google Scholar]
- Sault, R. J., Teuben, P. J., & Wright, M. C. H. 1995, in Astronomical Data Analysis Software and Systems IV, eds. R. A. Shaw, H. E. Payne, & J. J. E. Hayes, ASP Conf. Ser., 77, 433 [Google Scholar]
- Schaudel, D. 2003, Ph.D. Thesis, LMU, Germany [Google Scholar]
- Schaudel, D., Becker, W., Voges, W., et al. 2002, in Neutron Stars in Supernova Remnants, eds. P. O. Slane, & B. M. Gaensler, ASP Conf. Ser., 271, 391 [Google Scholar]
- Sedov, L. I. 1959, Similarity and Dimensional Methods in Mechanics, ed. L. I. Sedov [Google Scholar]
- Seok, J. Y., Koo, B.-C., Onaka, T., et al. 2008, PASJ, 60, 453 [NASA ADS] [CrossRef] [Google Scholar]
- Slane, P., Chen, Y., Lazendic, J. S., & Hughes, J. P. 2002, ApJ, 580, 904 [NASA ADS] [CrossRef] [Google Scholar]
- Smith, R. K., Brickhouse, N. S., Liedahl, D. A., & Raymond, J. C. 2001, ApJ, 556, L91 [NASA ADS] [CrossRef] [Google Scholar]
- Stupar, M., Parker, Q. A., Filipović, M. D., et al. 2007, MNRAS, 381, 377 [NASA ADS] [CrossRef] [Google Scholar]
- Sun, M., Wang, Z.-R., & Chen, Y. 1999, ApJ, 511, 274 [NASA ADS] [CrossRef] [Google Scholar]
- Tian, W. W., Li, Z., Leahy, D. A., et al. 2010, ApJ, 712, 790 [NASA ADS] [CrossRef] [Google Scholar]
- Whiteoak, J. B. Z., & Green, A. J. 1996, A&AS, 118, 329 [NASA ADS] [CrossRef] [EDP Sciences] [Google Scholar]
- Wright, E. L., Eisenhardt, P. R. M., Mainzer, A. K., et al. 2010, AJ, 140, 1868 [NASA ADS] [CrossRef] [Google Scholar]
- Zombeck, M. 2007, Handbook of Space Astronomy and Astrophysics, third Edition, ed. M. Zombeck (Cambridge University Press) [Google Scholar]
All Tables
All Figures
|
Fig. 1 ROSAT RASS 30′ × 30′ image of G308.4–1.4 (0.1–2.4 keV) overlaid with the SUMSS image at 843 MHz (contour lines at 4, 8, 12, 16, and 25 mJy). The half-power beam-width of the telescope is 43′′. The RASS image is binned with 0.75′ per pixel and smoothed by a Gaussian kernel of σ ≈ 2′. |
| In the text | |
|
Fig. 2 Chandra ACIS-I color image of G308.4–1.4 (red 0.1–1.0 keV, green 1–1.5 keV and blue 1.5–5 keV). The images are binned with 1′′ per pixel and smoothed by a Gaussian kernel of σ = 3′′. 20 point sources were detected in the 12′ × 12′ area around the center of G308.4–1.4 (cf. Table 1). |
| In the text | |
|
Fig. 3 Spectrum and fitted model of the X-ray emission of the whole remnant. |
| In the text | |
|
Fig. 4 Spectrum and fitted model of the X-ray emission of the various regions. Upper left: inner part of the remnant, upper right: outer rim, lower left: outer rim north and lower right: outer rim south. |
| In the text | |
|
Fig. 5 Dependence of the blackbody-emitting radius R1 of the first blackbody in the double blackbody spectral fit on the distance to source #1 in kpc (Eq. (1)). The error range is gray shaded and the green line indicates the upper limit on the radius of a neutron star. |
| In the text | |
|
Fig. 6 Spectrum of source #1 fitted with a double blackbody spectrum. |
| In the text | |
|
Fig. 7 Flux variation of source #1 in the Chandra observation binned with 400 s per bin and scaled with the mean flux in the whole exposure. The red arrow indicates the 3σ upper limit derived with the Swift observations. |
| In the text | |
|
Fig. 8 Gray-scale image of SNR G308.4–1.4. The left image displays the SNR at 1.4 GHz and on the right the same region at 2.5 GHz. The 1.4 GHz image is smoothed with a beam of 63.6′′ × 53.2′′ and the 2.5 GHz with a beam of 35.2′′ × 29.3′′. |
| In the text | |
|
Fig. 9 Chandra 15′ × 15′ image of G308.4–1.4 overlaid with the ATCA data at 1.4 GHz. The contour levels are 4, 8, 12, 16, and 24 mJy beam-1. The radio image has a full width at half maximum (FWHM) of 63.6′′ × 53.2′′ and the X-ray image is binned with 1′′ per pixel. |
| In the text | |
|
Fig. 10 10′ × 10′ WISE image around G308.4–1.4 at 22 micron with the radio contour lines in white at 3, 8, 12, 16, and 24 mJy and the X-ray contours in black. |
| In the text | |
|
Fig. 11 Top: HI spectrum on- and off-source (continuous and dotted line, respectively) in the direction of SNR G308.4–1.4. Bottom: difference profile with the 3σ level indicated by a dotted vertical line. |
| In the text | |
Current usage metrics show cumulative count of Article Views (full-text article views including HTML views, PDF and ePub downloads, according to the available data) and Abstracts Views on Vision4Press platform.
Data correspond to usage on the plateform after 2015. The current usage metrics is available 48-96 hours after online publication and is updated daily on week days.
Initial download of the metrics may take a while.