| Issue |
A&A
Volume 543, July 2012
|
|
|---|---|---|
| Article Number | A84 | |
| Number of page(s) | 11 | |
| Section | Stellar structure and evolution | |
| DOI | https://doi.org/10.1051/0004-6361/201219046 | |
| Published online | 02 July 2012 | |
Coronal activity cycles in nearby G and K stars⋆
XMM-Newton monitoring of 61 Cygni and α Centauri
1 Hamburger Sternwarte, Universität Hamburg, Gojenbergsweg 112, 21029 Hamburg, Germany
2 European Space Agency, 8-10 rue Mario Nikis, 75738 Paris Cedex 15, France
e-mail: jrobrade@hs.uni-hamburg.de
Received: 15 February 2012
Accepted: 10 May 2012
Context. While we have ample evidence of stellar analogues to the solar activity cycle for chromospheric activity, very little is known about stellar coronal cycles and their possible similarities to the solar behavior.
Aims. An ongoing X-ray monitoring program of solar-like stars with XMM-Newton is performed to investigate coronal activity cycles.
Methods. We used X-ray observations of the nearby binaries 61 Cyg A/B (K5V and K7V) and α Cen A/B (G2V and K1V) to study the long-term evolution of magnetic activity in weakly to moderately active G + K dwarfs over nearly a decade. Specifically we searched for X-ray activity cycles and related coronal changes and compared them to the solar behavior.
Results. For 61 Cyg A we find a regular coronal activity cycle analog to its 7.3 yr chromospheric cycle. The X-ray brightness variations are with a factor of three significantly lower than on the Sun, yet the changes of coronal properties resemble the solar behavior, with stronger variations occurring in the respective hotter plasma components. 61 Cyg B does not show a clear cyclic coronal trend so far, but the X-ray data match the more irregular chromospheric cycle. The two α Cen stars exhibit significant long-term X-ray variability. α Cen A shows indications for cyclic variability of an order of magnitude with a period of about 12−15 years; the α Cen B data suggest an X-ray cycle with an amplitude of about six to eight and a period of 8−9 years. The sample stars exhibit X-ray luminosities ranging between LX ≲ 1 × 1026 − 3 × 1027 erg s-1 in the 0.2−2.0 keV band and have coronae dominated by cool plasma with variable average temperatures of around 1.0 − 2.5 MK.
Conclusions. Coronal activity cycles are apparently a common phenomenon in older, slowly rotating G and K stars. The spectral changes of the coronal X-ray emission over the cycles are solar-like in all studied targets.
Key words: stars: activity / stars: coronae / stars: individual: 61 Cygni / stars: solar-type / stars: individual:αCentauri / X-rays: stars
Appendix A is available in electronic form at http://www.aanda.org
© ESO, 2012
1. Introduction
The 11-year activity cycle of the Sun is one of the key characteristics of solar magnetic activity. The most evident feature of the solar cycle, which also has the longest recorded history, is the periodic modulation of the sunspot number. Other activity indicators such as chromospheric Ca ii emission or coronal X-rays follow the sunspot cycle, but magnetic field studies have shown that the true cycle period is actually 22 years due to the polarity reversal of the solar magnetic field. The solar cycle is not exactly periodic and varies in both its amplitude and length; even periods without significant activity such as the 17th century Maunder Minimum have been observed. Solar activity also affects the Earth’s environment and apparently at least local climate conditions through modulations of the magnetosphere, high-energy particle flux, or irradiance.
Studies of multiple activity indicators reveal that the amplitude of cyclic variation strongly depends on the indicator used. X-ray studies of the Sun show a pronounced coronal cycle with about one order of magnitude brightness variations between solar maximum and minimum, e.g. log LX ≈ 26.5...27.5 erg s-1 in the ROSAT 0.1−2.4 keV energy band (Peres et al. 2000). However, for the Sun the calculation of a disk-integrated X-ray flux as it is observed for stars is far from trivial, as can be concluded from the divergent X-ray brightness estimations presented by Judge et al. (2003). While at harder X-ray energies the amplitude of the variations can easily be of the order of hundred as observed by the Yohkoh satellite (Orlando et al. 2001), in the chromospheric Ca ii H+K lines or in transition region lines observed at UV wavelengths these variations are much more scarce, ranging from several tens of percent up to a factor of a few (e.g. Lean 1997).
The solar behavior raises the question if activity cycles also exist on other stars. These studies naturally require long-term monitoring, and the Mt. Wilson program of Ca ii H+K emission was the first to show that chromospheric activity cycles exist on many late-type stars (Baliunas et al. 1995). Indeed, chromospheric activity cycles with periods of Pcyc ≈ 7...15 yr are quite common on slowly rotating and thus weakly to moderately active G0−K5 dwarf stars. A few of the less active stars show flat activity curves and likely reside currently in a Maunder Minimum state, with the G2 star 51 Peg being an example that was also observed in X-rays (Poppenhäger et al. 2009). In contrast, the more active stars show no cyclic but instead fairly erratic chromospheric variability.
Our XMM-Newton monitoring program targets the long-term evolution of stellar X-ray emission. We now have data for almost a decade which enables us to check whether there are stellar X-ray cycles, and if detected allow us to study the cycle properties for a number of individual stars. The program focuses on a few nearby solar-type dwarf stars with spectral types from early G to mid K, corresponding to masses of 1.1...0.7 M⊙ and Teff ≈ 4200...5800 K. All stars are weakly to moderately active in X-rays, i.e. log LX/Lbol ≈ −5.5··· −7, and three out of five were known to exhibit a chromospheric cycle. In addition to the wide binaries 61 Cyg A/B and α Cen A/B, which are described in detail below, the monitoring sample includes the G2 star HD 81809 (Favata et al. 2008).
In this paper we present results from the XMM-Newton monitoring of 61 Cyg A/B and α Cen A/B. Our paper is structured as follows: in Sect. 2 we present the target stars, in Sect. 3 we describe observations and data analysis, in Sect. 4 we discuss X-ray light curves and short-term variability, in Sect. 5 we investigate coronal activity cycles and compare our results to solar measurements, and we close with a summary in Sect. 6.
2. The target stars
2.1. 61 Cygni
The 61 Cyg A/B (HD 201091, HD 201092) system is a nearby visual K dwarf binary at a distance of 3.5 pc, consisting of a K5V and K7V star. Both stars are slow rotators with periods of 35 and 38 days (Donahue et al. 1996) and the system is thought to be several Gyr old; age estimates range from 2 − 3 Gyr (Barnes 2007) up to 6 ± 1.7 Gyr (Epstein & Pinsonneault 2012). Interferometric radius measurements presented in Kervella et al. (2008) were combined with evolutionary models, which indicate an age of 6 ± 1 Gyr. The stars 61 Cyg A and B are included in the Mt. Wilson Ca ii H+K program and both stellar components were found to be cyclic with respective periods of 7.3 yr (A) and 11.7 yr (B) (Baliunas et al. 1995). The chromospheric cycle of the 61 Cyg A (mean S-index of ⟨ S ⟩ = 0.66) is quite regular, while the chromospherically more active component 61 Cyg B ( ⟨ S ⟩ = 0.99) has a less smooth cycle and shows more irregular variations. According to the false-alarm probability of Baliunas et al. (1995), 61 Cyg A’s cycle, termed “excellent”, is in the same highest quality grade as the Sun. Furthermore it is also the reddest (highest B-V) and most active (largest ⟨ S ⟩ ) star with this grade in the complete sample of more than one hundred stars. A follow-up program was started at Lowell Observatory, which continues to observe 61 Cyg in chromospheric emission lines; these more recent data are presented in Hall et al. (2007).
A ROSAT X-ray monitoring program of 61 Cyg tracked the X-ray behavior of the moderately active components during a few years in the 1990s, LX = 1...3 × 1027 erg s-1 (A) and LX = 0.4...1 × 1027 erg s-1 (B), but the time basis of these observations was too short to cover a complete cycle (Hempelmann et al. 2003). The first years of XMM-Newton X-ray monitoring of 61 Cyg are discussed in Hempelmann et al. (2006) and an update is given in Robrade et al. (2007). The data again covered only half the cycle period, but already showed that there is indeed a coronal cycle in phase with the chromospheric cycle on 61 Cyg A. An analysis of the merged RGS spectra of 61 Cyg and α Cen focusing on neon and oxygen lines in weakly active stars was presented in Robrade et al. (2008).
2.2. α Centauri
The visual binary α Centauri A/B (HD 128620, HD 128621) consists of a G2V (A) and a K1V (B) star and is part of the nearest stellar system at a distance of 1.35 pc; it also includes the M5 dwarf Proxima Centauri, which is outside the FOV of our observations. The two components α Cen A and B are separated by about 23 AU and have an orbital period of roughly 80 years. Basic stellar properties were e.g. presented by Flannery & Ayres (1978) and interferometric diameters were determined by Kervella et al. (2003). The α Cen system is thought to be slightly older than the Sun with age estimates ranging from 4.2 − 5.2 Gyr (Barnes 2007) to 6.8 ± 0.5 Gyr (Epstein & Pinsonneault 2012). Both stars are slow rotators with periods of about 29 (A) and 37 (B) days and have weakly active coronae, as shown by X-ray observations obtained in 1979 with the Einstein observatory. The secondary α Cen B was with LX = 2.8 × 1027 erg s-1 compared to LX = 1.2 × 1027 erg s-1 for α Cen A the X-ray brighter component (Golub et al. 1982). These authors speculated by comparing the Einstein data with previous IUE (International Ultraviolet Explorer) observations that both stars might have activity cycles that are out of phase. α Cen B was again the X-ray brighter component in ROSAT observations in the 1990s (Schmitt 1997). The first grating spectra obtained in 1999 with the Chandra LETGS provided wavelength coverage up to 175 Å and showed that the A/B flux ratio is temperature, i.e. energy-band dependent (Raassen et al. 2003). With average coronal temperatures about 1.6 MK (A) and 1.8 MK (B) α Cen B was the X-ray brighter component above 0.1 keV, but in softer X-rays the two components approach equal luminosity, and α Cen A was even brighter in emission lines originating from very cool plasma at ≲ 1 MK. Other similarities of the α Cen stars to the Sun are e.g. the elemental abundance pattern which show the “FIP-effect” (First Ionization Potential), i.e. an coronal enhancement of low-FIP elements compared to high-FIP elements.
For the α Cen system no chromospheric long-term monitoring data are available and it was unknown at the beginning of our observations whether the two stars exhibited activity cycles. Early results of the XMM-Newton monitoring program of the α Cen stars were presented by Robrade & Schmitt (2005). Most strikingly an X-ray dimming of α Cen A by an order of magnitude within three years was observed in the bandpass of the EPIC detectors, caused by a strong decrease in emission measure at a few MK. Shortly afterwards, the secondary α Cen B also started to become fainter in X-rays, and indications for cyclic behavior emerged when observations verified the ongoing decline of its X-ray brightness (Robrade et al. 2007). The α Cen system is also monitored with the Chandra HRC-I since the end of 2005. The HRC is quite sensitive to soft X-ray photons and provides superb spatial resolution and positions, but virtually no spectral information. A second LETGS observation in 2007 additionally supported the analogy of the α Cen A luminosity decrease to the solar behavior, i.e. a vanishing of predominantly hotter coronal structures and a quite constant flux from cooler (≲1 MK) structures (Ayres 2009). Average coronal temperatures in 2007 were 1.1 MK for α Cen A and 1.9 MK for α Cen B. Extensive UV coverage of the α Cen system is provided e.g. by IUE and FUSE (Far Ultraviolet Spectroscopic Explorer). In a multi-wavelength study of α Cen B, DeWarf et al. (2010) analyzed measurements at X-ray, FUV, and UV wavelengths and determined an activity cycle period of 8.8 ± 0.4 yr. A similar period of 8.4 yr was derived by Buccino & Mauas (2008) using IUE Mg ii line fluxes and Ca ii measurements that included new data obtained at the CASLEO observatory. However, no clear activity cycle for α Cen A has been detected so far.
3. Data analysis and observations
3.1. Overview
The target 61 Cyg has been observed twice a year with XMM-Newton since 2002, while α Cen has been observed with a more irregular sampling since 2003. We present an analysis of the complete data obtained until the end of 2011 and study 20 exposures for 61 Cyg and 12 exposures for α Cen with individual exposure times ranging between about 5 − 16 ks. In total, 61 Cyg was observed for about 225 ks and α Cen for 115 ks; observations used in this work are summarized in Table A.1.
The data were reduced with the XMM-Newton Science Analysis System software SAS 10.0, older data were reprocessed and standard SAS tools1 were used to produce images, light curves, and spectra. For our analysis we used data from the EPIC (European Photon Imaging Camera) instrument that consists of two MOS and one PN detector; we noter that the point spread function (PSF; FWHM ~ 6″) is better sampled by the MOS (pixel size 1.1″), while the PN has a higher sensitivity. A detailed description of the instruments can be found in the “XMM-Newton Users Handbook”2 Spectral analysis was carried out with XSPEC V12.6 (Arnaud 1996) and we used multi-temperature APEC/VAPEC models (Smith et al. 2001) with abundances relative to solar values as given by Grevesse & Sauval (1998) to derive X-ray luminosities and emission measure distributions (EMD). Source and background photon extraction was adjusted to the individual source properties as described below. The spectral analysis was performed independently for MOS and PN data when possible and we obtained overall consistent results, but there are discrepancies of about 20% for individual datasets. The quoted errors are statistical errors at a 90% confidence level; note that the intrinsic X-ray brightness variability of the target stars is typically stronger than any statistical or systematic error except for the very faintest observations. To study the activity cycles we investigated the quasi-quiescent coronal state, i.e. we excluded larger flares on the basis of the respective X-ray light curves; selected flares are discussed in a separate section. Here strong flaring activity is defined as phases where the peak flux exceeds the average quasi-quiescent level by a factor of two or more. All given quasi-quiescent properties refer to the 0.2 − 2.0 keV energy band. To convert our 0.2 − 2.0 keV luminosities to typical energy bands of Einstein (0.15 − 4.0 keV) and ROSAT (0.1 − 2.4 keV) and vice versa, we calculated temperature-dependent conversion factors from APEC models. In the temperature range 2 − 10 MK the differences in energy band flux are relatively small compared to the intrinsic variability. For example, at 2 MK we obtained fluxes higher by 1.1/1.15 in the respectively softer bands, but toward lower temperatures the factors increase, for instance they are 1.5/1.9 at 1 MK (see Table A.2).
Throughout, we adopted the following radii and luminosities, taken from above literature or calculated from the visual magnitudes for the determination of surface fluxes FX and activity levels LX/Lbol: 1.2 R⊙, 1.5 L⊙ and 0.9 R⊙, 0.5 L⊙ for α Cen A/B; and 0.7 R⊙, 0.15 L⊙ and 0.6 R⊙, 0.1 L⊙ for 61 Cyg A/B.
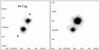 |
Fig. 1 MOS1 images of 61 Cyg taken in 2006 (left) and 2009 (right) at about activity minimum and maximum for 61 Cyg A. Exposure times are similar and an identical linear brightness scaling is used. |
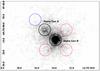 |
Fig. 2 MOS1 image of α Centauri A/B obtained in 2003, source regions (black) and control regions (red/blue) are overplotted. |
3.2. Modeling of 61 Cygni and α Centauri
The two components of 61 Cyg A/B are well separated in all EPIC detectors with a distance of roughly 33″, as shown in Fig. 1. Source photons were extracted from a 15″ circular region around the respective component and the background was taken from nearby source-free regions. The contamination from the other component is less than 3% and was not removed except for very strong flares (see Fig. 3). For the 05/2002 observation we used only the PN data for spectral analysis because of the exposure of the MOS detectors is very short (<1 ks) and we corrected the count rates of the 10/2010 and 04/2011 observations for vignetting caused by offset pointings by using instrument effective area files. We found that 3-T models are sufficient to describe the spectra and applied two types of models that have temperatures as free parameters or use a fixed 0.1, 0.3 and 0.7 keV temperature grid. Both models have solar metallicity and the derived results agree with each other. We also tested models with lower (0.6 solar) or variable abundances, but again found only minor effects on the derived X-ray luminosities.
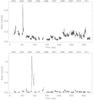 |
Fig. 3 X-ray light curves of 61 Cyg A (top) and 61 Cyg B (bottom) during the XMM monitoring, merged MOS data. |
The distance between the α Cen A/B binary components was about 12″ in 2003 and it declined throughout our monitoring to 7″ in 2010. Thus the binary is, especially later in the campaign, only moderately resolved by XMM-Newton and photon extraction becomes crucial. We used the position of the X-ray brighter component α Cen B as zero-point of the system and determined those of α Cen A from the respective offset. Source photons were extracted from circular regions with 30″ radius for the combined system and 5″ for both components (2003−2006). This region gradually decreased later. To study the X-ray fainter α Cen A, MOS2 data were discarded due to its triangular PSF shape and the PN data were used only until 2007, when the binary separation became approximately twice its pixel size. We studied the effects of component cross-talk by using three adjacent control regions for α Cen A and one for α Cen B, as shown in Fig. 2. A secondary, mirrored control region (not plotted) was used to track the contribution from α Cen B itself, compared to those from α Cen A. In summary, the contamination of α Cen A is moderate in the beginning of the campaign with ~30%, but becomes dominant in several later observations with ≳90%, while the contamination of α Cen B is minor for all observations with ≲ 5% and the “true” background is negligible. Light curves account for dead CCD columns in individual MOS exposures and count rates were scaled regarding reduced detector “live time” in the small/large window mode (2002−2007) and the narrower extraction regions (2007−2010).
To determine the X-ray luminosities of α Cen A/B, we first transformed the measured count rates directly into X-ray fluxes by using temperature-dependent conversion factors calculated with the webPIMMS tool3; here we used solar abundance APEC models with temperatures of 1.0, 1.2, 1.4, 1.6 and 1.8 MK for the different activity phases, i.e. count rates, of α Cen A and with temperatures of 1.8, 2.0 and 2.2 MK for α Cen B (see Table A.2). In a second step we modeled the spectra of the system and determined the individual fluxes from the corrected A/B count-ratio. In addition, spectra from the respective PSF cores of the components were modeled. The background for α Cen A was taken from the control regions, otherwise nearby source free regions were used. Spectral modeling uses multi-temperature VAPEC models, and depending on its quality, we used one, two or three temperature components. To account for the FIP effect found in the coronae of the α Cen stars (Raassen et al. 2003), we used two sets of abundances (a) 1.5 solar for low-FIP elements (Fe, Mg, Ca, Ni), 0.5 solar for high-FIP elements (O, N, Ne) and solar abundances for other elements and (b) O, N, Ne, Mg, Fe as free parameters and the remaining elements at solar values. Altogether we applied up to three methods to derive the X-ray fluxes, i.e. count-rate conversion, weighted spectral modeling of the system and individual spectral modeling, which were averaged to derive the final X-ray luminosity.
4. X-ray monitoring
The X-ray light curves obtained over our campaign give an impression of the diversity in variability of our target stars; in addition to long-term variations of the quasi-quiescent flux several flares also have occurred during our observations.
4.1. The total light curves
The X-ray light curves of 61 Cyg A and B are shown in Fig. 3. Prominent features are the smooth variation of the quasi-quiescent level of 61 Cyg A, a strong flare on 61 Cyg B and an intermediate flare on 61 Cyg A. In addition, many smaller flares, minor activity, and a variable activity level were recorded during the campaign. A few observations were performed during overall more active phases, and moderate variability of up to ~50% is present in several of the individual datasets. The X-ray light curves were derived from the merged MOS data in the 0.2−2.0 keV energy band with background subtraction and 300 s time binning. Furthermore we roughly established real-time chronology of the long-term evolution by using a time interval of 16.5 ks for each exposure when plotting the light curves: this is indicated by the time line on top of each panel, while the x-axis tracks the individual running time. This approach also allows a better comparison with Figs. 6 and 7.
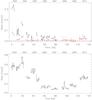 |
Fig. 4 Top: X-ray light curves of α Cen A from PN (black) and MOS1 (red). Bottom: α Cen B (merged MOS) during the XMM monitoring. |
The light curves of α Cen A/B are shown in Fig. 4; for α Cen B we used merged MOS data with a binning of 500 s. The light curves of α Cen A were obtained independently from MOS1 and PN data with a binning of 1 ks, PN data excluded from analysis are indicated by dashed lines. We used the 0.2 − 2.0 keV energy band and approximated real-time chronology of the long-term evolution by using 18 ks for each year in the plot. Both components show significant long-term variability during our campaign and are characterized by low activity. In addition, we detected two smaller flares on α Cen B, but no clear flare event from α Cen A. There is little observed short-term variability in the α Cen system stars, but the low number of detected counts prevents a detailed study for most datasets.
4.2. Flares
We detected several flares from each of our low to moderately active stars with the exception of the least active star α Cen A. While not as strong and frequent as on more active stars, the observed flares cover several orders of magnitude in maximum X-ray brightness and emitted energy.
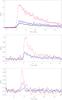 |
Fig. 5 Strongest X-ray flares from 61 Cyg B (top), 61 Cyg A (middle), and α Cen B (bottom) observed during the XMM campaign; PN data in the 0.2 − 0.5 (black), 0.5 − 0.8 (scaled, blue), and 0.8 − 5.0 keV (scaled, red) energy band. |
The strongest flare observed on each of the three mentioned stars is shown in Fig. 5; the strongest flare during the total campaign occurring on 61 Cyg B (11/2004), an intermediate one on 61 Cyg A (11/2003) and a weak event on α Cen B (07/2008). Owing to the presence of hotter plasma, we studied the flares in the 0.2−5.0 keV band. The X-ray light curves were subdivided into three energy bands to trace the energetic behavior, here the 0.5−0.8 keV and 0.8−5.0 keV band were scaled to match the respective pre-flare flux in the 0.2−0.5 keV band. The temporal behavior of the α Cen B and 61 Cyg A flare are similar, both show short rise times of about 0.3 ks and two to three times longer decay times (e-fold) of 0.7 and 0.8 ks. In contrast, the 61 Cyg B flare with a rise time of 0.8 ks has a six times longer decay time of 5 ks; together with some flattening of the decay this indicates reheating or an erupting multiple-loop structure. From the inspection of the flare light curves, we shall see the hardest spectral band always leads the flare rise and shows the strongest relative flux increase by far, a typical behavior for solar and stellar flares in the chromospheric evaporation scenario. Note that the α Cen B flare shown occurred at about activity minimum and that the post-flare rate in the 0.8−5.0 keV is roughly 30% lower compared to the pre-flare state; this is in contrast to the medium- and low-energy band which stayed constant or even increase moderately, indicating that the active region that produced the flare is also attenuated by this event.
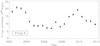 |
Fig. 6 X-ray activity cycle of the K5 star 61 Cyg A as observed with XMM-Newton. |
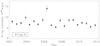 |
Fig. 7 X-ray activity of the K7 star 61 Cyg B observed with XMM-Newton; so far no cyclic long-term trend is present. |
The α Cen B flare has a duration of roughly half hour, reaches at peak about LX = 1.2 × 1027 erg s-1 and releases 5 × 1029 erg in total. A flare of similar energy from α Cen B which was detected in 01/2004 at about activity maximum was discussed in Robrade & Schmitt (2005); likely these events are among the faintest stellar flares with a clearly observed rise and decay phase detected in X-rays. Several small and intermediate events are also detected from 61 Cyg A and 61 Cyg B. The strongest flare on 61 Cyg A occurred at about its activity maximum in 2003 with an X-ray brightness increase by a factor of about five. It reaches a peak luminosity of about LX = 6 × 1027 erg s-1 and released about 1 × 1031 erg in soft X-rays within 3 ks. The strongest flare event by far was observed on 61 Cyg B in 2004, here the X-ray brightness increased by a factor of about 20 compared to the quasi-quiescent state and we measured flare plasma temperatures of 20 MK. This flare reaches at maximum LX = 1.4 × 1028 erg s-1 and releases 7 × 1031 erg in total within 10 ks. As indicated by the MOS light curve shown in Fig. 3, a second event occurred at the final stage of the flare decay, but only its initial rise phase is covered by the observation. To compare this to strong flares observed on the Sun, we transformed the solar flux to the energy band used here. A solar X-class flare emits above 2.8 × 1026 erg s-1 at its peak in the 1 − 8 Å (1.55 − 12.4 keV) GOES band, roughly corresponding to 1 × 1027 erg s-1 in the 0.2 − 5.0 keV band for a 15 MK plasma.
5. Coronal activity cycles
We investigated the cyclic coronal activity by using the quasi-quiescent X-ray properties as determined for each star and observation.
5.1. Long-term brightness variations
The long-term evolution was derived from our XMM-Newton data and was compared to measurements from other instruments; all properties refer to the 0.2 − 2.0 keV band.
5.1.1. The 61 Cyg system
The XMM-Newton observations of the 61 Cyg system cover nearly ten years so far, which means more than one complete activity cycle of 61 Cyg A with its chromospheric period of 7.3 ± 0.1 yr. As shown in Fig. 6, the X-ray data exhibit quite smooth long-term variations and cover two distinct activity maxima. This is one of the rare cases where a clear X-ray cycle on a star other than the Sun is covered for more than a period. Furthermore, the data were collected from a mid K star and illustrate the existence of stellar coronal activity cycles in a broader population in an unprecedented fashion. The smoothness of the observed X-ray cycle also indicates that effects induced by rotational modulation or variability on intermediate timescales of months are only of minor importance. The position of the first activity maximum in the new millennium was determined to be at mid/end 2002 from near simultaneous X-ray and chromospheric measurements (Hempelmann et al. 2006), leading to the prediction that a new maximum would occur at the end of 2009. This agrees well with our X-ray measurements, which indicate an identical X-ray cycle length within an accuracy of a few months. Expanding the time-line to the earliest chromospheric observations, where a first minimum is observed at about 1970.0 and combining it with our new X-ray maximum, we again recover the 7.3 yr period from Baliunas et al. (1995) with an accuracy better than 0.1 yr over 40 years of observations. The combined chromospheric and coronal data of 61 Cyg A show that the period of the activity cycle is quite stable over several decades and that no significant phase-shift exists between both activity indicators.
The second X-ray maximum is slightly more sharply peaked than the first one, but overall the smooth, nearly sinusoidal X-ray brightness variations of 61 Cyg A are reminiscent of the solar activity cycle. A significant difference is the amplitude (LXmax/LXmin) between minimum and maximum activity, which is only a factor of three on 61 Cyg A compared to a factor of roughly ten for the Sun at similar energies. The X-ray cycle of 61 Cyg A shows two X-ray maxima of comparable brightness and a quite broad or flat minimum with ongoing minor activity. The X-ray luminosity varies between LXmin = 7 × 1026 erg s-1 and LXmax = 2.1 × 1027 erg s-1 over the cycle. The first X-ray maximum is about 15% higher than the second one, a fairly minor difference given the intrinsic variability of the star. Comparison with its optical luminosity results in a moderate activity level, varying from log LX/Lbol = −5.9 ... −5.4, thus 61 Cyg A is roughly an order of magnitude more active than the Sun. Very similar X-ray brightness levels were observed with ROSAT in the 1990s (Hempelmann et al. 2006) and as we already pointed out, 61 Cyg A is with a spectral type of K5 also the latest star with an “excellent” activity cycle in the Mt. Wilson sample (Baliunas et al. 1995).
In contrast, the K7 star 61 Cyg B exhibits no clear cyclic X-ray brightness variations in the XMM-Newton observations so far (see Fig. 7), although a chromospheric activity cycle with a period of 11.7 ± 0.4 yr has been derived and significant variability is present in the ROSAT data obtained during five years in the mid-1990s (Hempelmann et al. 2006). Extrapolating the chromospheric data, a new activity maximum should have occurred about 2004, but remarkably the quasi-quiescent flux is quite constant and exhibits only a weak decline of 20% as long-term trend during our observations. Typical quasi-quiescent deviations from the mean brightness are less than 30% and quite irregular, but several individual observations are dominated by short-term behavior and weak to moderate flaring activity. We found that 61 Cyg B resided at an intermediate state in a kind of activity plateau around a mean X-ray luminosity of LX = 8 × 1026 erg s-1, corresponding to an activity level of log LX/Lbol = −5.6. Compared to the ROSAT data, where 61 Cyg B showed LX = 4...10 × 1026 erg s-1, the observed X-ray luminosity is neither specifically low, nor high. This behavior is somewhat unexpected for a cyclic star, but its chromospheric cycle, although denoted as “good” in Baliunas et al. (1995), also appears at times to be quite irregular and is less smooth than the one of 61 Cyg A. Nevertheless, the X-ray data fits to more recent Ca ii observations of 61 Cyg B well (Hall et al. 2007), which show a maximum around 2000 that is followed by a minor decline over about two years and a fairly flat activity curve since 2002. Altogether, the data point to a slightly shorter 10 − 11 yr or variable activity cycle period.
5.1.2. The α Cen system
The earliest and least active star in our sample is the G2 star α Cen A. Attributing the observed activity trend during seven years of X-ray monitoring to the most likely scenario, i.e. an activity cycle, our observations indicate a cycle period of longer than 10 yr with quite a broad minimum, as shown in Fig. 8 (upper panel). This suggests that α Cen A exhibits an activity cycle that is similar to the solar one with respect to period and amplitude, but a longer observational time-line is clearly needed to confirm this hypothesis. The relative X-ray brightness variations are the strongest of the presented sample stars. The X-ray luminosity of α Cen A during the XMM-Newton observations ranges between LXmin ≈ 7 × 1025 erg s-1 and LX = 6 × 1026 erg s-1; variations are roughly an order of magnitude, but the exact minimum is quite poorly constrained by these data. After reaching its faint state in 2005, α Cen A is barely detected at the 2 − 3σ level with MOS1/PN and its luminosity stayed at a low but variable level over the next five years. We clearly detect α Cen A in several exposures from 2006 to 2010, but it remained undetected in the 2009 MOS1 exposure, in which we obtain only an upper limit for its X-ray brightness. Furthermore, we have not covered an activity maximum, but considering the 30-year history of X-ray observations, the ratio between maximum and minimum X-ray brightness is about a factor of 15, and α Cen A has a mean activity level of log LX/Lbol ≈ − 7.0. If the observed decline is not an unprecedented event, we likely started observations after its last activity maximum and α Cen A has a coronal activity cycle with variability of at least an order of magnitude and a rough period estimate of ~ 12 − 15 yr.
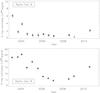 |
Fig. 8 X-ray activity of α Cen A (likely cyclic) and α Cen B (cyclic) as observed with XMM/MOS1 (A) and XMM/EPIC (B). |
The X-ray observing history of α Cen A helps to address the question of its long-term evolution and to cross-check our results. As a check, we also modeled the dispersed spectra of a second LETGS observation performed in 06/2007 analog to the MOS data and found LX = 0.9 × 1026 erg s-1. This is intermediate to our two nearest XMM values of LX = 0.7/1.0 × 1026 erg s-1 (02/2007, 07/2008) and indicates that the derived values reflect the flux of α Cen A in its low state quite well, i.e. LXmin ≲ 1 × 1026 erg s-1. As an additional test, we summed up all measured LETGS lines in the spectral range 6−60 Å as given by Ayres (2009), treated all upper limits as detections and accounted for the missing flux by using APEC models (see Table A.2). The plasma model uses the FIP pattern abundances as described in Sect. 3 and results are checked with a solar abundance model. For appropriate plasma temperatures, here at about 1 MK, we obtain LX ≈ 1.2−1.4 × 1026 erg s-1 with this approach. To trace its evolution backward in time, we repeated the spectral modeling and line flux conversion for the 12/1999 LETGS observation as above, and found an X-ray luminosity of LX ≈ 3.5−4.5 × 1026 erg s-1. These results also fit the LX ≈ 2 × 1026 erg s-1 derived by DeWarf et al. (2010) for the ROSAT 1996 data, supporting the idea of an activity cycle, in which the last α Cen A maximum has occurred early in the new millennium before the start of our XMM-Newton observations.
The XMM-Newton observations of the K1 star α Cen B do not yet cover a full cycle, but the long-term trend in X-ray luminosity exhibits a likely maximum at the end of 2003/early 2004, a clear minimum at the end of 2007/early 2008 and a successive rise until 2010 (see Fig. 8, bottom panel). The observed trend in X-rays fully supports an activity cycle with a period of about 8−9 yr as derived from a combined analysis of multiple activity indicators (DeWarf et al. 2010). Our X-ray data indicate X-ray brightness variations over the cycle of roughly a factor six to eight in the 0.2−2.0 keV band. X-ray luminosities range between LXmin ≈ 4 × 1026 erg s-1 and LXmax = 2.5 × 1027 erg s-1, corresponding to a mean activity level of log LX/Lbol = −6.1. Calculating as above the LETGS flux value for the 06/2007 observation, we found LX ≈ 3.0 − 4.0 × 1026 erg s-1 from spectral modeling and emission line flux conversion, which agrees well with expectations from the 02/2007 XMM-Newton near minimum value of LX = 4 × 1026 erg s-1. Our data indicate an activity maximum at the beginning of the XMM-Newton monitoring, therefore one expects a previous activity minimum to have occurred at about the end of the 1990s. This is supported by the LETGS data from 1999, from which we derive an X-ray luminosity of LX ≈ 4.0−5.0 × 1026 erg s-1 (note that the LX in Raassen et al. (2003) for these data are overestimated, priv. comm.), similar to our minimum LX from the 2007 data. Extrapolating even farther back in time, it is not surprising that Einstein (1979, LX = 2.8 × 1027 erg s-1, Golub et al. 1982) and ROSAT (1995/96, LX ≈ 2 × 1027 erg s-1, DeWarf et al. 2010) measured an X-ray brightness similar to the XMM-Newton (2004, LX = 2.5 × 1027 erg s-1) values in the beginning of our campaign; by chance all three satellites observed α Cen B at about its activity maximum.
This paper focuses on the XMM-Newton data, in which we find an overall agreement between 0.2 − 2.0 keV luminosities derived from the MOS and PN detectors, regardless of being obtained from spectral modeling or by conversion of count rates. We also found consistency with LETGS spectra and for the combined α Cen system with the RGS when modeling these data, converting emission line fluxes or comparing flux ratios of strong lines. We note that discrepancies exist between literature values for the ROSAT HRI data. Fluxes obtained from contemporaneous Chandra HRC-I observations (Ayres 2009) are higher than our results; a similar inconsistency exists between Chandra ACIS-S and HRC-I observations of 51 Peg (Poppenhäger et al. 2009).
5.2. Spectra and spectral changes
In the following we investigate the spectra of our target stars and study changes of their coronae during the activity cycles.
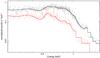 |
Fig. 9 PN spectra of 61 Cyg A at about maximum (black, 10/2009) and minimum (red, 10/2006) coronal activity with spectral models. |
5.2.1. 61 Cygni A/B
To characterize the cycle properties of 61 Cyg A, we studied observations made at about maximum and minimum X-ray luminosity, of which we simultaneously modeled three observations for each state. We determined the respective coronal temperatures and emission measure distributions, and as above restricted the analysis to the quasi-quiescent state. To account for minor X-ray brightness differences of about 10% between individual observation, the normalization was taken as a free parameter and the result was averaged for each activity state. Here we used data of the more sensitive PN detector, but qualitatively very similar results were obtained for the MOS data. As an example we show two PN spectra representative of the two activity states with their respective model in Fig. 9; the obtained modeling results for 61 Cyg A are summarized in Table 1.
Corona of 61 Cyg A at maximum and minimum activity.
The multi-temperature models indicate an average plasma temperature of about 1.5−2.0 MK at the activity minimum and of roughly 2.5 MK at maximum; for example, the models shown in Fig. 9 correspond to average coronal temperatures of 1.6 MK and 2.4 MK. Comparing the individual plasma components at maximum and minimum activity, we found that their temperatures are virtually identical, but the emission measure changes significantly and also in a temperature-dependent way. Compared to the situation on the Sun, the three temperatures components can be related to main solar coronal structures; i.e. 1−2 MK corresponding to the quiescent Sun (network, coronal holes), 2−5 MK to active regions, and hotter plasma to flaring regions (Orlando et al. 2001). The hot plasma component at 8 MK is at activity maximum about ten times stronger, the intermediate component at 4 MK is roughly 2−3 times stronger and the cool component at 1 MK is only about 50% stronger than at minimum. However, 61 Cyg A is only moderately active and even at maximum the 1 MK component contributes about 60% to the total EM, whereas around minimum it is up to 80%. While the 8 MK plasma component is only marginally detected at activity minimum, significant amounts of 4−5 MK plasma are always present. Consequently, a state similar to the “quiet Sun”, i.e. a 1−2 MK corona without any significant contribution from hotter plasma, is never present on 61 Cyg A.
Although the cycle period is significantly shorter, the X-ray luminosity varies only by a factor of three, and 61 Cyg A is generally more active than the Sun, the overall coronal trends are identical for both activity cycles. Given the smoothness and regularity of the activity cycle on 61 Cyg A, these findings indicate that the underlying mechanisms generating cyclic activity are also quite similar.
Like the X-ray brightness of 61 Cyg B, its quasi-quiescent spectra are also quite similar for all observations. The corona of 61 Cyg B is well described by a plasma distribution with similar temperature components as found for the primary. The corona of 61 Cyg B is moderately hotter with an average temperature of about 2.2 MK than that of 61 Cyg A when comparing phases of similar X-ray brightness, but the coronal temperature distributions become quite similar when comparing identical activity levels.
Coronal EMD of α Cen B during the activity cycle.
5.2.2. α Centauri A/B
Spectra of the α Cen A/B system show that the coronae are strongly dominated by plasma at relatively cool temperatures at all phases. At maximum X-ray brightness in 2003 the spectra are well described by a 3-T model with temperatures of about 1.5, 3.5, and 8.0 MK. The EMD is dominated by 1−4 MK plasma, resulting in an average temperature of 2−2.5 MK. Separate spectral modeling shows that α Cen A exhibits a moderately higher EM1/EM2 ratio for the two cooler components, whereas the 8 MK component is significantly present only on α Cen B. This means that the X-ray brighter K1 star α Cen B exhibits a hotter corona than the G2 star α Cen A during all of our observations. The X-ray luminosity of α Cen A showed a quite rapid drop within two years and in later observations photons are detected almost exclusively at very soft X-ray energies (<0.5 keV), indicating dominant temperatures of ≲1 MK and a virtually complete vanishing of hotter coronal structures.
The secondary α Cen B strongly dominates the system especially in all later XMM-Newton observations and we modeled its coronal properties for one representative observation at about maximum, minimum, and intermediate activity phase. Typical results, here obtained from the FIP model for the MOS data, are given in Table 2. The modeled temperatures and emission measures for individual exposures show changes during the activity cycle that resemble those of 61 Cyg A. The cool 1.5 MK plasma component dominates the emission at all times; even at activity maximum it contributes above 60% of the total emission measure and is roughly twice as strong as the 3.5 MK component. In addition, at maximum a weak 8 MK component is detected in the quasi-quiescent phase that contributes by a few percent to the total emission measure. Toward activity minimum the 8 MK component vanishes and a strong decline in emission measure occurs in the other two components. The decline of the 3.5 MK component is with a factor of nearly ten more than twice as strong as that of the 1 MK component, leading to a decline of the average coronal temperatures to about 1.5 MK at minimum. During the re-brightening of α Cen B in 2010 a hotter plasma component appears, but it is still slightly cooler and weaker than during activity maximum.
5.3. X-ray cycles of the sample stars compared to those of the Sun
We discuss our findings on coronal activity cycles in a broader context and compare them to stellar and solar activity cycles as seen in X-rays and other activity indicators.
The basic stellar and X-ray activity cycle properties of the presented stars are summarized in Table 3. Stellar data are taken from references given in Sect. 2 and X-ray properties are from this work; literature values are given in italics when the activity range is not fully covered. In addition to the stars studied here, we used as comparison two other G2 stars, HD 81809 and the Sun. The moderately active star HD 81809 is also part of our observing program (Favata et al. 2008). It has a chromospheric cycle of 8.2 yr and an X-ray luminosity range of LX ≈ 1.4−6.4 × 1028 erg s-1 in quasi-quiescence, corresponding to an average log LX/Lbol = −5.6. The Sun exhibits an average cycle period of 11 yr and has an X-ray luminosity range of LX ≈ 0.5−6 × 1027 erg s-1, corresponding to an average log LX/Lbol = −6.2 (see e.g. Judge et al. 2003).
Stellar and X-ray cycle properties (0.2−2.0 keV) of the analyzed stars; brackets denote literature values, log LX in [erg s-1].
Sorting the three G2 stars by increasing activity, i.e. α Cen A, Sun, and HD 81809, we find as a general trend for their coronal activity cycles that the less active stars have activity cycles with longer periods and stronger relative brightness variation at soft X-ray energies above 0.2 keV. Comparing stars with a similar activity level, i.e. α Cen B vs. Sun, and 61 Cyg A vs. HD 81809, we find that the stars of earlier spectral type have longer periods and stronger brightness variations at soft X-ray energies. These trends are based on a few stars only, but might be representative for coronal activity cycles in general.
A common feature of the studied stars are the variations of their coronal properties during the activity cycle. The observed changes in the emission measure distribution of 61 Cyg A and α Cen B are similar to those present in the solar corona and on HD 81809, despite different underlying stars and activity levels. In all studied coronae the variations in emission measure basically determine the amplitude of the cycle. Furthermore, the emission measure reduction is significantly stronger in the respective hotter plasma components, and as a consequence, an X-ray luminosity decrease is always accompanied by a decrease of the average coronal temperature. In addition, the absolute temperature scale of this trend and the individual emission measure distributions depend on the activity level of the respective star. For example, α Cen B and 61 Cyg A show similar trends, but these are shifted toward cooler temperatures in less active stars. As a consequence, cycle amplitudes are strongly dependent on the X-ray energy band, and in particular an X-ray cycle has a more pronounced brightness contrast between activity maximum and minimum in harder X-ray bands, which – if sufficiently broad – typically trace increasingly hotter plasma. Aside from cyclic stars being always weakly or at best moderately active, they do not differ from other magnetically active stars, i.e. X-ray brighter stars have higher coronal temperatures and exhibit stronger and more frequent X-ray variability and flaring. The activity scaling and similarity between cycle properties indicate that the changes of coronal properties over an activity cycle are based on similar physical scenarios and follow a universal pattern in all stars.
It is instructive to compare the activity minimum state of our sample stars to other inactive stars observed with ROSAT (0.1−2.4 keV), and with the Sun, where Schmitt (1997) found that the minimum surface flux is well described by the flux from “quiet Sun” regions as derived from soft X-ray observations of solar coronal holes, there given as log FX = 4.1 ± 0.2 erg cm-2 s-1. The full Sun has at activity minimum, adapting log LX = 26.8 erg s-1 (Judge et al. 2003), an average surface flux of log FX = 4.0, i.e. slightly above the minimum value of log FX = 3.9. We converted our X-ray measurements to ROSAT band fluxes by using the parameters given in Table A.2 and obtained minimum surface fluxes of log FX = 4.4 erg cm-2 s-1 for 61 Cyg A and B, log FX = 3.3 for α Cen A, and log FX = 4.0 for α Cen B. 61 Cyg A has at activity minimum a higher surface flux than the minimum Sun. This indicates that some relevant and more active regions are also present during the minimum of 61 Cyg A, in agreement with our findings from spectral modeling. Comparable results are obtained for the observed phases of 61 Cyg B. The minimum surface flux of α Cen B is quite similar to the solar one and with TX = 1.5 MK it also exhibits similar temperatures, therefore it is likely a fair “coronal minimum twin”. For α Cen A we have adopted above a low coronal temperature of 1 MK, i.e. assumed twice as much flux in the 0.1−2.4 keV band, but still one would need an X-ray flux five times higher to obtain a value of log FX = 3.9 erg cm-2 s-1. Significantly lower coronal temperatures seem to be ruled out from inspecting the EMD of α Cen A in Ayres (2009). While there is some uncertainty in the minimum LX, the required increase is quite high, and by using a 50% higher surface flux we still derive only log FX = 3.4. Accordingly, if one accepts the above solar values, α Cen A at minimum is less active than the minimum Sun and its average surface flux is even below the flux from solar coronal holes. Alternatively, the solar minimum flux derived in most studies is not correct, and e.g. Orlando et al. (2001) found log FX = 3.3...3.5 erg cm-2 s-1 in the ROSAT band for low-activity data from the mid 1990s, very similar to our α Cen A results. We caution that solar minimum flux estimates and cycle amplitudes from different modeling approaches easily vary by an order of magnitude. These discrepancies re-emphasize the need of proper disk-integrated solar X-ray fluxes over its activity cycle, but a 0.1−2.4 keV minimum surface flux limit of log FX ≈ 4.0 erg cm-2 s-1 for magnetically active late-type stars is apparently brought down by the least active stars.
Comparing the cycle properties observed by coronal indicators (X-rays) with those of chromospheric indicators (Mg ii, Ca ii HK) and again specifically 61 Cyg A to the Sun, we find a mean S-index of ⟨ S ⟩ = 0.63 − 0.66 for 61 Cyg A and of ⟨ S ⟩ = 0.17−0.18 for the Sun. However, the S-index depends on the reference continuum and thus on the underlying star. Subtracting the photospheric component, one obtains  for the Sun and
  for 61 Cyg A (Hall et al. 2007), consequently the coronally more active star 61 Cyg A as reflected by a higher log LX/Lbol value is also chromospherically more active. Comparing the chromospheric excess fluxes, i.e. corrected for photospheric and “basal” contribution given as ⟨ ΔFCa ⟩ in Hall et al. (2007), one finds comparable values for both stars, very similar to their absolute X-ray luminosities. The deviation of the seasonal mean in Ca ii flux is for the Sun (0.144) again slightly higher than that of 61 Cyg A (0.124), but cyclic variations are clearly less pronounced than in X-rays. The α Cen binary stars are part of the CTIO Ca ii observing program of southern solar-like stars, and Henry et al. (1996) give for two periods of data taken in 1992/1993 mean values of ⟨ S ⟩ = 0.16 and
  for α Cen A and ⟨ S ⟩ = 0.21 and
  for α Cen B. As in X-rays, α Cen A is also less active than the Sun in Ca ii, while α Cen B is slightly more active. Buccino & Mauas (2008) derived Ca ii S-indices from ground-based data obtained in 2002 − 2004 at the CASLEO observatory and derived values of ⟨ S ⟩ ≈ 0.15 for α Cen A and ⟨ S ⟩ ≈ 0.22 for α Cen B; at these times α Cen A was declining toward it low-activity state, while α Cen B was near its X-ray maximum.
Overall, coronal activity cycles are, like their chromospheric analogs, a quite common feature in weakly active G and K dwarfs. The similarity of the coronal changes observed in stars with spectral types ranging from G2 to K5 and different activity levels suggests that a universal underlying dynamo mechanism is causing the activity cycles in all stars, in which spectral type and and rotation determine the activity level and cycle properties respectively.
6. Summary
Significant long-term, most likely cyclic X-ray variability is detected in all four studied early-G to mid-K dwarfs. Our sample stars have weak to moderate activity levels (log LX/Lbol ~ −5.5··· −7), on which the absolute coronal temperature scale depends. However, all coronal cycles show solar-like variations, i.e. they are more dominant in respective hotter plasma components. X-ray luminosities vary by up to an order of magnitude at soft X-ray energies above 0.2 keV, therefore monitoring is essential to determine the true activity range for these stars.
The K5 star 61 Cyg A shows a smooth and persistent coronal activity cycle. It is the latest and most active star with a detected regular X-ray cycle in our sample. The X-ray cycle amplitude is with a factor of about three significantly lower than for the Sun, but the changes of coronal properties during its 7 yr cycle are very similar.
The K7 star 61 Cyg B shows a weakly declining X-ray trend that is likely part of a more irregular 11 yr cycle. It is the most active star in our sample and exhibits the most frequent short-term variability and the strongest flaring activity.
The G2 star α Cen A is the least active star in our sample and shows the strongest X-ray variability with a factor of about ten. No complete cycle has been covered by our monitoring, but the long-term X-ray observations indicate cyclic activity with variations of about one order of magnitude at soft X-ray energies and a likely period of about 12 − 15 yr, i.e. a slightly longer and stronger cycle than observed on the Sun.
The K1 dwarf α Cen B exhibits quite smooth X-ray variability of roughly a factor six to eight between maximum and minimum activity and our observations support an activity cycle with
a period of 8 − 9 years. Again, the coronal changes over the cycle resemble the solar behavior.
Online material
Appendix A: Observation log and applied conversion factors
Observation log of data used in this publication.
Conversion factors from APEC models in XSPEC/PIMMS.
De la Calle (2010), http://xmm.esac.esa.int
Acknowledgments
This work is based on observations obtained with XMM-Newton, an ESA science mission with instruments and contributions directly funded by ESA Member States and the USA (NASA). J.R. acknowledges support from DLR under 50QR0803.
References
- Arnaud, K. A. 1996, in Astronomical Data Analysis Software and Systems V, ed. G. H. Jacoby, & J. Barnes (San Francisco: ASP), ASP Conf. Ser., 101, 17 [Google Scholar]
- Ayres, T. R. 2009, ApJ, 696, 1931 [NASA ADS] [CrossRef] [Google Scholar]
- Baliunas, S. L., Donahue, R. A., Soon, W. H., et al. 1995, ApJ, 438, 269 [NASA ADS] [CrossRef] [Google Scholar]
- Barnes, S. A. 2007, ApJ, 669, 1167 [NASA ADS] [CrossRef] [Google Scholar]
- Buccino, A. P., & Mauas, P. J. D. 2008, A&A, 483, 903 [NASA ADS] [CrossRef] [EDP Sciences] [Google Scholar]
- DeWarf, L. E., Datin, K. M., & Guinan, E. F. 2010, ApJ, 722, 343 [NASA ADS] [CrossRef] [Google Scholar]
- Donahue, R. A., Saar, S. H., & Baliunas, S. L. 1996, ApJ, 466, 384 [NASA ADS] [CrossRef] [Google Scholar]
- Epstein, C. R., & Pinsonneault, M. H. 2012, ApJ, submitted [arXiv:1203.1618v1] [Google Scholar]
- Favata, F., Micela, G., Orlando, S., et al. 2008, A&A, 490, 1121 [NASA ADS] [CrossRef] [EDP Sciences] [Google Scholar]
- Flannery, B. P., & Ayres, T. R. 1978, ApJ, 221, 175 [NASA ADS] [CrossRef] [Google Scholar]
- Golub, L., Harnden, Jr., F. R., Pallavicini, R., Rosner, R., & Vaiana, G. S. 1982, ApJ, 253, 242 [NASA ADS] [CrossRef] [Google Scholar]
- Grevesse, N., & Sauval, A. J. 1998, Space Sci. Rev., 85, 161 [NASA ADS] [CrossRef] [Google Scholar]
- Hall, J. C., Lockwood, G. W., & Skiff, B. A. 2007, AJ, 133, 862 [NASA ADS] [CrossRef] [Google Scholar]
- Hempelmann, A., Robrade, J., Schmitt, J. H. M. M., et al. 2006, A&A, 460, 261 [NASA ADS] [CrossRef] [EDP Sciences] [Google Scholar]
- Hempelmann, A., Schmitt, J. H. M. M., Baliunas, S. L., & Donahue, R. A. 2003, A&A, 406, L39 [NASA ADS] [CrossRef] [EDP Sciences] [Google Scholar]
- Henry, T. J., Soderblom, D. R., Donahue, R. A., & Baliunas, S. L. 1996, AJ, 111, 439 [NASA ADS] [CrossRef] [Google Scholar]
- Judge, P. G., Solomon, S. C., & Ayres, T. R. 2003, ApJ, 593, 534 [NASA ADS] [CrossRef] [Google Scholar]
- Kervella, P., Thévenin, F., Ségransan, D., et al. 2003, A&A, 404, 1087 [NASA ADS] [CrossRef] [EDP Sciences] [Google Scholar]
- Kervella, P., Mérand, A., Pichon, B., et al. 2008, A&A, 488, 667 [NASA ADS] [CrossRef] [EDP Sciences] [Google Scholar]
- Lean, J. 1997, ARA&A, 35, 33 [NASA ADS] [CrossRef] [Google Scholar]
- Orlando, S., Peres, G., & Reale, F. 2001, ApJ, 560, 499 [NASA ADS] [CrossRef] [Google Scholar]
- Peres, G., Orlando, S., Reale, F., Rosner, R., & Hudson, H. 2000, ApJ, 528, 537 [NASA ADS] [CrossRef] [Google Scholar]
- Poppenhäger, K., Robrade, J., Schmitt, J. H. M. M., & Hall, J. C. 2009, A&A, 508, 1417 [NASA ADS] [CrossRef] [EDP Sciences] [Google Scholar]
- Raassen, A. J. J., Ness, J.-U., Mewe, R., et al. 2003, A&A, 400, 671 [NASA ADS] [CrossRef] [EDP Sciences] [Google Scholar]
- Robrade, J., & Schmitt, J. H. M. M. 2005, A&A, 435, 1073 [NASA ADS] [CrossRef] [EDP Sciences] [Google Scholar]
- Robrade, J., Schmitt, J. H. M. M., & Hempelmann, A. 2007, Mem. Soc. Astron. Ital., 78, 311 [Google Scholar]
- Robrade, J., Schmitt, J. H. M. M., & Favata, F. 2008, A&A, 486, 995 [NASA ADS] [CrossRef] [EDP Sciences] [Google Scholar]
- Schmitt, J. H. M. M. 1997, A&A, 318, 215 [NASA ADS] [Google Scholar]
- Smith, R. K., Brickhouse, N. S., Liedahl, D. A., & Raymond, J. C. 2001, ApJ, 556, L91 [NASA ADS] [CrossRef] [Google Scholar]
All Tables
Stellar and X-ray cycle properties (0.2−2.0 keV) of the analyzed stars; brackets denote literature values, log LX in [erg s-1].
All Figures
|
Fig. 1 MOS1 images of 61 Cyg taken in 2006 (left) and 2009 (right) at about activity minimum and maximum for 61 Cyg A. Exposure times are similar and an identical linear brightness scaling is used. |
| In the text | |
|
Fig. 2 MOS1 image of α Centauri A/B obtained in 2003, source regions (black) and control regions (red/blue) are overplotted. |
| In the text | |
|
Fig. 3 X-ray light curves of 61 Cyg A (top) and 61 Cyg B (bottom) during the XMM monitoring, merged MOS data. |
| In the text | |
|
Fig. 4 Top: X-ray light curves of α Cen A from PN (black) and MOS1 (red). Bottom: α Cen B (merged MOS) during the XMM monitoring. |
| In the text | |
|
Fig. 5 Strongest X-ray flares from 61 Cyg B (top), 61 Cyg A (middle), and α Cen B (bottom) observed during the XMM campaign; PN data in the 0.2 − 0.5 (black), 0.5 − 0.8 (scaled, blue), and 0.8 − 5.0 keV (scaled, red) energy band. |
| In the text | |
|
Fig. 6 X-ray activity cycle of the K5 star 61 Cyg A as observed with XMM-Newton. |
| In the text | |
|
Fig. 7 X-ray activity of the K7 star 61 Cyg B observed with XMM-Newton; so far no cyclic long-term trend is present. |
| In the text | |
|
Fig. 8 X-ray activity of α Cen A (likely cyclic) and α Cen B (cyclic) as observed with XMM/MOS1 (A) and XMM/EPIC (B). |
| In the text | |
|
Fig. 9 PN spectra of 61 Cyg A at about maximum (black, 10/2009) and minimum (red, 10/2006) coronal activity with spectral models. |
| In the text | |
Current usage metrics show cumulative count of Article Views (full-text article views including HTML views, PDF and ePub downloads, according to the available data) and Abstracts Views on Vision4Press platform.
Data correspond to usage on the plateform after 2015. The current usage metrics is available 48-96 hours after online publication and is updated daily on week days.
Initial download of the metrics may take a while.