| Issue |
A&A
Volume 525, January 2011
|
|
|---|---|---|
| Article Number | A123 | |
| Number of page(s) | 5 | |
| Section | Stellar structure and evolution | |
| DOI | https://doi.org/10.1051/0004-6361/201015392 | |
| Published online | 07 December 2010 | |
Research Note
Resolving the L/T transition binary SDSS J2052-1609 AB⋆
1
Max-Planck-Institut für Astronomie,
Königstuhl 17,
69117
Heidelberg,
Germany
e-mail: stumpf@mpia.de
2
Department of Physics and Astronomy, State University of New
York, Stony Brook,
NY
11794-3800,
USA
e-mail: geissler@astro.sunysb.edu
3
Centro de Astrobiología, INTA-CSIC, PO Box 78, 28691, Villanueva
de la Cañada, Madrid,
Spain
Received:
14
July
2010
Accepted:
25
September
2010
Context. Binaries provide empirically derived key constraints for star formation theories, including the overall binary fraction, mass ratio distribution, and the separation distribution. They play crucial roles in calibrating the output of theoretical models, such as absolute magnitudes, colors, and effective temperature depending on mass, metallicity, and age.
Aims. We present first results of our ongoing high-resolution imaging survey of late type brown dwarfs. The survey aims at resolving tight brown dwarf binary systems to better constrain the T dwarf binary fraction. We intend to follow up on the individual binaries to determine orbital parameters.
Methods. Using NACO at the VLT, we performed AO-assisted near-infrared observations of SDSS J2052-1609. High-spatial resolution images of the T1 dwarf were obtained in H and KS filters.
Results. We resolved SDSS J2052-1609 into a binary system with a
separation of 0.1009 ± 0.001″. Archival data from HST/NICMOS taken one year before our
observations proves the components are co-moving. Using the flux ratio between the
components we infer J, H, and
KS magnitudes for the resolved system. From the near-IR
colors, we estimate spectral types of T1  for component A and T2.5 ± 1 for component B. A first estimate of the total system mass
yields Mtot ≥ 78 MJup, when
assuming a circular orbit.
for component A and T2.5 ± 1 for component B. A first estimate of the total system mass
yields Mtot ≥ 78 MJup, when
assuming a circular orbit.
Key words: stars: low-mass / brown dwarfs / stars: individual: SDSS J2052-1609 AB
Based on observations collected at the European Southern Observatory, Paranal, Chile, under program 083.C-0305(A). This work is partly based on observations made with the NASA/ESA Hubble Space Telescope, obtained at the Space Telescope Science Institute (STScI) and is associated with program GO-11136. STScI is operated by the Association of Universities for Research in Astronomy, Inc., under NASA contract NAS 5-26555.
© ESO, 2010
1. Introduction
Observational studies of binaries provide the key to assessing fundamental astrophysical parameters such as mass, radius, or density of compact objects for a wide range of astronomical objects ranging from asteroids to brown dwarfs and stars. For brown dwarfs, the continuous cooling with increasing age results in a degeneracy of the mass-luminosity relation; therefore, for a brown dwarf of unknown age, dynamical mass estimates based on the determination of orbital parameters of a binary provide the only precise means to derive masses.
After the discovery of the first binary brown dwarfs (Martín et al. 1999a,b), systematic surveys have led to the discovery of more than 70 brown dwarfs in binary or multiple systems (e.g., Bouy et al. 2003; Burgasser et al. 2003; Gizis et al. 2003). Astrometric follow-up observations of some of the shorter period binaries provided first system-mass estimates (e.g. Bouy et al. 2004; Konopacky et al. 2010) and revealed that mass-luminosity predictions based on theoretical evolutionary models for brown dwarfs still needed to be calibrated against observations.
Binaries have also been invoked to explain spectral and flux peculiarities observed in brown dwarfs at the transition between L and T dwarfs. Burgasser et al. (2006b) find a higher incident of binaries among L/T transition objects compared to dwarfs of earlier or later spectral types, and they suggest that spectral features of several L/T transition brown dwarfs could be explained by a superposition of spectra of a mid to late L and a T dwarf. Meanwhile, Goldman et al. (2008) conclude that the larger binary fraction among L/T brown dwarfs is not statistically significant and that a much larger observation sample is required.
Liu et al. (2006) reported the first detection of a flux ratio reversal between primary and secondary in a T dwarf binary in the J-band. Several more flux reversal L/T transition binaries have been identified in the meantime, supporting the idea of this so-called “crypto-binarity” (see e.g., Looper et al. 2008, and references therein; Stumpf et al. 2010). As a result, binaries composed of a late L dwarf and an early T dwarf could nicely explain both the observed near infrared spectral energy distribution and the spectral characteristics of L/T transition dwarfs.
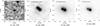 |
Fig. 1 Timeline for the observations of SDSS J2052-1609 AB. The orientation is the same for all images. The 2MASS image shows the unresolved system, and the circle indicates the 4.8″ region around the target in which no other object is visible. The object in the northwest corner of the image is the PSF reference object 2MASS J205234-160913. The HST/NICMOS and VLT/NACO images show the resolved system where SDSS J2052-1609 B is the component northeast of SDSS J2052-1609 A. |
As part of a high-resolution near-IR imaging survey, which had the aim of finding tight T dwarf binaries, we observed SDSS J205235.31-160929.8 (hereafter SDSS J2052-1609) and resolved it into a new close L/T transition binary system. Originally, SDSS J2052-1609 was identified as an apparent single object in an SDSS survey by Chiu et al. (2006) and classified as a T1 ± 1 dwarf. Furthermore, SDSS J2052-1609 has a measured proper motion of μ = 0.483 ± 0.022 arcsec/yr (Faherty 2010, in prep.; see Burgasser et al. 2010). Just recently, Burgasser et al. (2010) has identified SDSS J2052-1609 as a binary candidate using a spectral template fitting technique. Subsequently it was ranked as a strong binary candidate, since the best-fit composite spectrum returned a much better fit than any single dwarf template. SDSS J2052-1609 was best fitted by a composite spectrum of the L7 dwarf SDSS J115553.86+055957.5 (hereafter SDSS J1155-0559, Knapp et al. 2004) and the T2 dwarf 2MASS J11220826-3512363 (hereafter 2MASS J1122-3512, Tinney et al. 2005), and Burgasser et al. (2010) estimated average component types of L7.5 ± 0.6 and T2 ± 0.2 for the SDSS J2052-1609 AB system.
Here we present the observations that resolved SDSS J2052-1609 AB using NACO at the Very Large Telescope (VLT).
2. Observation and data reduction
2.1. NACO
The near-infrared imaging observations of the T1 dwarf SDSS J2052-1609 were obtained with NACO at the Very Large Telescope (VLT) on Cerro Paranal. The NACO system provides high-resolution AO - assisted imaging in the near-infrared at an 8-m class telescope. The observations were carried out in service mode as a part of our T dwarf high-resolution imaging campaign. SDSS J2052-1609 was observed on June 19, 2009 in H (1.65 μm) and KS (2.15 μm) broad-band filters using the CONICA S27 camera. The S27 camera provides a field of view (FoV) of 28″ × 28″ and a pixel scale of 0.0271″. For AO correction, the wavefront sensing was performed on a reference source chosen from the GSC-II (V2.2.01). The star S3313312149 has R = 12.85 mag and is 37.3″ away from SDSS J2052-1609. During the observations the target was at a mean airmass of 1.148 in H and 1.104 in KS, with average seeing conditions between 0.8″ in H and 0.6″ in KS. The observations were executed using an 8-point dither pattern to allow for sky subtraction and bad pixel correction, which resulted in total integration times of 1200 s in H-band and 960 s in KS-band. Standard data reduction steps such as flat-fielding, sky subtraction, and bad pixel corrections were performed before averaging the eight dither positions with the Eclipse jitter (Devillard 1997) software package. The final reduced NACO images of SDSS J2052-1609 AB are shown in Fig. 1 and represent the detection images of the resolved system.
For determining the relative photometry (flux ratio) and astrometry (separation and position angle (PA)) of the new system, we used the IDL - based simultaneous PSF - fitting algorithm from Bouy et al. (2003), adapted to the VLT/NACO data. As PSF reference star, we used the nearby point source 2MASS J205234-160913, which was observed in the same FoV as our target, hence under the same observing conditions. To determine the statistical error of this fit, the algorithm was also applied to each individually reduced image. Finally the results per filter were averaged, and the uncertainties were calculated from the standard deviation. To account for the systematic errors an uncertainty of 1% for the pixel scale and 0.4° for the orientation (e.g. Köhler 2008; Eggenberger et al. 2007) was added at the end.
Photometric properties of the resolved SDSS2052-1609 AB system.
2.2. HST and 2MASS
After resolving SDSS J2052-1609 as a candidate binary, we checked the 2MASS and HST data archives for previous epoch data. We downloaded the available 2MASS J, H, and KS imaging data taken on June 1, 1999. The Two Micron All-Sky Survey provides near-infrared imaging data with a pixel scale of 1″. Since SDSS J2052-1609 has a measured proper motion of 0.483 arcsec/yr, the dwarf should have moved by approximately 4.8″ during the last 10 years, corresponding to ~4.8 pixel in the 2MASS image. The 2MASS images show no object around SDSS J2052-1609 within a radius of ~5″.
The HST archive proved to be more fruitful. NICMOS imaging observation of SDSS J2052-1609 AB have been obtained under program GO 11136 (PI: M. Liu). The observation were carried out on June 24, 2008 and used the NICMOS1 (NIC1) camera with an FoV of 11″ × 11″ and a pixel scale of 0.043″. Observations of SDSS J2052-1609 AB are available in several filters. Here we used the F110W and F170M filters, with total integration times of 12 s and 60 s, respectively. The telescope orientation angle during all observations was –27.9068° (E of N).
The data analysis is based on the pipeline-reduced frames provided by the HST archive. To derive the magnitudes from the HST/NIC1 images, we applied aperture photometry to measure the total flux of the system, since the two components of the binary were too tight to derive their absolute photometry separately. With IDL-based routines, the count rate within an aperture of 11.5 pixel was measured, corrected to a nominal infinite aperture, and converted into the “Arizona” Vega photometric system (Table 1), using the photometric keywords and flux zero points provided on the STScI webpage1.
Similar to the VLT/NACO data, we applied the PSF - fitting algorithm from Bouy et al. (2003) to derive the astrometric parameters of the binary, as well as the flux ratio of the two components. This time we built and used a library of 6 reference PSFs: one TinyTim synthetic PSF and five natural PSFs from other HST/NICMOS programs that targeted brown dwarfs of similar spectral types (L7 - T1.5) in the corresponding filters (GO 10143 and 10879, PI: I. Reid). For a precise measurement of the separation, PA, and flux ratio, the algorithm was used on each of the 4 images per filter. The final results are the average per filter of the individual results, and the error was calculated from the standard deviation.
3. Results
3.1. Photometry
Table 1 lists the flux ratio and the corresponding magnitude difference obtained from the binary fitting procedure. For the H and KS filter, the 2MASS magnitudes of the combined system are given in column “A + B”, while the aperture photometry result is listed for the NICMOS filters. Individual magnitudes for the two components were then calculated from these system magnitudes using the flux ratio determined during the binary fitting procedure. To estimate the individual J-band magnitudes of the components in the 2MASS system, we applied the relation defined by Burgasser et al. (2006b). With it, the NICMOS F110W and F170M magnitudes are transformed into MKO J- and H-band magnitudes. Afterwards, the MKO J − H colors were transformed into the 2MASS system2 to calculate the 2MASS J-band magnitudes (given in bold in Table 1). For comparison, the derived J-band magnitude of the unresolved system (J = 16.30 ± 0.12 mag) is, within its errors, in very good agreement to the published 2MASS magnitude (J = 16.33 ± 0.12 mag). Finally, the given J-band flux ratio was derived from the separately transformed component magnitudes.
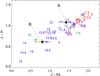 |
Fig. 2 Location of SDSS J2052-1609 A and B in the J − KS vs. J − H plane relative to known dwarfs from the DwarfArchives. The numbers indicate the individual spectral types from 7 = L7 to 14.5 = T4.5. The two green numbers indicate the location of SDSS J1155+0559 (L7.5) and SDSS J1122-3512 (T2), the two best-fit spectral composite components derived by Burgasser et al. (2010). |
3.2. Spectral type and distance
The derived colors of the binary components are given in Table 1. A comparison to mean JHKS colors of L and T dwarfs, calculated from the dwarfs listed at the Dwarf Archives3 (provided in the 2MASS photometric system) shows good agreement with spectral types of T0 - T1 for component A and spectral types of T2 - T3 for the B component (see also Fig. 2 for illustration). An additional comparison with the average J − KS colors vs. SpT in Table 5 of Faherty et al. (2009) yields the same result. In fact, the colors of SDSS J2052-1609 A are almost identical to the colors of SDSSp J083717.22-000018.3 (hereafter SDSS J0837-0000: J − H = 1.11 ± 0.28 mag, H − KS = 0.31 ± 0.23 mag, J − KS = 1.43 ± 0.26 mag), which has an assigned optical SpT of T0 (Kirkpatrick et al. 2008) and T1 in the near-IR (Burgasser et al. 2006a). A different approach to estimating the spectral types was done using the SpT - NICMOS color relation given in Burgasser et al. (2006b). For the B component, the calculation yields a spectral type of T2, while the spectral type is roughly T1 for component A. Thus, these estimated spectral types are in good agreement with the spectral types yielded by the JHKS color comparison.
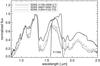 |
Fig. 3 Comparison of the flux distribution in the NICMOS/NIC1 F170M filter bandpass between a blue L7, a T0, and the T2 spectral standard. All spectra are normalized to the peak flux in the 1.0–1.3 μm range. |
Estimated distances of SDSS J2052-1609 AB in parsec.
and T2.5 ± 1 for SDSS J2052-1609 A and B, respectively, in which the larger uncertainty of the A component accounts for the still unexplained large Δ F170M mag of the components. Only resolved spectroscopy of the system components can unambiguously determine their spectral types.
Using the approximate spectral types, we can estimate the distance by employing the relation between absolute magnitude and spectral type from Looper et al. (2008). While the unresolved system had a photometric distance of 22 ± 1.7 pc, the resolved system will be farther away. For each of the individual components, we calculated the distance based on the H and KS magnitudes (see Table 2), and the uncertainties were derived from the photometric, as well as the absolute magnitude vs. SpT relation uncertainties. Assuming spectral types T1 and T2 for SDSS J2052-1609 A and B, we derived an average distance of 31.8 ± 2.5 pc for the binary system. Given the large uncertainty in the spectral type of component A, the average distance may increase up to 35.8 ± 3.4 pc if we assume a spectral type of L7.5.
3.3. System parameters
To derive the most reliable astrometric parameters from the 2008 HST/NICMOS and 2009 VLT/NACO observations, we only used the F110W and KS-band data to determine the first orbital parameters, since those two filters provide results that are notably better than the diffraction limit in these filters. In addition, the NACO observations in the KS-band are obtained at a much better Strehl ratio (with an average value of 69% compared to 54% in H-band). The derived separations and position angles are listed in Table 3. The observations are separated by a little bit less than one year. During this time the separation between the two components changed from 102.7 mas to 100.9 mas. With this total decrease of only 1.8 ± 1.5 mas, the separation between components A and B remained almost constant over the period of one year. This leads to the conclusion that the two components must be co-moving, since SDSS J2052-1609 AB has a reported proper motion of μ = 0.483 ± 0.022″/yr. In the same time interval, the position angle changed by 16.9° ± 0.5°.
Astrometric parameters for the SDSS J2052-1609 AB system.
4. Summary
VLT/NACO observations of SDSS J2052-1609 resolved the brown dwarf into a close binary system with a separation of only ~101.8 mas. Previous, unpublished observations conducted with HST/NICMOS confirmed the binary nature of the system and allowed for a first estimation of the total system mass. Assuming a circular orbit with an orbital period of 21 ± 1 years, we estimated a system mass of ≥78 MJup. The near-IR colors of the individual components suggest spectral types of T1 and T2.5 ± 1.
A divergent estimate of the spectral types comes from spectral binary fitting (Burgasser et al. 2010), suggesting spectral types of L7.5 for component A and and T2 for component B. Their best-fit composite template consists of two late types with unusually blue near-IR colors. Our obtained photometry agrees with both scenarios: a “normal” T + T dwarf binary or an L/T transition system consisting of a blue L and an early T dwarf.
Upcoming resolved spectroscopy with SINFONI at the VLT will finally determine the spectral types of the system.
Acknowledgments
M.B. Stumpf and W. Brandner acknowledge support by the DLR Verbundforschung project numbers 50 OR 0401 and 50 OR 0902. We would like to thank the anonymous referee for the constructive comments that helped to improve the paper. This publication makes use of data products from the Two Micron All Sky Survey, which is a joint project of the University of Massachusetts and the Infrared Processing and Analysis Center/California Institute of Technology, funded by the National Aeronautics and Space Administration and the National Science Foundation. This research has benefited from the M, L, and T dwarf compendium housed at DwarfArchives.org and maintained by Chris Gelino, Davy Kirkpatrick, and Adam Burgasser. This research has benefited from the SpeX Prism Spectral Libraries, maintained by Adam Burgasser at http://www.browndwarfs.org/spexprism.
References
- Bouy, H., Brandner, W., Martín, E. L., et al. 2003, AJ, 126, 1526 [NASA ADS] [CrossRef] [Google Scholar]
- Bouy, H., Duchêne, G., Köhler, R., et al. 2004, A&A, 423, 341 [NASA ADS] [CrossRef] [EDP Sciences] [Google Scholar]
- Burgasser, A. J., Kirkpatrick, J. D., Reid, I. N., et al. 2003, ApJ, 586, 512 [NASA ADS] [CrossRef] [Google Scholar]
- Burgasser, A. J., McElwain, M. W., Kirkpatrick, J. D., et al. 2004, AJ, 127, 2856 [NASA ADS] [CrossRef] [Google Scholar]
- Burgasser, A. J., Geballe, T. R., Leggett, S. K., Kirkpatrick, J. D., & Golimowski, D. A. 2006a, ApJ, 637, 1067 [NASA ADS] [CrossRef] [Google Scholar]
- Burgasser, A. J., Kirkpatrick, J. D., Cruz, K. L., et al. 2006b, ApJS, 166, 585 [NASA ADS] [CrossRef] [Google Scholar]
- Burgasser, A. J., Cruz, K. L., Cushing, M., et al. 2010, ApJ, 710, 1142 [NASA ADS] [CrossRef] [Google Scholar]
- Chiu, K., Fan, X., Leggett, S. K., et al. 2006, AJ, 131, 2722 [NASA ADS] [CrossRef] [Google Scholar]
- Devillard, N. 1997, The ESO Messenger, 87, 19 [Google Scholar]
- Eggenberger, A., Udry, S., Chauvin, G., et al. 2007, A&A, 474, 273 [NASA ADS] [CrossRef] [EDP Sciences] [Google Scholar]
- Faherty, J. K., Burgasser, A. J., Cruz, K. L., et al. 2009, AJ, 137, 1 [NASA ADS] [CrossRef] [Google Scholar]
- Fischer, D. A., & Marcy, G. W. 1992, ApJ, 396, 178 [NASA ADS] [CrossRef] [Google Scholar]
- Gizis, J. E., Reid, I. N., Knapp, G. R., et al. 2003, AJ, 125, 3302 [NASA ADS] [CrossRef] [Google Scholar]
- Goldman, B., Bouy, H., Zapatero Osorio, M. R., et al. 2008, A&A, 490, 763 [NASA ADS] [CrossRef] [EDP Sciences] [Google Scholar]
- Kirkpatrick, J. D., Cruz, K. L., Barman, T. S., et al. 2008, ApJ, 689, 1295 [NASA ADS] [CrossRef] [Google Scholar]
- Knapp, G. R., Leggett, S. K., Fan, X., et al. 2004, AJ, 127, 3553 [NASA ADS] [CrossRef] [Google Scholar]
- Köhler, R. 2008, J. Phys. Conf. Ser., 131, 012028 [Google Scholar]
- Konopacky, Q. M., Ghez, A. M., Barman, T. S., et al. 2010, ApJ, 711, 1087 [NASA ADS] [CrossRef] [Google Scholar]
- Liu, M. C., Leggett, S. K., Golimowski, D. A., et al. 2006, ApJ, 647, 1393 [NASA ADS] [CrossRef] [Google Scholar]
- Looper, D. L., Gelino, C. R., Burgasser, A. J., & Kirkpatrick, J. D. 2008, ApJ, 685, 1183 [NASA ADS] [CrossRef] [Google Scholar]
- Martín, E. L., Brandner, W., & Basri, G. 1999a, Science, 283, 1718 [NASA ADS] [CrossRef] [PubMed] [Google Scholar]
- Martín, E. L., Delfosse, X., Basri, G., et al. 1999b, AJ, 118, 2466 [NASA ADS] [CrossRef] [Google Scholar]
- Stumpf, M. B., Brandner, W., Bouy, H., Henning, T., & Hippler, S. 2010, A&A, 516, A37 [NASA ADS] [CrossRef] [EDP Sciences] [Google Scholar]
- Tinney, C. G., Burgasser, A. J., Kirkpatrick, J. D., & McElwain, M. W. 2005, AJ, 130, 2326 [NASA ADS] [CrossRef] [Google Scholar]
All Tables
All Figures
|
Fig. 1 Timeline for the observations of SDSS J2052-1609 AB. The orientation is the same for all images. The 2MASS image shows the unresolved system, and the circle indicates the 4.8″ region around the target in which no other object is visible. The object in the northwest corner of the image is the PSF reference object 2MASS J205234-160913. The HST/NICMOS and VLT/NACO images show the resolved system where SDSS J2052-1609 B is the component northeast of SDSS J2052-1609 A. |
| In the text | |
|
Fig. 2 Location of SDSS J2052-1609 A and B in the J − KS vs. J − H plane relative to known dwarfs from the DwarfArchives. The numbers indicate the individual spectral types from 7 = L7 to 14.5 = T4.5. The two green numbers indicate the location of SDSS J1155+0559 (L7.5) and SDSS J1122-3512 (T2), the two best-fit spectral composite components derived by Burgasser et al. (2010). |
| In the text | |
|
Fig. 3 Comparison of the flux distribution in the NICMOS/NIC1 F170M filter bandpass between a blue L7, a T0, and the T2 spectral standard. All spectra are normalized to the peak flux in the 1.0–1.3 μm range. |
| In the text | |
Current usage metrics show cumulative count of Article Views (full-text article views including HTML views, PDF and ePub downloads, according to the available data) and Abstracts Views on Vision4Press platform.
Data correspond to usage on the plateform after 2015. The current usage metrics is available 48-96 hours after online publication and is updated daily on week days.
Initial download of the metrics may take a while.