| Issue |
A&A
Volume 525, January 2011
|
|
|---|---|---|
| Article Number | A121 | |
| Number of page(s) | 11 | |
| Section | Interstellar and circumstellar matter | |
| DOI | https://doi.org/10.1051/0004-6361/201015355 | |
| Published online | 07 December 2010 | |
GSH 91.5+2–114: A large H i shell in the outer part of the Galaxy
1
Instituto de Astronomía y Física del Espacio (IAFE),
CC 67, Suc. 28, 1428
Buenos Aires,
Argentina
e-mail: This email address is being protected from spambots. You need JavaScript enabled to view it.
2
Département de physique, de génie physique et d’optique,
Université Laval, Québec, G1V 0A6
Canada, and Centre de recherche en astrophysique du
Québec (CRAQ), Canada
3
Instituto Argentino de Radioastronomía (IAR),
CC 5, 1894, Villa Elisa,
Argentina
Received:
7
July
2010
Accepted:
12
October
2010
Abstract
GSH 91.5 + 2−114 is a large H i shell located in the outer Galaxy at a kinematic distance of about 15 kpc. It was first identified in the Canadian Galactic Plane Survey (CGPS) by Pineault et al. (2002, ASP Conf. Ser., 276, 332) as being possibly associated with objects possessing infrared colors, which indicates strong stellar winds. The H i shell has no obvious continuum counterpart in the CGPS radio images at 408 and 1420 MHz or in the IRAS images. We found no evidence for early-type massive stars, most likely as a result of the large extinction that is expected for this large distance. An analysis of the energetics and of the main physical parameters of the H i shell shows that this shell is likely the result of the combined action of the stellar winds and supernova explosions of many stars. We investigate whether a number of slightly extended regions characterized by a thermal radio continuum and located near the periphery of the H i shell could be the result of star formation triggered by the expanding shell.
Key words: ISM: bubbles / ISM: kinematics and dynamics / ISM: structure / Galaxy: bulge
© ESO, 2010
1. Introduction
A massive star possessing a strong stellar wind (SW) can inject as much energy into the interstellar medium (ISM) during its lifetime as it does during the final supernova explosion. If the stellar spatial velocity with respect to the ambient ISM is not too large (i.e. <30 km s-1), the SW is expected to evacuate a large cavity around the star (called a stellar bubble) surrounded by a ring or shell of enhanced density. These structures have been observationally detected as optical and infrared (IR) nebulae around Wolf-Rayet (WR) and Of stars (Chu et al. 1983; Lozinskaya 1992).
The situation with respect to radio observations, reviewed by Cappa et al. (2003), has evolved considerably with the advent of large Galactic neutral hydrogen (H i) surveys, namely the Canadian Galactic Plane Survey (CGPS; Taylor et al. 2003), the Southern GPS (SGPS; McClure-Griffiths et al. 2005; Haverkorn et al. 2006) and the VLA (VGPS; Stil et al. 2006). These surveys at ~1 arcmin resolution have made it possible to identify and study the structure and dynamics of many neutral H i shells (McClure-Griffiths et al. 2000; Uyaniker & Kothes 2002; Stil & Irwin 2001; Stil et al. 2004). Interestingly enough, the large majority of shells detected by their neutral hydrogen emission have low inferred expansion velocities, typically less than or on the order of 10 km s-1 (Cappa et al. 2003).
In parallel to these developments on the observational scene, recent theoretical studies, building up on the initial work of Weaver et al. (1977) and others, have considerably increased our understanding of the interaction of stellar winds with their surrounding ISM. The effects of the different evolutionary phases and of a large peculiar motion of the star have been modeled in detail in a number of new studies (e.g., Arthur & Hoare 2006; Brighenti & D’Ercole 1995; van Buren & McCray 1988; Wilkin 1996, and references therein). Concerning the often observed low expansion velocities of ~10 km s-1, Cazzolato & Pineault (2005) have shown that velocity dispersion within the shell and the role of the local ISM background may significantly affect the appearance of an expanding H i shell in velocity space and thus its inferred parameters (in particular, mass and expansion velocity).
In the case of moderate-size shells, a puzzling aspect is the apparent lack of a radio continuum counterpart or of a candidate progenitor star (Normandeau et al. 2000; Stil & Irwin 2001; Stil et al. 2004; Cichowolski & Arnal 2004). This suggests that either one or several basic ingredients are missing in the predictions of the theory and/or that some detected H i shells are not real.
Increasing the sample of well studied H i shells is a first natural step in elucidating some of the current puzzles. In an attempt at diversifying the sample of known H i shells (consisting mostly of shells around objects known for their optically interesting features), Pineault et al. (2002) initiated a project aimed at discovering new SW source candidates by using first IRAS colors to extract potential candidates and then the CGPS database to look for a morphology indicative of a SW, i.e. shells, rings, bubbles, cavities, or voids. An obvious advantage of this procedure is that potential candidates suffer much less from the selection effects associated with optically chosen targets, for example, WR or Of stars, the distribution of which is severely biased by absorption. A positional coincidence between one or more candidates and a shell-like morphological structure is nevertheless not a proof of a physical association, and a detailed analysis is required before any firm conclusion can be drawn.
In this paper, we focus our attention on a very large (nearly 1 5 diameter) and symmetrical H i shell centered at (l, b) = (915, +20) and observed at a velocity1vlsr ≈ −114 km s-1, which was identified by Pineault et al. (2002). A flat rotation curve model for the Galaxy gives for the shell a distance d = 15 kpc, a galactocentric radius Rg = 17 kpc, a distance z ~ 525 pc from the Galactic plane, and a diameter D = 400 pc, placing it in the outermost part of the Galaxy.
This shell thus offers the opportunity to explore the environment of remote regions of the Galaxy where many physical parameters such as metallicity, density, smaller or negligible perturbations from spiral arms, greatly differ from those in nearby regions of the Galaxy. Despite this remoteness, there is evidence that star formation in the outer Galaxy may be common, as shown by the discovery of a considerable number of embedded star clusters in molecular clouds up to galactocentric radii Rg ≈ 17 kpc (Santos et al. 2000; Snell et al. 2002). A particularly interesting case is the suggestion by Kobayashi et al. (2008) that star formation in Digel’s Cloud 2 (Rg ≈ 19 kpc) could have been triggered by the huge supernova remnant GSH 138-01-94 previously discovered by Stil & Irwin (2001). These huge shells imply that massive stars form in the outer Galaxy, emphasizing the importance of studying these objects. At these large distances, optical obscuration is very severe, so that one has to resort to radio or infrared observations.
The plan of the paper is as follows. In Sect. 2 we describe the observational data used, in Sect. 3 we briefly review the initial data used by Pineault et al. (2002) and present detailed neutral hydrogen (H i) and continuum images of the object. The results are analyzed and discussed in Sect. 4. Section 5 is a summary of the main conclusions.
2. Observational data
Radio continuum data at 408 and 1420 MHz and 21-cm spectral line data were obtained at DRAO as part of the CGPS survey (Taylor et al. 2003). A detailed description of the data processing routines can be found in Willis (1999). At the position of GSH 91.5+2−114, the continuum images have a resolution of  and
and  , and a measured noise of 0.082 K and 0.75 K, at 1420 and 408 MHz respectively. Parameters relevant to the H i data are given in Table 1. High-resolution-processed (HIRES) (Fowler & Aumann 1994) IRAS images produced at the Infrared Processing and Analysis Center (IPAC)2 were also used. The images used are the result of 20 iterations of the algorithm, giving an approximate resolution ranging from about
  to 2′. At the position of GSH 91.5+2−114, the 60 micron image has an approximate resolution of 1′.
Observational parameters for the H i data.
3. Results
3.1. The initial data
Figure 1 shows an H i image averaged between v = −110.3 and −116.9 km s-1, showing the large H i shell discovered by Pineault et al. (2002) with the four IRAS sources which they suggested might be physically associated.
The interior of the shell seems to have been entirely cleared of neutral hydrogen. Though the shell is generally quite well defined, its northern part is essentially absent, or at least it does not show a clear outline. Indeed, the general morphology suggests that the shell is open to the north in a direction away from the Galactic plane. Indicated in Fig. 1 are two filaments (denoted A and B) that could be related to the shell, forming an incomplete northern border. A closer inspection of the figure also shows that the H i shell is far from homogeneous. Moreover, there are many quite well defined cavities visible that are projected onto the H i ring.
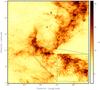 |
Fig. 1 H i emission distribution averaged between −110.3 and −116.9 km s-1. The plus symbols indicate the position of the four DWCL source candidates, IRAS 21147+5016, IRAS 21106+5013, IRAS 21093+4959, and IRAS 21041+5052. The inset is a close-up view of the region near IRAS 21147+5016. |
The position of the four IRAS sources is indicated by plus symbols in Fig. 1. Two of the sources are seen projected well inside the shell structure, while IRAS 21093+4959 is located between filaments A and B. IRAS 21147+5016 is seen projected onto a smaller H i cavity centered at (l, b) = (921, 09) and located on the larger shell structure. The inset in the bottom right corner of Fig. 1 shows this region in more detail. Table 2 shows the IR colors of these four sources.
Parameters of the DWCL source candidates.
A comparison of these colors with the values given by Cohen (1995) in his Table 43 allows us to conclude that the IRAS sources are probably dust shells related to WC8-9 stars (dubbed dusty late-type WR or DWCL by Cohen). In their preliminary analysis of the then-incomplete CGPS, Pineault et al. (2002) had concluded that the surface distribution of the stellar wind candidates chosen on the basis of their IR colors was on the average of 1 source per 10 square degree area. Note that there are no other sources with the same properties in the entire field shown in Fig. 1. The position of the four candidate sources inside or near the boundary of the H i shell prompted a more detailed analysis.
3.2. Single-channel H i 21-cm data
Figure 2 shows the H i distribution in the LSR velocity range from −107.0 to −121.0 km s-1. The original images were smoothed to a 3-arcmin resolution to increase the signal-to-noise ratio. At v = −109.5 km s-1 the shell, which we shall now refer to as GSH 91.5+2−114, is clearly observed and it is well defined down to v = −118.5 km s-1. This structure is centered at (l, b) = (915, +2°) and has an angular size of about 15.
A limited region of bright centrally-located emission at –107.0 km s-1 could form part of the so-called receding cap, implying an expansion velocity of some 7 km s-1. In an ideal situation, one would then expect to find an approaching cap at a velocity of about –121 km s-1. No obvious excess H i emission is seen near this velocity. The lack of confusing emission at this velocity suggests that either expansion on the near side took place in an extremely low-density medium, making its detection below the sensitivity of the telescope, or that the shell was very incomplete and nearly absent on the near side.
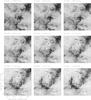 |
Fig. 2 CGPS gray-scale images showing the H i distribution in the LSR velocity range from −107.0 to −121.0 km s-1. Velocity resolution is 1.3 km s-1, and spatial resolution is 3′. The LSR central velocity of each image is indicated in the top left corner. The star symbols indicate the position of the four DWCL source candidates. For all images, darker shading indicates higher brightness. |
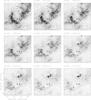 |
Fig. 2 continued. |
3.3. Radio continuum and infrared data
Pineault et al. (2002) had already noted that no continuum (radio or IR) counterpart seemed to be present. Figure 3 shows the CGPS 1420 MHz radio continuum and 60 μm HIRES images of the same field of view as the preceding figures. Discrete point sources have been removed from the radio continuum image and the shadings chosen so as to highlight the low-level emission centered on GSH 91.5+2−114. The relatively bright and large incomplete shell-like structure to the west of GSH 91.5+2−114, near  is the H ii complex BG 2107+49 discussed by van der Werf & Higgs (1990) and located at a kinematical distance of 10 kpc. The circles delineate the approximate inner and outer boundaries of the H i shell, revealing that there is no obvious radio continuum or infrared emission related to GSH 91.5+2−114.
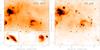 |
Fig. 3 1420 MHz radio continuum and 60 μm images from the CGPS survey. Resolution for both is about 1′. Point-like sources have been removed from the radio continuum image. Circles indicate the approximate inner and outer boundary of the H i shell seen in Fig. 1. The two insets at the bottom of the radio image show a close-up view of G91.56+0.97 and G92.24+1.57 (point-like sources included, see text). |
The faint radio continuum emission seems to consist of filaments more or less aligned perpendicular to the Galactic plane, especially toward the north of the image, above the opening in the H i shell. The diffuse emission is more or less distributed homogeneously over the northern part of the image, although there appears to be a slight excess of emission within the shell boundary, in particular in its northernmost part. In the south, the location where radio emission becomes fainter corresponds roughly with the H i shell boundary.
Two interesting and slightly extended (6′−8′) structures (named G91.56+0.97 and G92.24+1.57) are seen near the inner boundary of the H i shell. A close-up view of these structures is presented as insets at the bottom of Fig. 3. These objects are discussed in more detail in Sect. 4.4.
We also examined the CGPS polarization images (percentage polarization and position angle) for this field and did not find any evidence for highly structured emission associated with the shell or any of the slightly extended structures discussed above. This agrees with the findings of Uyaniker et al. (2003), who concluded that all polarization structures observable in the CGPS are generated and/or Faraday rotated closer than 2.5 kpc.
4. Discussion
Some of the questions we shall try to answer are: can the observed H i shell be a stellar wind shell formed by the winds from one or more of the four candidate DWCL sources? If not, what are the alternative shell-formation scenarios? Was the smaller H i cavity (the one embedded in the wall of the larger H i shell) caused by IRAS 21147+5016 and, if so, could IRAS 21147+5016 represent a case of triggered star formation? In this section we shall explore different possible formation scenarios based on the determined size, mass, age, and energy involved. From here on we assume a distance of 15 ± 3 kpc for GSH 91.5+2−114, as suggested initially by Pineault et al. (2002).
We note however that this distance is likely an upper limit. Indeed, using a new method (Foster & MacWilliams 2006) based on H i column densities for the determination of distances within the disk of the Galaxy, Arvidsson et al. (2009) obtained a new distance for the outer Galaxy H ii region CTB 102. As this object is at  ,
,  , i.e. very nearly along the same line of sight as our shell, we can use Arvidsson et al. (2009)’s Fig. 5 to extrapolate their velocity-distance relation to obtain a distance estimate of approximately 11.5 kpc for GSH 91.5+2−114. This slightly lower distance still corresponds to an object well in the outer Galaxy at Rg ≈ 14.5 kpc and z ~ 400 pc. Whenever possible, we shall show the distance dependence of simple parameters by defining d15 = d/15 kpc.
4.1. Parameters of the H i shell
Error estimates for all the parameters are based on our ability to estimate the spectral extent of the shell in velocity space, its spatial extent, and distance.
The H i ring is clearly observed over some 14 km s-1. Following the procedure described by Pineault (1998), we derive a mass for the shell of  . Note that this value agrees with that obtained using Heiles (1984) equation for the mass swept up by a shell, namely
  which, taking Rsh = (200 ± 30)d15 pc, gives
  . Using our determined value for the mass and considering a spherical cavity, we obtain for the initial (i.e. before the gas was swept up in the shell) neutral gas particle density
  cm-3.
cm-3.
Adopting an expansion velocity equal to half the velocity interval where the structure is observed, vexp = 7 ± 2 km s-1, we obtain for the kinetic energy stored in the expanding shell 
 erg. The kinematic age of the shell is given by t(Myr) = α Rsh(pc)/vexp(km s-1), where α = 0.25 for a radiative SNR shell and α = 0.6 for a supershell. We obtain t = (7 ± 2)d15 Myr (α = 0.25) and t = (17 ± 5)d15 Myr (α = 0.6). With these determined observational parameters as a basis, we are now in a position to discuss the different formation scenarios for GSH 91.5+2−114.
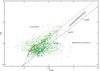 |
Fig. 4 (H − K,J − H) color–color diagram of the 2MASS sources found in a 400′′ circular area centered at (l,b) = (91 |
4.2. Formation scenarios for the H i shell
In this section we assume for simplicity that the DWCL objects are located at the same distance as GSH 91.5+2−114, namely 15 kpc. Of course we cannot rule out that there may be no physical association at all and that what we observe is simply a pure line-of-sight coincidence.
4.2.1. The action of the DWCL source candidates
The long kinematic timescale of 17 Myr, if GSH 91.5+2−114 has a SW origin, suggests that more than one generation of massive stars should be involved and/or that contributions from one or more SN explosion are to be expected. Nevertheless, as a first step, it is of interest to estimate the contribution that the winds of one or more of the DWCL candidates could make to the formation of this large H i shell.
We first calculated the total integrated IR luminosity of each candidate. The derived parameters are shown in Table 2. If, following Cohen (1995), we assume the objects to be WC8-9 stars, then their total luminosity is about (Crowther 2007) L/L⊙ = 1.1 × 10⁵. The IR luminosities thus represent only about from 3 to 10% of the total stellar luminosity.
Ignoring any intrinsic absorption by dust surrounding DWCL stars, we may ask whether a WC8-9 star would be easily identified at a distance of 15 kpc along the line of sight to GSH 91.5+2−114. From the foreground H i column density and distance we can calculate typical values for the extinction and reddening of stars. The measured foreground H i column density is about 1.1 × 1022 cm-2, which corresponds to a reddening of EB−V = 2.3 mag (EB−V = NH I/4.8 × 1021 cm-2; Bohlin et al. 1978). This gives a visual absorption Av of 7.3 mag. Taking for the absolute magnitude of WC8-9 stars (Crowther 2007) Mv = −4.5, we obtain mv = 18.7. A star of this magnitude would clearly not stand out among field stars, although it would be detectable. In their study of GSH 90+03-99, Uyaniker & Kothes (2002) had estimated a visual extinction of 6.4 mag toward l ~ 90° and concluded that deep measurements were needed to detect early-type stars at a distance, for their object, of 13 kpc.
There are reasons however to believe that the value of absorption derived from the H i column density is a significant underestimate of the true value. As an alternative, we used the 2MASS Point Source Catalogue (Skrutskie et al. 2006) to produce a H − Ks vs. J − H diagram (Fig. 4). There are 1573 2MASS sources in a circular area centered at (l,b) = ( 917, 183) within a radius of 400 ′′. These sources are indicated by green dots in Fig. 4. The positions of the dereddened early-type main sequence and giant stars are indicated with blue and red solid lines, respectively. The blue and red dashed lines show the reddening curve for O9 V and M0 III stars, respectively. Thus, normally reddened main sequence stars lie between the two dashed lines. Because absorption is proportional to distance, we can infer that statistically the most distant sources have a visual absorption of about 13 mag along this direction in the Galaxy. Hence, as we are dealing with a structure located in the outer part of the Galaxy at about 15 kpc, it is likely that the visual absorption is significantly higher than 7.3 mag. If absorption is as high as 13 mag, the expected apparent magnitude of WC8-9 stars could be as faint as mv = 24.4. The higher absorption derived from the color–color diagram suggests the presence of molecular gas along the line of sight in this direction. It also makes the optical identification of any massive star at that distance even more problematic. Note that lowering the distance to 11.5 kpc only makes the above magnitudes brighter by 0.6 mag.
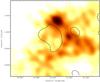 |
Fig. 5 H i emission distribution averaged between –46.0 and –49.3 km s-1. The black contour corresponds to the 8.5 K level of the 1420 MHz radio continuum emission. |
Next we estimate the energy injected by the stellar winds,  . Adopting (Crowther 2007) for a single WC8-9 a mass loss rate of Ṁ = 10-5 M⊙ yr-1, appropriate for a solar metallicity Z⊙, and a wind velocity of vw = 1500 km s-1, we obtain Ew = 2.25 × 1044 t(yr) erg. If the WC phase lasts ~105 yr, each star would impart Ew = 2.25 × 1049 erg to its local ISM during this phase. But only a fraction ϵ of this energy gets transferred to the gas. According to evolutionary models of interstellar bubbles, the expected energy conversion efficiency ϵ = Ekin/Ew is on the order of 0.2 or less (McCray 1983). Observationally, the values of ϵ derived from optical and radio observations can be as low as 0.02 (Cappa et al. 2003), indicating that there are cases where severe energetic losses may occur.
Furthermore, given the location of GSH 91.5+2−114 in the outer Galaxy, the effect of metallicity should be taken into account. Nugis & Lamers (2000) suggested that the mass-loss rate depends on metallicity Z as Ṁ ∝ Zm, with m = 0.5. The velocity of the wind is also lower at lower metallicity (Nugis & Lamers 2000). Stil & Irwin (2001) concluded that the wind energy Ew decreases by a factor of about 3 when Z decreases by a factor of 10 for stars with the same luminosity. Thus, for Z = 0.1 Z⊙, each WC8-9 star would simply inject Ew ~ 7.5 × 1048 erg in the ISM during the WC phase. This implies that even with a relatively high efficiency ϵ = 0.2, the injected kinetic energy is only Ekin = ϵ Ew = 1.5 × 1048 erg. Summarizing, neither for Z = Z⊙ nor for Z = 0.1 Z⊙ could the H i shell have been created only by the stellar winds of the DWCL sources in their WC phase. Even by considering a comparable contribution from the previous evolutionary phase of each star, the available kinetic energy falls considerably short of the observed shell kinetic energy 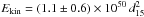 erg.
erg.
4.2.2. The action of unseen massive stars
We have failed in finding any massive star in the area. However we have seen in Sect. 4.2.1 that distance and absorption conspire to make even bright early-type stars inconspicuous. At a distance of 15 kpc and with an absorption of 7.3 mag, based on the H i column density, an O3V star (Mv = −6.0) would have mv = 17.2, whereas a B1V star (Mv = −3.2) would have mv = 20.0. For an absorption of 13 mag, derived from the 2MASS color–color diagram, the corresponding magnitudes would be 22.9 and 25.7, for an O3V and a B1V star respectively. As mentioned above, a shorter distance of 11.5 kpc leads to estimated magnitudes brighter by only 0.6 mag. Although one or more early-type star cannot be easily detected at the distance of GSH 91.5+2−114, we cannot rule out the presence of these stars and their possible role in forming the H i shell. Furthermore, given that massive stars evolve in a short time, the originating stars might have vanished a long time ago and be not observable any more.
If the origin of GSH 91.5+2−114 is indeed the action of many massive stars, from the estimated value of the kinetic energy of the shell (Ekin = (1.1 ± 0.6) × 1050 erg, see Sect. 4.1) we can estimate how many massive stars would have been needed to create it. Adopting mean stellar wind parameters for O-type stars (i.e. Ṁ = 2 × 10⁻⁶ M⊙ yr-1 and vw = 2000 km s-1, Mokiem et al. 2007) and considering that the main sequence phase lasts for at least 3 × 10⁶ yr, the injected wind stellar energy is about 1.4 × 1050 erg. Bearing in mind that the conversion efficiency is about or less than 0.2 and considering the possible effects of a lower metallicity environment, the energy released by the stellar winds should be greater that 5.5 × 1050 erg. Thus, at least four O-type stars were necessary to create GSH 91.5+2−114. In the case of a lower distance of 11.5 kpc, the energy released by the stellar winds should be greater than 3.2 × 1050 erg, implying that at least three O-type stars were required.
4.2.3. A supernova explosion
Uyaniker & Kothes (2002) proposed AN interesting procedure for setting various constraints on an SNR origin, which they applied to their H i shell and another one previously discovered by Stil & Irwin (2001). Their procedure essentially rests on the expression giving the maximum observable radius of an SNR before it merges with the ISM (Cioffi et al. 1988):
 where E0 is the explosion energy in units of 1051 erg, n0 the mean ambient particle density in cm-3, and Z the metallicity normalized to the solar value. The input parameters to the above equation are the observed radius and particle density, Rsh = 200 d15 pc and
  cm-3. The results for GSH 91.5+2−114 are shown as the last entry in Table 3, where the numerical values are for d = 15 kpc. The first two entries are identical to Table 2 of Uyaniker & Kothes (2002) (with the addition of two parameters and a slight change in notation for added clarity).
The column labelled  (Col. 5) gives the merging radius assuming a canonical value of
  for the explosion energy. As with the other two shells, the observed radius Rsh is about twice as large as the predicted merging radius , which means that the shell should have vanished well before reaching the observed radius. This implies that either E0 is larger and/or the object is closer. The column labelled
  (Col. 6) gives the energy required for Rmerge to be equal to the observed radius of the shell. The morphology of GSH 91.5+2−114 is clearly too regular and well defined to represent a merging shell so that the value of is a lower limit. The last column is the maximum distance GSH 91.5+2−114 would have to be in order to be the result of a single SN explosion with E0 = 1. This distance corresponds to a systemic velocity of about −52 km s-1 which, as is the case for the other two shells, is totally unrealistic, given the observed systemic velocity of −114 km s-1.
If we compare the three shells, we see that the first and last one are very similar in radius and mass, because they are virtually at the same distance and evolving in an ISM of comparable particle density. The second one, GSH90+03-99, is somewhat closer and appears to be located in a significantly denser medium. Nevertheless, as discussed by Uyaniker & Kothes (2002), neither of the three shells could have been caused by a single SN explosion. Furthermore, as emphasized by Uyaniker & Kothes (2002), this argument applies as well to a single O- or B-type stellar wind bubble. Using 11.5 kpc as the distance would only change and dmax by about 10% and  by about 40%, thus not altering the general conclusion.
Constraints on a single SNR origin.
4.3. Additional constraints from radio continuum emission
From Fig. 3 it is clear that there is no evidence of enhanced radio continuum emission associated with GSH 91.5+2−114. Although this absence is somewhat puzzling for H i shells associated with known optical objects such as WR or Of stars, it is less so here. The kinematic age of the shell could be as high as 17 Myr and massive O stars and early B stars could well have ended their lives. However, because of the large distance and large extinction involved, we cannot completely rule out the presence of one or more of these massive stars. This statement can however be made more precise.
Bellow we shall use the following parameters for the H i shell (note that 1′ is equivalent to 4.5 pc at a distance of 15 kpc): inner and outer radius, Ri = 160 pc, Ro = 200 pc, shell thickness ΔR = 40 pc and initial particle density no = 0.3 cm-3. These are average quantities because obviously the shell radii and thickness vary significantly with azimuthal angle. With these parameters, we deduce that the particle density within the shell is now ns = 2.6 × no = 0.8 cm-3. For simplicity, we shall neglect the presence of helium in the following simple estimates.
4.3.1. The simplest case: a homogeneous shell
We assume that an ionizing star is located at the center of the H i shell and ask to what extent the inner side of the H i shell should be ionized, assuming that negligible material is present inside the shell. This is the classical Strömgren sphere problem where, instead of integrating from 0 to some maximum radius Rm, we integrate from Ri to Rm: 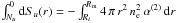 , where Su(r) is the rate of ionizing photons at distance r, Nu is the total number of ionizing photons emitted by the star, ne the electron number density (assumed equal to ns) and α(2) = 3.09 × 10⁻¹³ cm3 s-1 is the recombination coefficient excluding captures to the ground level. Solving for Rm, we obtain
  (1)If Rm > Ro, then the H i shell is fully ionized (and should not exist!) and some photons escape freely. For our parameters, ℛ = 0.19 Nu,47 pc, where Nu,47 is the ionizing photon rate in units of 1047 s-1. The total number Nu of UV ionizing photons also fixes the total observed flux density Sν at a given frequency and is given by (e.g., Rubin 1968; Chaisson 1976)
  (2)where T4 is the electron temperature in units of 104 K, νGHz = 1.42 the frequency in GHz and Sν is in Jy. Using T4 = 0.7 and dkpc = 15, we obtain S1.42 = 4.8 Nu,47 mJy. This estimate for Sν is an upper limit, because photons can escape through inhomogeneities of the shell (on scales smaller than the beam) or through the opening in the north.
Table 4 shows the results of these simple calculations for three different stellar types, chosen to illustrate different possibilities. Evidently the observations are totally incompatible with the presence of an O3V star (or any star with the same value of Nu) as the H i shell would be essentially totally ionized. In order for the neutral shell to be actually present, there would then have to be a substantial amount of ionized gas within Ri to absorb the ionizing photons. This goes against the canonical view of a shell or supershell as surrounding an essentially empty cavity. Figure 3 also fails to show any significant amount of continuum emission in excess of the diffuse emission seen in this general direction which, given the large distance of the shell, is likely to be foreground emission.
At the other extreme, a B0V star (or any star with Nu ≤ 1.5 × 1048 s-1) would ionize a negligible part of the H i shell, here hardly 1 pc. We can use Eq. (1) to estimate the ionizing photon rate, which would be enough to ionize a thin layer 1 beam size in thickness (1′ or about 5 pc). This gives log Nu = 48.90, corresponding to an O8.5V star. Note that WR stars have log Nu in the range 48.6 to 49.4 (Crowther 2007).
As for the intermediate case of an O6V star, Table 4 shows that it would ionize about 13 pc of the inner H i shell. This ionized gas would have an angular thickness of about 3′ and a flux density of about 1 Jy. An upper limit to the brightness temperature TB can be obtained by assuming this flux to originate from an annulus 35′ in radius and 3′ in thickness (giving an area of about 660 arcmin2 or 390 CGPS beam areas at 1420 MHz). We obtain TB < 2.3 mJy/beam ≈ 0.4 K or, given the measured noise of 0.082 K, about 5σ. An alternative means of estimating TB is to use an approximate emission measure given by  , from which the brightness temperature is TB = (EM/566 pc cm-6) K = 0.17 K. Given the spatially varying continuum surface brightness within the inner shell boundary, such a faint ionized layer would not be easily detected by our observations.
Constraints from radio continuum+.
Summing up, if the H i shell is relatively homogeneous, which is far from certain, we can rule out the presence of any star more luminous than O6V or with more than about 2 × 1049 ionizing photons s-1. Placing the shell at the slightly closer distance of 11.5 kpc would have the effect of making it slightly thinner and closer to any central star with the result that for any given spectral type, more of the shell would be ionized.
4.3.2. A clumpy shell
In addition to an obvious opening in the north, the H i shell does appear to be inhomogeneous on scales comparable to the beam size (about 1′ or 4.5 pc at a distance of 15 kpc). If it were inhomogeneous on scales smaller than the beam (thus undetectable in the CGPS image), the H i shell could let a significant number of photons escape, thus leading to a more diluted and fainter ionized layer.
The existence of inhomogeneities, whether they are called clumps, filaments, clouds, or cloudlets, has been invoked in a number of contexts. As a possibly extreme case (with regards to size), Everett & Churchwell (2010) recently postulated the existence, within the stellar wind cavity of the  nebula N49, of a few hundred cloudlets of internal density 105 cm-3 and of a radius as small as 0.05 pc. These would provide the dust needed to explain the 24 μm emission observed within the N49 cavity through erosion and evaporation.
We have no way of knowing the degree or type of inhomogeneities which could be present, however, for illustrative purposes, we consider inhomogeneities in the form of clumps with a radius r = 1 pc and internal density n′ = 102 cm-3, thus each clump would have a mass m = 10.4 M⊙. With a total H i shell mass of 2.3 × 10⁵ M⊙, this implies that there are N = 2.2 × 10⁴ such clumps. The volume filling factor is  . To estimate the transparency of the shell, we note that as viewed from the center of the shell, the clumps cover a fraction ϵ of the shell area where
  .
.
In other words, about 77% of the ionizing photons would escape through the shell or, taking the case of an O3V star, only 168 × 1047 ionising photons s-1 could contribute to partially ionize the clumps from Ri to Ro, resulting in an undetectable radio continuum surface brightness.
In summary, if the H i shell is basically homogeneous, there can be no star producing more than about 2 × 1049 ionizing photons per second. Depending on the degree of clumpiness of the shell however, such powerful stars could still be present. Nevertheless, given the possibly large kinematical age of the shell (up to 17 Myr), it is most likely that there are no O stars left inside the shell and that any B star, if present, contributes negligibly to ionization.
4.4. Triggered star-formation?
Shocks in expanding supershells are widely believed to be the primary mechanism for triggering star formation (Elmegreen 1998). Shells behind shock fronts experience gravitational instabilities that may lead to the formation of large condensations inside the swept-up material, and some of these may produce new stars (Elmegreen 1998). An increasing body of observational evidence confirms the importance of this mechanism (e.g. Patel et al. 1998; Oey et al. 2005; Arnal & Corti 2007; Cichowolski et al. 2009). Given the size of GSH 91.5+2−114, it seems reasonable to expect some signs of recent star-formation activity in or near the shell border.
4.4.1. Radio continuum sources
The 1420 MHz radio continuum image (Fig. 3) shows that a few extended, yet relatively compact objects are found near the inner periphery of the H i shell. Apart from G91.11+1.57, the so-called “head” of the H ii complex BG 2107+49 discussed by van der Werf & Higgs (1990), there are only two such objects within the boundary of the H i shell. Could these be H ii regions whose formation was triggered by the expanding H i shell? An unambiguous answer to this question requires a determination of both the distance and the radio spectral index.
We can obtain an estimate of the spectral index α (Sν ∝ ν − α) by measuring the flux densities at 1420 and 408 MHz. Yet for both G91.56+0.97 and G92.24+1.57, a substantially bright compact radio source is present in their immediate vicinity (named S1 and S2, see insets of Fig. 3). Whereas this poses no problem at 1420 MHz, the larger beam at 408 MHz results in a partial blend of these point sources with the nearby extended structure, particularly severe for G92.24+1.57.
To obtain the spectral indices, we first subtracted all point-like sources from the images at both frequencies with a two-dimensional Gaussian-fitting routine (Fig. 3 is the result at 1420 MHz). Because both S1 and S2 were successfully subtracted at this frequency, we then used the imview program4 to measure the flux density of the remaining extended source. The error was estimated by using slightly different background levels.
On the 408 MHz image however, the larger beam size (≈4′ × 3′) results in the Gaussian-fitting routine which finds both S1 and S2 to be extended, in contradiction with the fact that both are unresolved even at 1420 MHz. Inspection of the 408 MHz image showed however that the program did successfully subtract the combined flux density of the extended structure plus the nearby compact source, for both G91.56+0.97 and G92.24+1.57. In order to obtain the separate flux densities, we proceeded in two stages. Firstly, from the point source flux density at 1420 MHz, we estimated the 408 MHz flux density, starting with a trial spectral index α = 0.75, which is representative of the spectral index of extragalactic radio sources between 178 and 1400 MHz (Pacholczyk 1977). We then created a Gaussian source with this flux density with the 408 MHz beam size that we removed from the original image. We varied α until the best artefact-free subtraction was found. The flux density of the extended structure was then estimated as the difference between the combined flux density and that of the nearby point source. The 408 MHz flux densities of the two point sources, S1 and S2, were cross-checked by comparing our 408 MHz values with the 327 MHz values from the Westerbork survey (Rengelink et al. 1997). The values for S1 and S2 at 327 MHz are 57 mJy and 90 mJy, respectively, in satisfactory agreement with our determinations.
Table 5 summarizes the obtained flux densities and spectral indices, together with some independent measurements. Both sources S1 and S2 have a non-thermal spectrum consistent with their origin as extragalactic radio sources. As for G91.56+0.97 and G92.24+1.57, despite a few discrepant measurements, probably arising from a difference in background removal and/or inclusion of nearby point sources, they show a spectral index consistent with a thermal nature.
Without a distance estimate it is impossible to ascertain whether they are associated or not with the H i shell, however given their position on or near the H i shell, the possibility that they might be H ii regions whose formation was triggered by the expanding H i shell is worth pursuing.
Both sources are unfortunately too faint for a significant absorption spectrum to be obtained, which would enable us to set a limit on the distance. Another way to try to estimate their distances is to look for signatures in the H i emission distribution around these sources (since unfortunately no molecular data is available for this region). An inspection of the entire H i data cube shows a minimum in the velocity range from about –46.0 to –50.0 km s-1 in the area of G91.56+0.97. A well defined arc-shape structure of enhanced emissivity surrounds the minimum toward lower galactic longitudes. In Fig. 5 the contour delineating the H ii region G91.56+0.97 is shown superimposed on the H i emission distribution averaged in the velocity interval mentioned above. The excellent morphological correlation observed between both structures would put G91.56+0.97 at a distance of about 6.5 kpc, implying that it is not related to GSH 91.5+2−114. As for G92.24+1.57 we did not find any clear H i structure that could be associated with this source.
As mentioned previously, the source G91.11+1.57, associated with the H ii complex BG 2107+49 (van der Werf & Higgs 1990), also lies near the periphery of the large H i shell. Could the two be associated? Higgs et al. (1987) obtained an H103α recombination line spectrum, which showed this source at a velocity of −79.5 ± 1.1 km s-1. The resolution of their NRAO 43-m observations was 5′. Van der Werf & Higgs (1990) obtained a similar value of −80 ± 1 km s-1, using DRAO H i absorption spectra and an H112α recombination line spectrum obtained with the 100-m Effelsberg telescope at a resolution of  . These observations would seem to place G91.11+1.57 and our H i shell at significantly different distances. However, the VLA 5′′ radio continuum image of Higgs et al. (1987) shows the head of BG 2107+49 to consist of a set of discrete knots of emission about 10′′ in size and a more extended and diffuse region about 3′ in diameter. Although we cannot completely rule out the possibility that some of the knots could be at the larger distance of our H i shell, the fact that the H103α recombination line spectrum of Higgs et al. (1987) is extremely well fitted by a single line at −79.5 km s-1 with essentially no residuals near −114 km s-1 would seem to rule this out.
4.4.2. Infrared sources
We feel that the case for triggered formation is stronger for IRAS 21147+5016. This IRAS point source is seen projected inside the shell wall and appears itself surrounded by a smaller H i bubble (Fig. 1). This smaller H i cavity resembles the ones found by Dubner et al. (1990) and Arnal & Corti (2007). In both cases the authors found a small cavity immersed inside a larger HI shell. However, their interpretation about the origin of the structures differed. Dubner et al. (1990) concluded that both the large HI shell and the smaller bubble had been created by the same star, HD 197406, during different stages of its evolution. On the other hand, Arnal & Corti (2007) found an HI cavity around the OB association Bochum 7 and concluded that this association might have been born as a consequence of the evolution of the large shell GS263-02+45.
From Fig. 1 we can infer that the size of the smaller cavity is about 0 3. At the distance of GSH 91.5+2−114, this implies a linear size of about 80 pc. Given that this cavity can be observed over at least 10 km s-1 (see Fig. 2), a lower limit for the expansion velocity can be assumed as 5 km s-1. Under these conditions we derived an upper limit of about 5 Myr for the dynamical age if a stellar wind origin is considered. This age is significantly smaller than the one obtained for the large shell (7–17 Myr), but larger than the duration of the WC phase (105 yr), suggesting that the O-phase of the current WC star would also have contributed to its formation. Taking into account that progenitors with a mass of some 40 to 50 M⊙ are suggested for late WC stars (Crowther 2007), the dynamical age estimated for the small cavity is consistent with the time that these stars stay on the main sequence, between 3.7 and 4.9 Myr (Schaller et al. 1992). Based on the age estimate difference, the most probable scenario is one where the large shell, GSH 91.5+2−114, was created by the joint action of several massive stars and where at least one of them has already exploded as a supernova. Furthermore, as the shell evolved, new stars may have been triggered in its dense border, IRAS 21147+5016 being one of them. It is of interest that this smaller bubble (Fig. 3) appears to be opened on the exterior side of the larger H i shell. This would be expected for a star whose formation would have taken place toward the exterior of the expanding shell, leading it to first burst outwards.
5. Conclusions
The measured kinetic energy of expansion of GSH 91.5+2−114 is far too large to have been produced solely by the action of one or all of the four DWCL sources possibly associated with the H i shell. That the shell is very symmetrical whereas the DWCL sources are located well off-center suggests that if they are indeed inside the shell, their shaping influence is minimal. We have found no evidence for the presence of other massive stars, but absorption would preclude the detection of these objects at the inferred distance.
An interpretation as the H i shell of a single SNR is also not tenable. As for GSH 138-01-94 and GSH 90+03-99, GSH 91.5+2−114 has likely been caused by the combined winds and SN explosions of a number of massive stars.
The H i shell appears open to the north, i.e. in a direction away from the Galactic plane, suggesting that the shell has burst out of the Galactic disk. A filament displaced from the northern boundary (Filament B, Fig. 1) could be the remains of the top (now missing) part of the shell. The faint radio continuum emission, consisting of filaments more or less aligned in a direction perpendicular to the Galactic plane, lends support to the breakout hypothesis.
Two relatively compact thermal sources (Table 5), seen in projection near or on the boundary of the H i shell, could have formed in gas compressed by the expanding shell. One of the DWCL sources, IRAS 21147+5016, seen projected inside a smaller H i shell, could also be a product of triggered star formation. We cannot rule out the possibility that the other DWCL sources could also have formed in the same manner.
All velocities are with respect to the local standard of rest (lsr).
The Infrared Processing and Analysis Center (IPAC) is funded by NASA as part of the Infrared Astronomical Satellite (IRAS) extended mission under contract to the Jet Propulsion Laboratory (JPL).
Cohen (1995) definitions are of the form where the constants are 1.56 and 1.88 for the colors and , respectively.
This program is part of the DRAO export software package.
Acknowledgments
The research presented in this paper has used data from the Canadian Galactic Plane Survey, a Canadian project with international partners, supported by the Natural Sciences and Engineering Research Council. The work of S.P. and S.C. was supported by the Natural Sciences and Engineering Research Council of Canada and the Fonds Québecois pour la Recherche sur les sciences de la Nature et la Technologie. S.P. acknowledges the hospitality of the Instituto Argentino de Radioastronomía where part of this work was carried out. We are grateful to the referee, whose suggestions led to the improvement of this paper. This project was partially financed by the Consejo Nacional de Investigaciones Científicas y Técnicas (CONICET) of Argentina under projects PIP 01299 and PIP 6433, Agencia PICT 00812 and UBACyT X482.
References
- Arnal, E. M., & Corti, M. 2007, A&A, 476, 255 [NASA ADS] [CrossRef] [EDP Sciences] [Google Scholar]
- Arthur, S. J., & Hoare, M. G. 2006, ApJS, 165, 283 [NASA ADS] [CrossRef] [Google Scholar]
- Arvidsson, K., Kerton, C. R., & Foster, T. 2009, ApJ, 700, 1000 [NASA ADS] [CrossRef] [Google Scholar]
- Bessell, M. S., & Brett, J. M. 1988, PASP, 100, 1134 [NASA ADS] [CrossRef] [Google Scholar]
- Bohlin, R. C., Savage, B. D., & Drake, J. F. 1978, ApJ, 224, 132 [NASA ADS] [CrossRef] [Google Scholar]
- Brighenti, F., & D’Ercole, A. 1995, MNRAS, 277, 53 [NASA ADS] [Google Scholar]
- Cappa, C. E., Arnal, E. M., Cichowolski, S., Goss, W. M., & Pineault, S. 2003, in A Massive Star Odyssey: From Main Sequence to Supernova, ed. K. van der Hucht, A. Herrero, & C. Esteban, IAU Symp., 212, 596 [Google Scholar]
- Cazzolato, F., & Pineault, S. 2005, AJ, 129, 2731 [NASA ADS] [CrossRef] [Google Scholar]
- Chaisson, E. J. 1976, in Frontiers of Astrophysics, 259 [Google Scholar]
- Chan, G., & Fich, M. 1995, AJ, 109, 2611 [NASA ADS] [CrossRef] [Google Scholar]
- Chu, Y., Treffers, R. R., & Kwitter, K. B. 1983, ApJS, 53, 937 [NASA ADS] [CrossRef] [Google Scholar]
- Cichowolski, S., & Arnal, E. M. 2004, A&A, 414, 203 [NASA ADS] [CrossRef] [EDP Sciences] [Google Scholar]
- Cichowolski, S., Romero, G. A., Ortega, M. E., Cappa, C. E., & Vasquez, J. 2009, MNRAS, 394, 900 [NASA ADS] [CrossRef] [Google Scholar]
- Cioffi, D. F., McKee, C. F., & Bertschinger, E. 1988, ApJ, 334, 252 [NASA ADS] [CrossRef] [Google Scholar]
- Cohen, M. 1995, ApJS, 100, 413 [NASA ADS] [CrossRef] [Google Scholar]
- Crowther, P. A. 2007, ARA&A, 45, 177 [NASA ADS] [CrossRef] [Google Scholar]
- Dubner, G. M., Niemela, V. S., & Purton, C. R. 1990, AJ, 99, 857 [NASA ADS] [CrossRef] [Google Scholar]
- Elmegreen, B. G. 1998, in Origins, ed. C. E. Woodward, J. M. Shull, & H. A. Thronson, Jr., ASP Conf. Ser., 148, 150 [Google Scholar]
- Everett, J. E., & Churchwell, E. 2010, ApJ, 713, 592 [NASA ADS] [CrossRef] [Google Scholar]
- Foster, T., & MacWilliams, J. 2006, ApJ, 644, 214 [NASA ADS] [CrossRef] [Google Scholar]
- Fowler, J. W., & Aumann, H. H. 1994, in Science with High Spatial Resolution Far-Infrared Data, ed. S. Terebey, & J. M. Mazzarella, 1 [Google Scholar]
- Haverkorn, M., Gaensler, B. M., McClure-Griffiths, N. M., Dickey, J. M., & Green, A. J. 2006, ApJS, 167, 230 [CrossRef] [Google Scholar]
- Heiles, C. 1984, ApJS, 55, 585 [NASA ADS] [CrossRef] [Google Scholar]
- Higgs, L. A., Vallee, J. P., Albinson, J. S., Batrla, W., & Goss, W. M. 1987, A&A, 181, 351 [NASA ADS] [Google Scholar]
- Kobayashi, N., Yasui, C., Tokunaga, A. T., & Saito, M. 2008, ApJ, 683, 178 [NASA ADS] [CrossRef] [Google Scholar]
- Lozinskaya, T. A. 1992, Supernovae and stellar wind in the interstellar medium, ed. T. A. Lozinskaya [Google Scholar]
- McClure-Griffiths, N. M., Dickey, J. M., Gaensler, B. M., et al. 2000, AJ, 119, 2828 [NASA ADS] [CrossRef] [Google Scholar]
- McClure-Griffiths, N. M., Dickey, J. M., Gaensler, B. M., et al. 2005, ApJS, 158, 178 [NASA ADS] [CrossRef] [Google Scholar]
- McCray, R. 1983, Highlights of Astronomy, 6, 565 [Google Scholar]
- Mokiem, M. R., de Koter, A., Vink, J. S., et al. 2007, A&A, 473, 603 [NASA ADS] [CrossRef] [EDP Sciences] [Google Scholar]
- Normandeau, M., Taylor, A. R., Dewdney, P. E., & Basu, S. 2000, AJ, 119, 2982 [NASA ADS] [CrossRef] [Google Scholar]
- Nugis, T., & Lamers, H. J. G. L. M. 2000, A&A, 360, 227 [NASA ADS] [Google Scholar]
- Oey, M. S., Watson, A. M., Kern, K., & Walth, G. L. 2005, AJ, 129, 393 [NASA ADS] [CrossRef] [Google Scholar]
- Pacholczyk, A. G. 1977, Oxford Pergamon Press International Series on Natural Philosophy, 89 [Google Scholar]
- Patel, N. A., Goldsmith, P. F., Heyer, M. H., Snell, R. L., & Pratap, P. 1998, ApJ, 507, 241 [NASA ADS] [CrossRef] [Google Scholar]
- Pineault, S. 1998, AJ, 115, 2483 [NASA ADS] [CrossRef] [Google Scholar]
- Pineault, S., Cazzolato, F., & Juneau, V. 2002, in Seeing Through the Dust: The Detection of HI and the Exploration of the ISM in Galaxies, ed. A. R. Taylor, T. L. Landecker, & A. G. Willis, ASP Conf. Ser., 276, 332 [Google Scholar]
- Rengelink, R. B., Tang, Y., de Bruyn, A. G., et al. 1997, A&AS, 124, 259 [Google Scholar]
- Rieke, G. H., & Lebofsky, M. J. 1985, ApJ, 288, 618 [NASA ADS] [CrossRef] [Google Scholar]
- Rubin, R. H. 1968, ApJ, 154, 391 [NASA ADS] [CrossRef] [Google Scholar]
- Santos, C. A., Yun, J. L., Clemens, D. P., & Agostinho, R. J. 2000, ApJ, 540, L87 [NASA ADS] [CrossRef] [Google Scholar]
- Schaller, G., Schaerer, D., Meynet, G., & Maeder, A. 1992, A&AS, 96, 269 [Google Scholar]
- Skrutskie, M. F., Cutri, R. M., Stiening, R., et al. 2006, AJ, 131, 1163 [NASA ADS] [CrossRef] [Google Scholar]
- Snell, R. L., Carpenter, J. M., & Heyer, M. H. 2002, ApJ, 578, 229 [NASA ADS] [CrossRef] [Google Scholar]
- Stil, J. M., & Irwin, J. A. 2001, ApJ, 563, 816 [NASA ADS] [CrossRef] [Google Scholar]
- Stil, J. M., Taylor, A. R., Martin, P. G., et al. 2004, ApJ, 608, 297 [NASA ADS] [CrossRef] [Google Scholar]
- Stil, J. M., Taylor, A. R., Dickey, J. M., et al. 2006, AJ, 132, 1158 [NASA ADS] [CrossRef] [Google Scholar]
- Taylor, A. R., Gibson, S. J., Peracaula, M., et al. 2003, AJ, 125, 3145 [NASA ADS] [CrossRef] [Google Scholar]
- Uyaniker, B., & Kothes, R. 2002, ApJ, 574, 805 [NASA ADS] [CrossRef] [Google Scholar]
- Uyaniker, B., Landecker, T. L., Gray, A. D., & Kothes, R. 2003, ApJ, 585, 785 [NASA ADS] [CrossRef] [Google Scholar]
- van Buren, D., & McCray, R. 1988, ApJ, 329, L93 [NASA ADS] [CrossRef] [Google Scholar]
- van der Werf, P. P., & Higgs, L. A. 1990, A&A, 235, 407 [NASA ADS] [Google Scholar]
- Weaver, R., McCray, R., Castor, J., Shapiro, P., & Moore, R. 1977, ApJ, 218, 377 [NASA ADS] [CrossRef] [Google Scholar]
- Wilkin, F. P. 1996, ApJ, 459, L31 [NASA ADS] [CrossRef] [Google Scholar]
- Willis, A. G. 1999, A&AS, 136, 603 [NASA ADS] [CrossRef] [EDP Sciences] [Google Scholar]
All Tables
All Figures
|
Fig. 1 H i emission distribution averaged between −110.3 and −116.9 km s-1. The plus symbols indicate the position of the four DWCL source candidates, IRAS 21147+5016, IRAS 21106+5013, IRAS 21093+4959, and IRAS 21041+5052. The inset is a close-up view of the region near IRAS 21147+5016. |
| In the text | |
|
Fig. 2 CGPS gray-scale images showing the H i distribution in the LSR velocity range from −107.0 to −121.0 km s-1. Velocity resolution is 1.3 km s-1, and spatial resolution is 3′. The LSR central velocity of each image is indicated in the top left corner. The star symbols indicate the position of the four DWCL source candidates. For all images, darker shading indicates higher brightness. |
| In the text | |
|
Fig. 2 continued. |
| In the text | |
|
Fig. 3 1420 MHz radio continuum and 60 μm images from the CGPS survey. Resolution for both is about 1′. Point-like sources have been removed from the radio continuum image. Circles indicate the approximate inner and outer boundary of the H i shell seen in Fig. 1. The two insets at the bottom of the radio image show a close-up view of G91.56+0.97 and G92.24+1.57 (point-like sources included, see text). |
| In the text | |
|
Fig. 4 (H − K,J − H) color–color diagram of the 2MASS sources found in a 400′′ circular area centered at (l,b) = (91 |
| In the text | |
|
Fig. 5 H i emission distribution averaged between –46.0 and –49.3 km s-1. The black contour corresponds to the 8.5 K level of the 1420 MHz radio continuum emission. |
| In the text | |
Current usage metrics show cumulative count of Article Views (full-text article views including HTML views, PDF and ePub downloads, according to the available data) and Abstracts Views on Vision4Press platform.
Data correspond to usage on the plateform after 2015. The current usage metrics is available 48-96 hours after online publication and is updated daily on week days.
Initial download of the metrics may take a while.