Free Access
Fig. 1
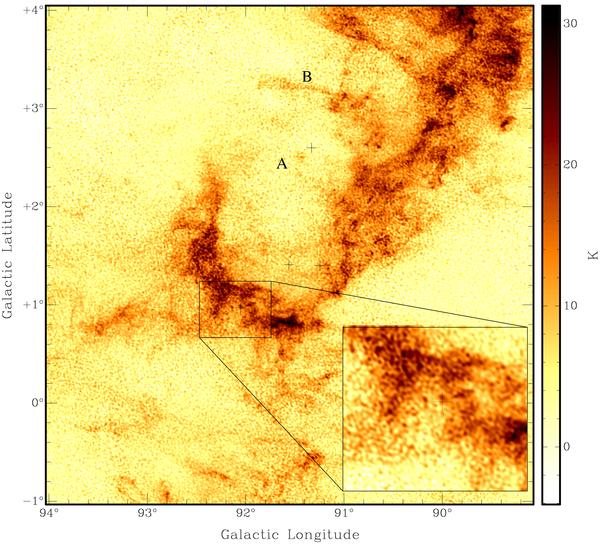
H i emission distribution averaged between −110.3 and −116.9 km s-1. The plus symbols indicate the position of the four DWCL source candidates, IRAS 21147+5016, IRAS 21106+5013, IRAS 21093+4959, and IRAS 21041+5052. The inset is a close-up view of the region near IRAS 21147+5016.
Current usage metrics show cumulative count of Article Views (full-text article views including HTML views, PDF and ePub downloads, according to the available data) and Abstracts Views on Vision4Press platform.
Data correspond to usage on the plateform after 2015. The current usage metrics is available 48-96 hours after online publication and is updated daily on week days.
Initial download of the metrics may take a while.