| Issue |
A&A
Volume 520, September-October 2010
|
|
|---|---|---|
| Article Number | A108 | |
| Number of page(s) | 7 | |
| Section | Stellar structure and evolution | |
| DOI | https://doi.org/10.1051/0004-6361/201014941 | |
| Published online | 12 October 2010 | |
CoRoT light curves of RR Lyrae stars
CoRoT 101128793: long-term changes in the Blazhko effect and excitation of additional modes![[*]](/icons/foot_motif.png) ,
,
E. Poretti1 - M. Paparó2 - M. Deleuil3 - M. Chadid4 - K. Kolenberg5 - R. Szabó2 - J. M. Benko2 - E. Chapellier4 - E. Guggenberger5 - J. F. Le Borgne6 - F. Rostagni4 - H. Trinquet4 - M. Auvergne7 - A. Baglin7 - L. M. Sarro8 - W. W. Weiss5
1 -
INAF - Osservatorio Astronomico di Brera, via E. Bianchi 46, 23807 Merate (LC), Italy
2 -
Konkoly Observatory of the Hungarian Academy of Sciences, PO Box 67, 1525 Budapest, Hungary
3 -
LAM, UMR 6110, CNRS/Univ. de Provence, 38 rue F. Joliot-Curie, 13388 Marseille, France
4 -
Observatoire de la Côte d'Azur, Université Nice Sophia-Antipolis, UMR 6525, Parc
Valrose, 06108 Nice Cedex 02, France
5 -
Institute of Astronomy, University of Vienna, Türkenschanzstrasse 17, 1180 Vienna, Austria
6 -
Laboratoire d'Astrophysique de Toulouse-Tarbes, Université de Toulouse,
CNRS, 14 Av. Édouard Belin, 31400 Toulouse, France
7 -
LESIA, Université Pierre et Marie Curie, Université Denis Diderot, Observatoire de
Paris, 92195 Meudon Cedex, France
8 -
Dpt. de Inteligencia Artificial, UNED, Juan del Rosal 16, 28040 Madrid, Spain
Received 5 May 2010 / Accepted 9 June 2010
Abstract
Context. The CoRoT (Convection, Rotation and planetary
Transits) space mission provides a valuable opportunity to monitor
stars with uninterrupted time sampling for up to 150 days at a time.
The study of RR Lyrae stars, performed in the framework of the
Additional Programmes belonging to the exoplanetary field, will
particularly benefit from such dense, long-duration monitoring.
Aims. The Blazhko effect in RR Lyrae stars is a long-standing,
unsolved problem of stellar astrophysics. We used the CoRoT data of the
new RR Lyrae variable CoRoT 101128793 (f0 = 2.119 d-1,
P=0.4719296 d) to provide us with more detailed
observational facts to understand the physical process behind the
phenomenon.
Methods. The CoRoT data were corrected for one jump and the
long-term drift. We applied different period-finding techniques to the
corrected timeseries to investigate amplitude and phase modulation. We
detected 79 frequencies in the light curve of CoRoT 101128793. They
have been identified as the main frequency f0 and its harmonics, two independent terms, the terms related to the Blazhko frequency fm, and to several combination terms.
Results. A Blazhko frequency fm = 0.056 d-1 and
a triplet structure around the fundamental radial mode and harmonics
were detected, as were a long-term variability on the Blazhko
modulation. Indeed, the amplitude of the main oscillation is decreasing
along the CoRoT survey. The Blazhko modulation is one of the smallest
observed in RR Lyrae stars. Moreover, the additional modes
![]() = 3.630 and f2 = 3.159 d-1 are detected. Taking its ratio with the fundamental radial mode into account, the term
= 3.630 and f2 = 3.159 d-1 are detected. Taking its ratio with the fundamental radial mode into account, the term
![]() could be the identified as the second radial overtone. Detecting of
these modes in horizontal branch stars is a new result obtained by
CoRoT.
could be the identified as the second radial overtone. Detecting of
these modes in horizontal branch stars is a new result obtained by
CoRoT.
Key words: stars: variables: RR Lyrae - stars: oscillations - stars: interiors - stars: individual: CoRoT 101128793 - techniques: photometric
1 Introduction
The pulsation of RR Lyrae stars is paramount for advancing in several fields of stellar physics. Marconi (2009) emphasizes how we can reproduce all the relevant observables of the radial pulsation including only non-local, time-dependent treatment of the convection in nonlinear models. In particular, pulsational models are able to reproduce the correlation between the periods and the absolute magnitudes in the near infrared bands (Bono et al. 2003). The model-fitting technique (Marconi 2009) applied to a sample of RR Lyrae stars in the Large Magellanic Cloud was very useful to fix the problem of the distance scale (Marconi & Clementini 2005). Because they have been observed since the end of the XIXth century, RR Lyrae stars are also promising targets for studying stellar evolution in real time (Le Borgne et al. 2007).
What has not yet been understood in RR Lyrae stars is the Blazhko effect, a periodic modulation of both the amplitudes and phases of the main pulsational mode. Different mechanisms have been proposed to explain the phenomenon: the resonance model between nonradial modes of low degree and the main radial mode (Dziembowski & Mizerski 2004), the oblique pulsator model in which the rotational axis does not coincide with the magnetic axis (Shibahashi 2000; Kurtz 1982), and the action of a turbulent convective dynamo in the lower envelope of the star (Stothers 2006). Kovács (2009) reviews these models and points out why we cannot definitely accept any of these explanations. It seems well-established that Blazhko RR Lyrae stars do not show any strong magnetic field (Chadid et al. 2004; Kolenberg & Bagnulo 2009). The observation of Blazhko RR Lyrae stars was performed with remarkable success by means of extensive ground-based surveys. Well-defined findings (e.g., changes in the Blazhko period, modulation features, systematic changes in the global mean physical parameters, high-order multiplets, long-term changes) have recently been obtained on RR Lyr itself (Kolenberg et al. 2006), MW Lyr (Jurcsik et al. 2008), XZ Cyg (LaCluyzé et al. 2004), RR Gem (Jurcsik et al. 2005; Sódor et al. 2007), and DM Cyg (Jurcsik et al. 2009a).
The Additional Programmes in the exoplanetary science case of the CoRoT
(COnvection, ROtation and planetary Transits, Baglin et al. 2006) space mission
were focused on specific classes of stars with the aim of supplying a new and powerful
tool for deciphering the physical reasons for their variability (Weiss 2006).
RR Lyrae stars are being studied in the framework of the international RR Lyrae-CoRoTeam![]() . Preliminary results
were presented by Chadid et al. (2009), and the
potential of the 150-day continuous monitoring of an RR Lyrae star has been demonstrated
by the case of V1127 Aql (Chadid et al. 2010), not previously known as
a Blazhko variable. Very high-order modulation sidepeaks were detected, up to
the sepdecaplet structure. Additional modes have also been detected and interpreted as nonradial
modes or secondary modulation. As the Blazhko effect remains misunderstood
in its physical nature, we can look at the CoRoT data as a new opportunity for
providing the observational facts we need to shed new light on it.
. Preliminary results
were presented by Chadid et al. (2009), and the
potential of the 150-day continuous monitoring of an RR Lyrae star has been demonstrated
by the case of V1127 Aql (Chadid et al. 2010), not previously known as
a Blazhko variable. Very high-order modulation sidepeaks were detected, up to
the sepdecaplet structure. Additional modes have also been detected and interpreted as nonradial
modes or secondary modulation. As the Blazhko effect remains misunderstood
in its physical nature, we can look at the CoRoT data as a new opportunity for
providing the observational facts we need to shed new light on it.
2 The CoRoT data
CoRoT 101128793![]() USNOA2 0900-15089357
(
USNOA2 0900-15089357
(
![]()
![]()
![]() ,
,
![]() $^$13
$^$13![]() 35
35
![]() 05, J2000)
is a 16th-mag star (V=15.93, B-V=+0.89, Deleuil et al. 2009)
in the constellation of Aquila.
Its variability was discovered during the first Long Run in the
centre direction (LRc01), carried out continuously from May 15 to
October 14, 2007, i.e., for 142 d.
There is no relevant contamination from nearby stars, since the brightest
star included in the CoRoT mask is 3.0 mag fainter than CoRoT 101128793 in V light
(Deleuil et al. 2009).
The exposure time in the CoRoT exoplanetary
channel was 512 s and this time remained constant all over the LRc01.
Thanks to its very high duty cycle, CoRoT collected 23 922 data points,
and the spectral window is free from any relevant alias structure.
The star was classified as an RR Lyrae variable by the
``CoRoT Variability Classifier'' automated supervised method (Debosscher et al. 2009)
and then confirmed by human inspection of the light curve.
CoRoT 101128793, located close to the direction of the galactic centre,
is therefore heavily reddened.
05, J2000)
is a 16th-mag star (V=15.93, B-V=+0.89, Deleuil et al. 2009)
in the constellation of Aquila.
Its variability was discovered during the first Long Run in the
centre direction (LRc01), carried out continuously from May 15 to
October 14, 2007, i.e., for 142 d.
There is no relevant contamination from nearby stars, since the brightest
star included in the CoRoT mask is 3.0 mag fainter than CoRoT 101128793 in V light
(Deleuil et al. 2009).
The exposure time in the CoRoT exoplanetary
channel was 512 s and this time remained constant all over the LRc01.
Thanks to its very high duty cycle, CoRoT collected 23 922 data points,
and the spectral window is free from any relevant alias structure.
The star was classified as an RR Lyrae variable by the
``CoRoT Variability Classifier'' automated supervised method (Debosscher et al. 2009)
and then confirmed by human inspection of the light curve.
CoRoT 101128793, located close to the direction of the galactic centre,
is therefore heavily reddened.
![\begin{figure}
\par\includegraphics[width=9cm,clip]{14941fg1.ps}
\end{figure}](/articles/aa/full_html/2010/12/aa14941-10/img10.png)
|
Figure 1: Top panel: the light curve obtained by removing the main frequency and its harmonics from the original data showing a long-term drift and a jump. Middle panel: the light curve of the residuals is corrected from the long-term drift and the jump. Bottom panel: the final light curve of CoRoT 101128793 is an example of the continuous, excellent quality monitoring of stars in the CoRoT exoplanetary field. |
| Open with DEXTER | |
The absolute CoRoT photometry is affected by jumps, outliers, and a long-term drift. It is very hard to detect jumps in the original data of an RR Lyrae variable, since they have a small amplitude (few 0.01-mag) and are not discernible in a light curve having an amplitude of several tenths of a magnitude. As a matter of fact, we could detect a jump of 0.032 mag at JD 2 454 369.7 only a posteriori, after having performed the preliminary frequency analysis of the original data. Indeed, only the residuals obtained by subtracting the main frequency f0 and its harmonics from the original CoRoT data clearly show the jump. We re-aligned the whole dataset after removing the few corrupted measurements on the jump (Fig. 1, top and middle panels).
In addition to the jump, some oscillations and a continuous drift are clearly visible in the top panel of Fig. 1. The oscillations have a stellar origin (see Sect. 3.2), but the drift is an instrumental effect (Auvergne et al. 2009), so it should be removed before performing the frequency analysis. Different detrending algorithms can be used, based on moving means or polynomial fits. After several trials, we removed the drift by calculating the mean magnitudes of the least-squares fits of four consecutive cycles (i.e., 1.88 d). The main frequency and its harmonics were used, as in the previous step. At that point, the value of the mean magnitude was interpolated at the time of each observation and then subtracted from the original data. During this analysis we also removed the most obvious outliers. The final CoRoT timeseries is available in electronic form at the CDS. The re-aligned, de-jumped light curve disclosed the multiperiodic behaviour of CoRoT 101128793: continuous oscillations are clearly visible in the light curve prewhitened with f0 and harmonics (Fig. 1, middle panel) and in the light curve of the original data (a portion is shown in Fig. 1, bottom panel).
The subsequent frequency analysis was performed by using different packages such as Period04 (Lenz & Breger 2005), MuFrAn (Kolláth 1990), and the iterative sine-wave fitting (Vanicek 1971). The different algorithms led to the same results with only marginal differences at higher orders. We present here the results of the iterative-sine wave fitting, with a complementary frequency refinement obtained by means of the MTRAP algorithm (Carpino et al. 1987).
The realigned dataset was first analysed to
search for the effects of the orbital frequency.
Several frequencies were found at the orbital frequency
![]() d-1and harmonics. Moreover, the term
d-1and harmonics. Moreover, the term
![]() d-1 was found. This
perturbation comes from the passage of the satellite over the South Atlantic
Anomaly (SAA). Since it occurs twice a day, the harmonic 2
d-1 was found. This
perturbation comes from the passage of the satellite over the South Atlantic
Anomaly (SAA). Since it occurs twice a day, the harmonic 2
![]() is much stronger
than
is much stronger
than
![]() ,
which corresponds to the passage of the satellite over the SAA
on the same side of the Earth with respect to the Sun. The effects of these passages on the onboard
instrumentation are described by Auvergne et al. (2009). They originate frequencies at
,
which corresponds to the passage of the satellite over the SAA
on the same side of the Earth with respect to the Sun. The effects of these passages on the onboard
instrumentation are described by Auvergne et al. (2009). They originate frequencies at
| (1) |
with
3 The frequency content
By using the packages previously mentioned,
we identified 79 components of stellar origin,
in addition to the
![]() frequencies and to the spurious peaks at very low frequencies,
i.e., residuals of the long-term drift of the sensitivity drift of the CCDs.
They can be divided into four categories:
frequencies and to the spurious peaks at very low frequencies,
i.e., residuals of the long-term drift of the sensitivity drift of the CCDs.
They can be divided into four categories:
- 1.
- the main frequency f0 and its harmonics;
- 2.
- the terms related to the Blazhko frequency fm;
- 3.
- other independent terms;
- 4.
- the combination terms.
![\begin{figure}
\par\includegraphics[width=9cm,clip]{14941fg2.ps}
\end{figure}](/articles/aa/full_html/2010/12/aa14941-10/img20.png)
|
Figure 2: Subsequent steps in the detection of frequencies in the amplitude spectra of CoRoT 101128793. |
| Open with DEXTER | |
The most intriguing peaks stand out
in the region 3-4 d-1 after subtracting the Blazhko sidepeaks
(third panel and inserted box). The highest peaks in the third panel of Fig. 2
are at
![]() = 3.157 d-1 and f2 = 3.630 d-1.
They show linear combination with f0 and harmonics and are therefore
intrinsic to the RR Lyrae star. They provide evidence of excited modes
other than the fundamental radial mode f0.
= 3.157 d-1 and f2 = 3.630 d-1.
They show linear combination with f0 and harmonics and are therefore
intrinsic to the RR Lyrae star. They provide evidence of excited modes
other than the fundamental radial mode f0.
The residual spectrum does not show any other structure, except
an excess of signal still centred on the largest amplitude modes
and on the orbital frequencies of the satellite
(Fig. 2, bottom panel).
After removing the 79 frequencies,
the average noise level resulted in
![]() mag in the 0-100 d-1 region of the residual spectrum
(inserted box in Fig. 2, bottom panel).
The lowest detected amplitude among the 79 frequencies led to 0.36 mmag,
i.e., 5 times the level of the overall final noise.
We note that at each step of the process in
frequency detection we calculated the local noise centred on the detected peak,
and we always got
mag in the 0-100 d-1 region of the residual spectrum
(inserted box in Fig. 2, bottom panel).
The lowest detected amplitude among the 79 frequencies led to 0.36 mmag,
i.e., 5 times the level of the overall final noise.
We note that at each step of the process in
frequency detection we calculated the local noise centred on the detected peak,
and we always got
![]() .
This threshold was retained to accept a combination term,
while independent terms have much higher SNR (17.45 and 9.25 for
.
This threshold was retained to accept a combination term,
while independent terms have much higher SNR (17.45 and 9.25 for
![]() and f2,
respectively).
and f2,
respectively).
The final solution of the CoRoT light curve was calculated by means of a
cosine series (
T0=2 454 308.2168) and their least-squares parameters, together with the local
SNRs, are listed in Table 1. The listed values of the frequencies are
corresponding to the highest peaks in the amplitude spectrum. The values calculated from
the four independent frequencies and the identification listed in the last column of
Table 1 (the so-called locked solution, obtained by using the MTRAP
algorithm, Carpino et al. 1987)
are generally in excellent agreement
(f0 = 2.118977,
![]() = 3.630499,
= 3.630499,
![]() = 3.156776, and fm = 0.00550 d-1).
The observed discrepancies
are probably due to the non-equidistance of the triplet structures
and to other terms hidden in the residual noise.
As an example, a third independent frequency is probably present close to 3.00 d-1, but we
cannot identify it unambiguously. If this f3 term were real, then some combination
terms should be changed by substituting, e.g., 2
= 3.156776, and fm = 0.00550 d-1).
The observed discrepancies
are probably due to the non-equidistance of the triplet structures
and to other terms hidden in the residual noise.
As an example, a third independent frequency is probably present close to 3.00 d-1, but we
cannot identify it unambiguously. If this f3 term were real, then some combination
terms should be changed by substituting, e.g., 2
![]() with 2f0 + f4.
The solution with all independent frequencies gives the same residual rms of the
solution with the locked frequencies (0.01006 and 0.01100 mag, respectively). These values
are mostly affected by the residual peaks described above.
with 2f0 + f4.
The solution with all independent frequencies gives the same residual rms of the
solution with the locked frequencies (0.01006 and 0.01100 mag, respectively). These values
are mostly affected by the residual peaks described above.
![\begin{figure}
\par\includegraphics[width=9cm,clip]{14941fg3.ps}
\end{figure}](/articles/aa/full_html/2010/12/aa14941-10/img23.png)
|
Figure 3: Upper panel: the CoRoT data folded with f0, original (top) and after subtracting the 79 frequencies (bottom). Left panel, lower row: the amplitudes of the n f0 terms. Right panel, lower row: the observed triplet structure around n f0 terms. The filled circles indicate the component with the greatest amplitude in the triplet, the empty circles the second in amplitude, the star the third. |
| Open with DEXTER | |
3.1 The main f0 term and its harmonics
The light curve on the f0 term is very asymmetric (Fig. 3, upper curve in the top panel) and harmonics up to 13f0 are significant. Their amplitudes are not monotonically decreasing: the amplitude of 6f0 is larger than for 5f0, and that of 11f0 is larger than for 10f0, just before the final decline (Fig. 3, left panel in the bottom row). Indeed, the light curve of CoRoT 101128793 shows a couple of particularities, i.e., the bump near the minimum often observed in RRab stars and a change in slope on the rising branch. They are not very pronounced, but still discernible in the light curve (Fig. 1, bottom panel). The fit of these small particularities requires a more relevant contribution from the highest harmonics than in the case of smooth light curves. Moreover, the change in slope does not repeat in a regular way, since the plot of the residuals (Fig. 3, lower curve in the top panel) shows a wide spread in this phase interval. The non-white distribution of the photometric residuals is the cause of the small bunches of frequencies observed in the residual spectrum. The Blazhko variables RR Gem and DM Cyg show the same light curve shape and the same residual distribution as CoRoT 101128793 (Jurcsik et al. 2005,2009a).
The measurements around the maximum and minimum brightnesses were
fitted by means of a least-squares polynomial. We obtained the
ephemeris
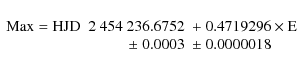
when fitting the times of maxima (Table 2) by means of a least-squares line. The O-C values (differences between the observed and calculated times of maxima) were determined by using this ephemeris.
![\begin{figure}
\par\includegraphics[width=9cm,clip]{14941fg4.ps}
\end{figure}](/articles/aa/full_html/2010/12/aa14941-10/img25.png)
|
Figure 4: Evidence of the long-term variations in the CoRoT 101128793 light curve. Top panel: the magnitudes at maximum (upper curve) and minimum (lower curve) brightness in the different cycles. Middle panel: the amplitudes of the f0 component (upper curve) and the period values (lower curve). Reference line is displayed to show the long term variation in amplitude. Bottom panel: the power spectrum of the magnitudes at maximum brightness. |
| Open with DEXTER | |
3.2 The Blazhko frequency f m
As suggested by the residuals after subtracting the main oscillation (Fig. 1, middle panel),
there is a periodic change in the shape of the light curve, and
this change defines the Blazhko effect.
The Blazhko effect translates
into symmetric sidepeaks of f0 and its harmonics in the frequency domain
(second panel in Fig. 2).
In the case of CoRoT 101128793, the sidepeaks are n f0![]() fm triplets (Fig. 3, right panel in the bottom row).
fm triplets (Fig. 3, right panel in the bottom row).
We obtained an independent confirmation of the Blazhko frequency from the magnitudes at the maximum brightness (see above) and from the application of the analytic signal method (Kolláth et al. 2002). The magnitudes at maximum oscillate in a peak-to-peak interval of 0.06 mag (Fig. 4, top panel): the power spectrum unambiguously identifies fm = 0.056 d-1 (Fig. 4, bottom panel). The instantaneous amplitudes and frequencies also vary with fm (Fig. 4, middle panel). The period variations, and consequently the O-C range, are very small. As a matter of fact, CoRoT 101128793 shows the smallest period variation among the CoRoT RRab stars (see Fig. 2 in Szabó et al. 2009). Since the Blazhko effect is more evident in amplitude than in phase, the cycle-to-cycle variations in the light curve are undetectable when folding the data over f0, also considering the perfect coverage in phase ensured by the CoRoT observations. The Blazhko effect just causes a wider spread of the points, while the curve apparently remains very regular (Fig. 3, top panel). The Blazhko effect of CoRoT 101128793 seems to be particular since the harmonic 2fm has an amplitude greater than fm (Table 1 and middle panel of Fig. 1). This particularity could reflect the different forms in which the Blazhko effect can occur (see Table 1 in Szabó et al. 2009). However, we should also consider that the frequency and amplitude values of fm and 2fm could be affected by the slightly different separations between the sidepeaks of the triplets (Table 1) and by the correction of the low-frequency drift.
We observe a peak close to zero (Fig. 4, bottom panel) in the power spectrum of the magnitudes at maximum. This suggests that there is a very long-term variation, on a timescale longer than covered by the CoRoT data. The complicated behaviour of the light curve is made clear by the comparison between maxima and minima (Fig. 4, upper panel). The range in the magnitudes at minimum is about half that at the maximum. Also the amplitudes of the f0 component (calculated both as instantaneous values and by subdividing the timeseries in pulsational cycles) show the decreasing trend underlying the Blazhko periodicity (Fig. 4, middle panel).
The long-term change is a further complication of the frequency analysis (Benko et al. 2009; Szeidl & Jurcsik 2009). Together with the change in slope on the rising branch, it causes the peaks around f0 and its harmonics in the residual spectrum (Fig. 2, bottom panel).
3.3 The independent terms
3.3.1 f1 = 3.630 d-1
The first peak not related to f0 and fm is found
at
![]() = 3.630 d-1. The light curve related to this periodicity is slightly
asymmetrical, since we found a small-amplitude first harmonic 2
= 3.630 d-1. The light curve related to this periodicity is slightly
asymmetrical, since we found a small-amplitude first harmonic 2
![]() .
It also shows several combination terms with n f0 and n f0
.
It also shows several combination terms with n f0 and n f0 ![]() fm.
However,
fm.
However,
![]() is not affected by the Blazhko effect, since we did not detect terms of
the form
is not affected by the Blazhko effect, since we did not detect terms of
the form
![]()
![]() fm.
fm.
The ratio f0/
![]() = 0.584 is very close to what is expected between
the fundamental radial mode and the second overtone. To verify this possibility
from a theoretical point of view, we computed linear RR Lyrae model grids on an
extremely large parameter space (
L=40, 50, 60 and
70
= 0.584 is very close to what is expected between
the fundamental radial mode and the second overtone. To verify this possibility
from a theoretical point of view, we computed linear RR Lyrae model grids on an
extremely large parameter space (
L=40, 50, 60 and
70 ![]() ,
M=0.50-0.80
,
M=0.50-0.80 ![]() with
with
![]() ,
,
![]() -8000 K,
-8000 K,
![]() K, Z=0.001, 0.003, 0.01, 0.02 and 0.04).
The other adopted parameters were standard RR Lyrae parameters (see Szabó et al. 2004).
Nonlinearity introduces a negligible difference in the periods and period ratios.
The Petersen diagram for different metallicities is shown in Fig. 5.
The period ratio is fully compatible with an identification of
K, Z=0.001, 0.003, 0.01, 0.02 and 0.04).
The other adopted parameters were standard RR Lyrae parameters (see Szabó et al. 2004).
Nonlinearity introduces a negligible difference in the periods and period ratios.
The Petersen diagram for different metallicities is shown in Fig. 5.
The period ratio is fully compatible with an identification of
![]() as the second
radial overtone. In such a case, the models suggest a Z-metallicity of 0.002-0.004.
Assuming a ratio of 0.74 between fundamental and first overtone radial modes, the latter
should be around 2.863 d-1, but the frequency spectrum
does not show any significant peak at this value.
as the second
radial overtone. In such a case, the models suggest a Z-metallicity of 0.002-0.004.
Assuming a ratio of 0.74 between fundamental and first overtone radial modes, the latter
should be around 2.863 d-1, but the frequency spectrum
does not show any significant peak at this value.
![\begin{figure}
\par\includegraphics[width=8.5cm,height=8.5cm,angle=270]{14941fg5.ps}
\end{figure}](/articles/aa/full_html/2010/12/aa14941-10/img31.png)
|
Figure 5: Petersen diagram based on linear convective RR Lyrae models. The symbols denote different metallicities. The black square shows the position of CoRoT 101128793, assuming that the frequency f2 is the second overtone radial mode. |
| Open with DEXTER | |
3.3.2 f2 = 3.159 d-1
The amplitude of f2 = 3.159 d-1 is only a bit smaller than that of
![]() (0.0021 and 0.0028 mag, respectively)
and at the same level of that of the 8f0 harmonic.
The ratio f2/f0 =
(0.0021 and 0.0028 mag, respectively)
and at the same level of that of the 8f0 harmonic.
The ratio f2/f0 =
![]() could be the signature of the period doubling bifurcation (Moskalik & Buchler 1990)
first noticed in some RR Lyrae stars observed with Kepler (Kolenberg et al. 2010).
could be the signature of the period doubling bifurcation (Moskalik & Buchler 1990)
first noticed in some RR Lyrae stars observed with Kepler (Kolenberg et al. 2010).
Another characteristic of f2 is to be flanked by a Blazhko frequency at f2-fm.
This occurrence can have different explanations: i) the Blazhko variability also
affects f2;
ii) it is a coincidence, and f2 and f2 - fm are actually two independent modes;
iii) f2 - fm is a mere combination term, such as the difference between f0 + f2
and f0 + fm.
We can try to disentangle the matter by examining the three possibilities.
If f2 shows the Blazhko effect, it is strange that we do not detect f2 + fm since we
expect the sum term to have an amplitude greater than the difference term (see
Fig. 3, right panel in the bottom row). The coincidence is also improbable, since the frequency
spectrum is not very rich. The resonance mechanism is possible, but that it involves the Blazhko
term makes it a very particular
case. Finally, combination terms with n f0, n f0 ![]() fm,
and
fm,
and
![]() are detected. In particular, we found unusual combinations, such as f0 +
are detected. In particular, we found unusual combinations, such as f0 +
![]() + f2
and f0 + fm +
+ f2
and f0 + fm +
![]() + f2, and they display a good SNR (5.4 and 4.6, respectively).
Therefore, the hypothesis of a particular combination term seems the most plausible.
+ f2, and they display a good SNR (5.4 and 4.6, respectively).
Therefore, the hypothesis of a particular combination term seems the most plausible.
4 Discussion
The continuous, long monitoring offered by space photometry is a new observational tool to understand the pulsational behaviour of RR Lyrae stars. Through such data, cycle-to-cycle variations can be clearly pointed out. Indeed, the Blazhko modulation of CoRoT 101128793 is one of the smallest ever observed in RR Lyrae stars (Jurcsik et al. 2009b).
4.1 The Blazhko effect
CoRoT data have already demonstrated that the Blazhko cycle of V1127 Aql is changing on a timescale of 143 d: the shift is much more evident in time than in magnitude (see Fig. 14 in Chadid et al. 2010). The Blazhko effect of CoRoT 101128793 is much less than that of V1127 Aql (0.06 mag vs. 0.35 mag in the full range of magnitudes at maximum, 0.02 p vs. 0.17 p in the phases of maximum).
Notwithstanding this small effect, the trend observed in the magnitudes at maximum and at
minimum (Fig. 4,
upper panel) supports a long-term change. The best observational
evidence for a long-term change in the Blazhko period is given by RR
Lyr itself. Ground-based photometry collected on several decades shows
a decrease from 40.8 d to 38.8 d (Kolenberg et al. 2006).
The modulation amplitude of RR Gem was also subjected to strong
variations from the undetectable level (less than 0.04 mag in
maximum brightness) to about 0.20 mag on a time baseline of
70 years (Sódor et al. 2007). In the case of the Blazhko effect of MW Lyrae (fm = 0.060 d-1), Jurcsik et al. (2008)
put in evidence secondary peaks around the main pulsation terms separated by a periodicity
comparable with the time baseline, tentatively ![]() 500 d.
Therefore, it seems that long-term changes are occurring in
Blazhko RR Lyrae variables, and they can be detected when monitored in an intensive and/or continuous way.
500 d.
Therefore, it seems that long-term changes are occurring in
Blazhko RR Lyrae variables, and they can be detected when monitored in an intensive and/or continuous way.
4.2 The excitation of additional modes
The case of CoRoT 101128793 supplies new evidence of the
excitation of additional modes in RR Lyrae stars. The two frequencies
![]() and f2 are not related with the Blazhko or another modulation, as
it could be for V1127 Aql (Chadid et al. 2010). The frequency
and f2 are not related with the Blazhko or another modulation, as
it could be for V1127 Aql (Chadid et al. 2010). The frequency
![]() could be typified as the second overtone radial mode, while the nature of f2 is still unclear.
We immediately note that also in the case of V1127 Aql we found frequency
ratios compatible with that between fundamental and second overtone radial modes, i.e.,
2.8090/4.8254=0.582, and with the possible period doubling bifurcation, i.e.,
4.1916/2.8090=1.492. Moreover, the frequency values
could be typified as the second overtone radial mode, while the nature of f2 is still unclear.
We immediately note that also in the case of V1127 Aql we found frequency
ratios compatible with that between fundamental and second overtone radial modes, i.e.,
2.8090/4.8254=0.582, and with the possible period doubling bifurcation, i.e.,
4.1916/2.8090=1.492. Moreover, the frequency values
![]() and f2 are in the same
interval of the nine additional modes detected in the frequency spectrum of V1127 Aql (3.64-4.82 d-1).
and f2 are in the same
interval of the nine additional modes detected in the frequency spectrum of V1127 Aql (3.64-4.82 d-1).
It is interesting to revisit the results obtained by Jurcsik et al. (2008) on MW Lyr. Those authors
identified four frequencies in the 3.27-6.78 d-1 interval (3.2701, 4.2738, 5.7847, and
6.7885 d-1)![]() as combination terms having the form
as combination terms having the form
![]() (where
f0=2.5146 d-1 is the
main pulsation mode and
fm=0.0604 d-1 the Blazhko frequency).
Since the 12.5 fm spacing remains unexplained,
we propose an alternative solution based on the additional modes
f1=3.2701 d-1 and
f2=4.2738 d-1 and the combination terms
f0+f1=5.7847 d-1 and
f0+f2=6.7884 d-1. We find for the third time a frequency ratio
(
f0/f2=0.588) that could be explained with the ratio between the fundamental and the second overtone radial modes.
(where
f0=2.5146 d-1 is the
main pulsation mode and
fm=0.0604 d-1 the Blazhko frequency).
Since the 12.5 fm spacing remains unexplained,
we propose an alternative solution based on the additional modes
f1=3.2701 d-1 and
f2=4.2738 d-1 and the combination terms
f0+f1=5.7847 d-1 and
f0+f2=6.7884 d-1. We find for the third time a frequency ratio
(
f0/f2=0.588) that could be explained with the ratio between the fundamental and the second overtone radial modes.
These mode identifications are a new contribution to the debate on the excitation of the second overtone in RR Lyr stars (e.g., Walker & Nemec 1996; Olech & Moskalik 2009; Soszynski et al. 2003; Alcock et al. 1996; Kaluzny et al. 2000). We also note that the excitation of non-consecutive radial modes would be a new result for RR Lyr stars, so far sporadically observed in Cepheids (Soszynski et al. 2008).
5 Conclusions
The second detailed analysis of the CoRoT data on RR Lyrae variables allowed us to advance in the definition of their pulsational characteristics. It is confirmed that the Blazhko effect can span different ranges in the variations, both absolute and relative, of the amplitude and phase modulations. Moreover, there is new evidence that the Blazhko period is subjected to long-term variations, as can be directly detected from the consecutive cycles observed in the CoRoT LRc01. The mechanisms invoked to explain the Blazhko effect should reproduce ``the strictly regular behavior of the modulation observed in many Blazhko stars'' (Jurcsik 2009). This requirement should now be reconsidered in a slightly different way. The real mechanism must be able to reproduce both the regular structure of the sidepeaks in the frequency spectra and the observed variability on a long-term scale. In this context, it can be useful to stress that CoRoT 101128793, similar to DM Cyg (Jurcsik et al. 2009a) and RR Gem (Jurcsik et al. 2005), shows a bump on the rising branch of the light curve. These bumps are probably connected with hypersonic shock waves (Chadid et al. 2008), and the spreading of the residuals suggests a link between pulsation and atmosphere dynamics. More precisely, this could be the clue to an interaction between the Blazhko phenomenon and the atmosphere's dynamics (Guggenberger & Kolenberg 2006), since monoperiodic RR Lyrae stars also have very regular light curves in the presence of this bump (Poretti 2001).
The other relevant result disclosed by the CoRoT data is the excitation
of additional modes. A reanalysis of the V1127 Aql and MW Lyr
cases
seems to indicate that there is a narrow frequency interval where a few
modes are excited. The recurrence of the ratio 0.58-0.59 between one of
these modes and the fundamental radial mode suggests the possibility of
the (preferred) excitation of the second overtone.
The possible interplay between this type of double-mode pulsation and
the Blazhko effect
deserves further theoretical investigation. The Blazhko effect does not
modulate the
![]() term and this is particularly relevant
in this scenario.
Moreover, CoRoT detected other very significant
peaks in the oscillation spectra of V1127 Aql and CoRoT 101128793, thus disclosing the evidence that nonradial
modes are excited in horizontal branch stars. The theoretical prediction of these modes is the
new challenge to the pulsation models of RR Lyrae stars launched by CoRoT.
term and this is particularly relevant
in this scenario.
Moreover, CoRoT detected other very significant
peaks in the oscillation spectra of V1127 Aql and CoRoT 101128793, thus disclosing the evidence that nonradial
modes are excited in horizontal branch stars. The theoretical prediction of these modes is the
new challenge to the pulsation models of RR Lyrae stars launched by CoRoT.
This research has made use of the Exo-Dat database, operated at LAM-OAMP, Marseille, France, on behalf of the CoRoT/Exoplanet programme. M.C. thanks F. Baudin and J. Debosscher for their help on the data reduction. J.M.B., M.P., and R.Sz. acknowledge the support of the ESA PECS projects Nos. 98022 & 98114. K.K. and E.G. acknowledge the projects FWF T359 and FWF P19962, and E.P. the Italian ESS project (contract ASI/INAF/I/015/07/0, WP 03170) for financial support.
References
- Alcock, C., Allsman, R. A., Axelrod, T. S., et al. 1996, AJ, 111, 1146 [NASA ADS] [CrossRef] [Google Scholar]
- Auvergne, M., Bodin, P., Boisnard, L., et al. 2009, A&A, 506, 411 [NASA ADS] [CrossRef] [EDP Sciences] [Google Scholar]
- Baglin, A., Auvergne, M., Barge, P., et al. 2006, in The CoRoT Mission, Pre-Launch Status, Stellar Seismology and Planet Finding, ed. M. Fridlund, A. Baglin, J. Lochard, & L. Conroy, ESA Publications Division, Nordwijk, Netherlands, ESA SP-1306, 33 [Google Scholar]
- Benko, J. M., Paparó, M., Szabó, R., et al. 2009, in Stellar Pulsation: Challanges for Theory and Observation, ed. J. A. Guzik, & P. Bradley, IAP Conf. Ser., 1170, 273 [Google Scholar]
- Bono, G., Caputo, F., Castellani, V., et al. 2003, MNRAS, 344, 1097 [NASA ADS] [CrossRef] [Google Scholar]
- Carpino, M., Milani, A., & Nobili, A. M. 1987, A&A, 181, 182 [NASA ADS] [Google Scholar]
- Chadid, M., Baglin, A., Benko, J., et al. 2009, in Stellar Pulsation: Challanges for Theory and Observation, ed. J. A. Guzik, & P. Bradley, IAP Conf. Ser., 1170, 235 [Google Scholar]
- Chadid, M., Benko, J. M., Szabó, R., et al. 2010, A&A, 510, A39 [NASA ADS] [CrossRef] [EDP Sciences] [Google Scholar]
- Chadid, M., Vernin, J., & Gillet, D. 2008, A&A, 491, 537 [NASA ADS] [CrossRef] [EDP Sciences] [Google Scholar]
- Chadid, M., Wade, G. A., Shorlin, S. L. S., & Landstreet, J. D. 2004, A&A, 413, 1087 [NASA ADS] [CrossRef] [EDP Sciences] [Google Scholar]
- Debosscher, J., Sarro, L. M., López, M., et al. 2009, 506, 519 [Google Scholar]
- Deleuil, M., Meunier, J. C., Moutou, C., et al. 2009, AJ, 138, 649 [NASA ADS] [CrossRef] [Google Scholar]
- Dziembowski, W. A., & Mizierski, T. 2004, Acta Astron., 54, 363 [NASA ADS] [CrossRef] [Google Scholar]
- Guggenberger, E., & Kolenberg, K. 2006, CoAst, 148, 21 [Google Scholar]
- Jurcsik, J. 2009, in Stellar Pulsation: Challanges for Theory and Observation, ed. J. A. Guzik, & P. Bradley, IAP Conf. Ser., 1170, 286 [Google Scholar]
- Jurcsik, J., Sódor, Á., Váradi, M., et al. 2005, A&A, 430, 104 [Google Scholar]
- Jurcsik, J., Sódor, Á., Hurta, Zs., et al. 2008, MNRAS, 391, 164 [NASA ADS] [CrossRef] [Google Scholar]
- Jurcsik, J., Hurta, Zs., Sódor, Á., et al. 2009a, MNRAS, 397, 350 [NASA ADS] [CrossRef] [Google Scholar]
- Jurcsik, J., Sódor, Á., Szeidl, B., et al. 2009b, MNRAS, 400, 1006 [NASA ADS] [CrossRef] [Google Scholar]
- Kaluzny, J., Olech, A., Thompson, I., et al. 2000, A&AS, 143, 215 [Google Scholar]
- Kolenberg, K., & Bagnulo, S. 2009, in Stellar Pulsation: Challanges for Theory and Observation, ed. J. A. Guzik, & P. Bradley, IAP Conf. Ser., 1170, 281 [Google Scholar]
- Kolenberg, K., Smith, H. A., Gazeas, K. D., et al. 2006, A&A, 459, 577 [Google Scholar]
- Kolenberg, K., Szabó, R., Kurtz, D., et al. 2010, ApJ, 713, L198 [NASA ADS] [CrossRef] [Google Scholar]
- Kolláth, Z. 1990, Occ. Tech. Notes Konkoly Obs., Budapest, No. 1 [Google Scholar]
- Kolláth, Z., Buchler, J., Szabó, R., & Csubry, Z. 2002, A&A, 385, 932 [NASA ADS] [CrossRef] [EDP Sciences] [Google Scholar]
- Kovács, G. 2009, in Stellar Pulsation: Challanges for Theory and Observation, ed. J. A. Guzik, & P. Bradley, IAP Conf. Ser., 1170, 261 [Google Scholar]
- Kurtz, D. W. 1982, MNRAS, 200, 497 [NASA ADS] [Google Scholar]
- LaCluyzé, A., Smith, H. A., Gill, E.-M., et al. 2005, AJ, 127, 1653 [Google Scholar]
- Le Borgne, J. F., Paschke, A., Vandenbroere, J., et al. 2007, A&A, 476, 307 [NASA ADS] [CrossRef] [EDP Sciences] [Google Scholar]
- Lenz, P., & Breger, M. 2005, CoAst, 146, 53 [Google Scholar]
- Marconi, M. 2009, in Stellar Pulsation: Challanges for Theory and Observation, ed. J. A. Guzik, & P. Bradley, IAP Conf. Ser., 1170, 223 [Google Scholar]
- Marconi, M., & Clementini, G. 2005, AJ, 129, 2257 [NASA ADS] [CrossRef] [Google Scholar]
- Moskalik, P., & Buchler, J. R. 1990, ApJ, 355, 590 [NASA ADS] [CrossRef] [Google Scholar]
- Olech, A., & Moskalik, P. 2009, , 494, L17 [Google Scholar]
- Poretti, E. 2001, A&A, 371, 986 [NASA ADS] [CrossRef] [EDP Sciences] [Google Scholar]
- Shibahashi, H. 2000, in The Impact of Large-Scale Surveys on Pulsating Star Research, ed. L. Szabados, & D. Kurtz, ASP Conf. Ser., 203, 299 [Google Scholar]
- Sódor, Á., Szeidl, B., & Jurcsik, J. 2007, A&A, 469, 1033 [NASA ADS] [CrossRef] [EDP Sciences] [Google Scholar]
- Soszynski, I., Udalski, A., Szymanski, M., et al. 2003, , 53, 93 [Google Scholar]
- Soszynski, I., Poleski, R., Udalski, A., et al. 2008, , 58, 163 [Google Scholar]
- Stothers, R. B. 2006, ApJ, 652, 643 [NASA ADS] [CrossRef] [Google Scholar]
- Szabó, R., Kolláth, Z., & Buchler, J. R. 2004, A&A, 425, 627 [NASA ADS] [CrossRef] [EDP Sciences] [Google Scholar]
- Szabó, R., Paparó, M., Benko, J., et al. 2009, in Stellar Pulsation: Challanges for Theory and Observation, ed. J. A. Guzik, & P. Bradley, IAP Conf. Ser., 1170, 291 [Google Scholar]
- Szeidl, B., & Jurcsik, J. 2009, CoAst, 160, 17 [Google Scholar]
- Vanicek, P. 1971, Ap&SS 12, 10 [NASA ADS] [CrossRef] [Google Scholar]
- Walker, A. R., & Nemec, J. M. 1996, AJ, 112, 2026 [NASA ADS] [CrossRef] [Google Scholar]
- Weiss, W. W. 2006, in The CoRoT Mission, Pre-Launch Status, Stellar Seismology and Planet Finding, ed. M. Fridlund, A. Baglin, J. Lochard, & L. Conroy, ESA Publications Division, Nordwijk, Netherlands, ESA SP, 1306, 93 [Google Scholar]
Footnotes
- ... modes
- The CoRoT space mission was developed and is operated by the French space agency CNES, with participation of ESA's RSSD and Science Programmes, Austria, Belgium, Brazil, Germany, and Spain.
- ...
- The CoRoT timeseries, table of the photometry, Tables 1 and 2 are only available in electronic form at the CDS via anonymous ftp to cdsarc.u-strasbg.fr (130.79.128.5) or via http://cdsarc.u-strasbg.fr/viz-bin/qcat?J/A+A/520/A108
- ...
RR Lyrae-CoRoTeam
- The dedicated website is http://fizeau.unice.fr/corot.
- ...)
- We note that there is a 1 d-1 spacing between the terms of the first couple and between those of the second one. This spacing is always a bit suspicious for observations collected mostly from one site, but we consider the frequency detection performed by Jurcsik et al. (2008) as a well-established one.
All Figures
|
|
Figure 1: Top panel: the light curve obtained by removing the main frequency and its harmonics from the original data showing a long-term drift and a jump. Middle panel: the light curve of the residuals is corrected from the long-term drift and the jump. Bottom panel: the final light curve of CoRoT 101128793 is an example of the continuous, excellent quality monitoring of stars in the CoRoT exoplanetary field. |
| Open with DEXTER | |
| In the text | |
|
|
Figure 2: Subsequent steps in the detection of frequencies in the amplitude spectra of CoRoT 101128793. |
| Open with DEXTER | |
| In the text | |
|
|
Figure 3: Upper panel: the CoRoT data folded with f0, original (top) and after subtracting the 79 frequencies (bottom). Left panel, lower row: the amplitudes of the n f0 terms. Right panel, lower row: the observed triplet structure around n f0 terms. The filled circles indicate the component with the greatest amplitude in the triplet, the empty circles the second in amplitude, the star the third. |
| Open with DEXTER | |
| In the text | |
|
|
Figure 4: Evidence of the long-term variations in the CoRoT 101128793 light curve. Top panel: the magnitudes at maximum (upper curve) and minimum (lower curve) brightness in the different cycles. Middle panel: the amplitudes of the f0 component (upper curve) and the period values (lower curve). Reference line is displayed to show the long term variation in amplitude. Bottom panel: the power spectrum of the magnitudes at maximum brightness. |
| Open with DEXTER | |
| In the text | |
|
|
Figure 5: Petersen diagram based on linear convective RR Lyrae models. The symbols denote different metallicities. The black square shows the position of CoRoT 101128793, assuming that the frequency f2 is the second overtone radial mode. |
| Open with DEXTER | |
| In the text | |
Copyright ESO 2010
Current usage metrics show cumulative count of Article Views (full-text article views including HTML views, PDF and ePub downloads, according to the available data) and Abstracts Views on Vision4Press platform.
Data correspond to usage on the plateform after 2015. The current usage metrics is available 48-96 hours after online publication and is updated daily on week days.
Initial download of the metrics may take a while.