| Issue |
A&A
Volume 518, July-August 2010
Herschel: the first science highlights
|
|
|---|---|---|
| Article Number | A55 | |
| Number of page(s) | 16 | |
| Section | Cosmology (including clusters of galaxies) | |
| DOI | https://doi.org/10.1051/0004-6361/200913843 | |
| Published online | 02 September 2010 | |
A multiwavelength strong lensing analysis of baryons and dark matter in the dynamically active cluster AC 114
M. Sereno1,2,3 - M. Lubini1 - Ph. Jetzer1
1 - Institut für Theoretische Physik, Universität Zürich,
Winterthurerstrasse 190, 8057 Zürich, Switzerland
2 - Dipartimento di Fisica, Politecnico di Torino, Corso Duca degli
Abruzzi 24, 10129 Torino, Italy
3 - INFN, Sezione di Torino, via Pietro Giuria 1, 10125 Torino, Italy
Received 10 December 2009 / Accepted 20 April 2010
Abstract
Context. Strong lensing studies can provide detailed
mass maps of the inner regions even in dynamically active galaxy
clusters.
Aims. We illustrate the important role of a proper
modelling of the intracluster medium, i.e., the main baryonic
component. We demonstrate that the addition of a new contribution
accounting for the gas can increase the statistical significance of the
lensing model.
Methods. We propose a parametric method for strong
lensing analyses that exploits multiwavelength observations. The mass
model accounts for cluster-sized dark matter halos, galaxies (whose
stellar mass can be obtained from optical analyses), and the
intracluster medium. The gas distribution is fitted to lensing data
exploiting prior knowledge from X-ray observations. This gives an
unbiased insight into each matter component and allows us to study the
dynamical status of a cluster. The method was applied to
AC 114, an irregular X-ray cluster.
Results. We find positive evidence of dynamical
activity, the dark matter distribution being shifted and rotated with
respect to the gas. On the other hand, the dark matter follows the
galaxy density in terms of both shape and orientation, illustrating the
collisionless nature of dark matter. The inner region (
![]() 250 kpc)
is underluminous in optical bands, whereas the gas fraction (
250 kpc)
is underluminous in optical bands, whereas the gas fraction (![]()
![]() )
slightly exceeds typical values. Evidence of lensing and X-ray suggests
that the cluster develops in the plane of the sky and is not affected
by the lensing over-concentration bias. Despite the dynamical activity,
the matter distribution seems to agree with predictions of N-body
simulations. An universal cusped profile provides a good description of
either the overall or the dark matter distribution, whereas theoretical
scaling relations seem to be accurately fitted.
)
slightly exceeds typical values. Evidence of lensing and X-ray suggests
that the cluster develops in the plane of the sky and is not affected
by the lensing over-concentration bias. Despite the dynamical activity,
the matter distribution seems to agree with predictions of N-body
simulations. An universal cusped profile provides a good description of
either the overall or the dark matter distribution, whereas theoretical
scaling relations seem to be accurately fitted.
Key words: galaxies: clusters: general - X-rays: galaxies: clusters - gravitational lensing: strong
1 Introduction
Understanding the formation and evolution of galaxy clusters is an open problem in modern astronomy. On the theoretical side, N-body simulations are now able to make detailed statistical predictions on dark matter (DM) halo properties (Duffy et al. 2008; Bullock et al. 2001; Diemand et al. 2004; Navarro et al. 1997). On the observational side, multiwavelength observations from the radio to the optical bands to X-ray observations of galaxy clusters can provide deep insight into real features (Clowe et al. 2004; Smith et al. 2005; Hicks et al. 2006; De Filippis et al. 2005). Results are impressive on both sides, but additional work is still required. Large numerical simulations still cannot efficiently incorporate gas physics, whereas combining multiwavelength data sets can be misleading if the employed hypotheses (hydrostatic and/or dynamical equilibrium, spherical symmetry, just to list a couple of very common ones) do not hold. Areas of disagreement between predictions and measurements therefore persist.
We consider a way of exploiting multiwavelength data sets in strong lensing data analyses. Strong lensing modelling can give detailed maps of the inner regions of galaxy clusters without relying on hypotheses about equilibrium and is negligibly affected by projection effects caused by large-scale fields or aligned structures. However, massive lensing clusters represent a biased sample for statistical studies (Hennawi et al. 2007; Oguri & Blandford 2009). Multiwavelength analyses of lensing galaxy clusters have been exploited following different approaches. Smith et al. (2005) compared X-ray and strong lensing maps of intermediate redshift clusters to infer equilibrium criteria. Detailed lensing features can reveal dynamical activity even in apparently relaxed clusters (Miranda et al. 2008). Investigations of the bullet cluster showed that dark matter follows the collisionless galaxies, whereas the gas is stripped away by mergers (Clowe et al. 2004). Comparison of snapshots of active clusters taken with weak lensing, X-ray surface brightness, or galaxy luminosity revealed the relative displacement of the different components at different stages of merging (Okabe & Umetsu 2008).
The usual way to differentiate dark matter from baryons in lensing analyses involves first obtaining a map of the total matter distribution fitting the lensing features and then subtracting the gas contribution as inferred from X-ray observations (Bradac et al. 2008). The total mass map can be obtained with either parametric models in which the contribution from cluster-sized DM halos can be considered with the main galactic DM halos (Limousin et al. 2008; Natarajan et al. 1998) or non-parametric analyses, where dark matter meso-structures and galactic contributions are seen as deviations from smooth-averaged profiles (Saha et al. 2007). Mass in stars and stellar remnants is estimated from galaxy luminosity assuming suitable stellar mass to light ratios. These approaches have obvious merits but also some unavoidable shortcomings.
Collisionless matter and gas are displaced in dynamical active clusters. Furthermore, gas and dark matter profiles usually have different slopes in relaxed clusters. Since the gas follows the potential, its distribution is usually rounder than dark matter, so that even if the intracluster medium (ICM) and the dark matter are intrinsically aligned their projected masses on the sky have different orientations and ellipticities (Stark 1977). These features can be missed by usual approaches since the total matter profile may no fully account for the properties of each component. In fact, the number of model parameters may indeed be insufficient to reproduce all the details, whereas in non-parametric approaches the fitting procedure is weighted to favour smooth distributions against clumpy ones, a procedure that may remove small scale details such as gas and dark matter that are off-centre by few arcseconds.
We take an additional step by exploiting a parametric model that has three kind of components: cluster-sized dark matter halos; galaxy-sized (dark plus stellar) matter halos; and cluster-sized gas distribution. In our approach, the ICM distribution is embedded in the strong lensing modelling from the very beginning to avoid unpleasant biases. To reduce the total number of parameters, the X-ray surface brightness data are fully exploited so that the gas contribution is fixed within the observational uncertainties. This allows us to constrain the mass model using X-ray data without relying on the assumption of hydrostatic equilibrium. As far as the stellar component is concerned, we follow the usual approach: total galaxy masses (DM plus baryons) are derived using the lensing fitting procedure, whereas the stellar contribution is inferred from luminosity. We recognise that the main advantage of this approach is that we are able to infer directly the dark matter mass. This is the component most accurately (and under some points of view, the only one) constrained in numerical simulations, so that our novel approach aids the comparison with their theoretical predictions. Furthermore, we will be able to compare the gas distribution with the dark matter, which is an obvious improvement to the usual way of comparing total projected mass distributions with surface brightness maps.
|
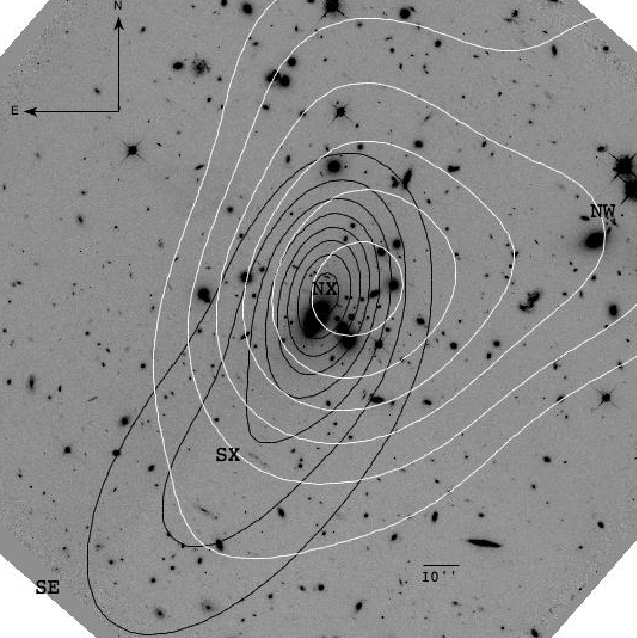
Figure 1:
Grey-scale archive HST/ACS image (F850 band) of the
core of AC 114. North is up and east is to the left. The field
covers |
| Open with DEXTER | |
Table 1:
Properties of the galaxy distributions, modelled as ![]() profiles, within circular regions of outer radius
profiles, within circular regions of outer radius ![]() .
.
We apply our method to the cluster AC 114, which
exhibits a prototypical example of the Butcher-Oemler effect with a
higher fraction of blue, late-type galaxies than in lower redshift
clusters, rising to 60% outside the core region (Couch
et al. 1998). The fraction of interacting galaxies (![]() 12%) is also
high (Couch et al. 1998).
Krick & Bernstein (2007)
classified AC 114 as a Bautz-Morgan type II-III cluster, which
indicates that it has a young dynamical age. The cluster is elongated
significantly in the southeast-northwest direction (Couch et al. 2001) (see
Fig. 1).
There are two main reasons for studying this cluster. First, the core
region of AC 114 is rich in multiple images, allowing a very
detailed analysis. Redshift contrast between multiply lensed sources
can provide a good measurement of the enclosed mass at two different
radii, thus providing a good estimate of the mass profile in-between (Saha & Read 2009). The
same kind of information can be obtained by also combining strong and
weak lensing data, but multiply lensed sources allow us to consistently
derive the profile slope without mixing systematics from different
methods. Furthermore, there are several images very near the cluster
centre that allow us to accurately determine the radial slope of the
matter distribution in the very inner regions. Despite the abundance of
data, AC 114 has been the target of only a couple lensing
investigations. In the first one by Natarajan
et al. (1998), which was later improved by Campusano et al. (2001),
weak lensing constraints were also used and the mass modelling, which
was inspired by the optical galaxy distribution, considered a main
clump and two additional cluster substructures (see Appendix B). The second
lensing analysis, inspired by the X-ray images, associated each of the
two X-ray emitting regions with a dark matter clump separately in
hydrostatic equilibrium (De Filippis
et al. 2004). Both approaches reproduced the image
positions with an accuracy of
12%) is also
high (Couch et al. 1998).
Krick & Bernstein (2007)
classified AC 114 as a Bautz-Morgan type II-III cluster, which
indicates that it has a young dynamical age. The cluster is elongated
significantly in the southeast-northwest direction (Couch et al. 2001) (see
Fig. 1).
There are two main reasons for studying this cluster. First, the core
region of AC 114 is rich in multiple images, allowing a very
detailed analysis. Redshift contrast between multiply lensed sources
can provide a good measurement of the enclosed mass at two different
radii, thus providing a good estimate of the mass profile in-between (Saha & Read 2009). The
same kind of information can be obtained by also combining strong and
weak lensing data, but multiply lensed sources allow us to consistently
derive the profile slope without mixing systematics from different
methods. Furthermore, there are several images very near the cluster
centre that allow us to accurately determine the radial slope of the
matter distribution in the very inner regions. Despite the abundance of
data, AC 114 has been the target of only a couple lensing
investigations. In the first one by Natarajan
et al. (1998), which was later improved by Campusano et al. (2001),
weak lensing constraints were also used and the mass modelling, which
was inspired by the optical galaxy distribution, considered a main
clump and two additional cluster substructures (see Appendix B). The second
lensing analysis, inspired by the X-ray images, associated each of the
two X-ray emitting regions with a dark matter clump separately in
hydrostatic equilibrium (De Filippis
et al. 2004). Both approaches reproduced the image
positions with an accuracy of ![]()
![]() ,
but neither used all of the image systems with confirmed spectroscopic
redshifts. There is therefore room for substantial improvement.
,
but neither used all of the image systems with confirmed spectroscopic
redshifts. There is therefore room for substantial improvement.
Second, AC 114 exhibits significant evidence of being an ongoing merging. We study in detail the dark matter distribution in a dynamical active cluster, constraining at the same time the properties of the dark matter and the evolution of this interesting cluster. The lensing analysis of the cluster will allow us to compare observations with theoretical predictions.
The paper is as follows. In Sect. 2 we discuss the
galaxy distribution and present the measurements of luminosity and
number densities. We also consider the stellar mass inferred from the
measured luminosity. Section 3 describes our
dynamics analysis in which we obtain an updated estimate of the cluster
mass that is later compared to the lensing results. In Sect. 4, we review
literature results about the X-ray observations of the cluster.
Section 5
and 6
are devoted to the lensing analysis. In Sect. 5, we review the
optical data and the parametric models employed; in Sect. 6, we present our
statistical investigation. Section 7 lists the
results obtained with our multiwavelength approach, whereas
Sect. 8
discusses some results in the context of theoretical expectations.
Section 9
discusses our final considerations. In Appendix A, we detail our
procedure to estimate the galaxy velocity dispersion ![]() .
Appendix B
is devoted to an analysis of substructures based on classical optical
methods. Projection effects are dealt with in Appendix C.
Throughout the paper, we assume a
.
Appendix B
is devoted to an analysis of substructures based on classical optical
methods. Projection effects are dealt with in Appendix C.
Throughout the paper, we assume a ![]() CDM cosmology with density
parameters
CDM cosmology with density
parameters ![]() and
and ![]() ,
and a Hubble constant H
,
and a Hubble constant H
![]() ,
where h=0.7. This implies a linear scale of
,
where h=0.7. This implies a linear scale of ![]() per arcsec at the cluster redshift z=0.315. We
assume the reference mass and radius of the cluster to be M200
and r200, i.e., the mass and
the radius containing an overdensity of 200 times the critical one. We
quote uncertainties at the 68.3% confidence level.
per arcsec at the cluster redshift z=0.315. We
assume the reference mass and radius of the cluster to be M200
and r200, i.e., the mass and
the radius containing an overdensity of 200 times the critical one. We
quote uncertainties at the 68.3% confidence level.
2 Galaxy distribution
![\begin{figure}
\par\includegraphics[width=7cm]{13843fg2.eps}\includegraphics[wid...
...s[width=7cm]{13843fg4.eps}\includegraphics[width=7cm]{13843fg5.eps}
\end{figure}](/articles/aa/full_html/2010/10/aa13843-09/img78.png)
|
Figure 2:
Surface matter density distribution in the core region of
AC 114, in units of the projected critical density for a
source redshit at |
| Open with DEXTER | |
The galaxy catalogue we made use of is taken from Couch et al. (1998, see their table 4), who morphologically classified galaxies recorded on images taken with WFPC2 at HST down to R702=23.00. The galaxy distribution in the inner regions is quite irregular, substructures being detected with different methods, see Appendix B.
Here we analyse the galaxy density distribution by considering
either the luminosity or the number density. Our method is as follows.
We first smooth the spiky density distribution by convolving with a
Gaussian kernel whose fixed width is based on the mean distance between
galaxies in the region of interest. The characteristics of the surface
distribution are then obtained by considering a sample of maps
generated by resampling the data of the original distribution. This
takes into account the finite size error. For each map, we perform a
parametric fit with Poisson weights to an elliptical density
distribution. Parameter central values and confidence intervals are
finally obtained by considering median and quantile ranges of the final
population of the best-fit model parameters. Throughout the paper, we
consider a coordinate system in the plane of the sky, ![]() ,
centred on the BCG galaxy and aligned with the equatorial system with
increasing numbers to both the west and north of the central galaxy. As
a surface density model, we assume a projected King-like
,
centred on the BCG galaxy and aligned with the equatorial system with
increasing numbers to both the west and north of the central galaxy. As
a surface density model, we assume a projected King-like ![]() distribution
distribution
![\begin{displaymath}
\Sigma = \Sigma_0 \left[ 1+(\theta_{\rm ell}/\theta_{\rm P})^2\right]^{(1-3\beta)/2} + \Sigma_{\rm B},
\end{displaymath}](/articles/aa/full_html/2010/10/aa13843-09/img80.png)
where
2.1 Stellar mass
The baryonic contribution of stars and stellar remnants can be
estimated by converting galaxy luminosities into stellar masses. We
convert R702 into infrared K
luminosity, which is less sensitive to ongoing star formation and is a
more reliable tracer of the stellar mass distribution, mostly following
Smith
et al. (2005,2002). As a first step, we
corrected R702 photometry
reported in the SExtractor catalogue of Couch
et al. (1998) for an overestimate of the background
as discussed in Smith et al.
(2005) and then converted R702
photometry to Cousin R, using suitable corrections
per morphological type (Smith
et al. 2002). We then obtained K
magnitudes by subtracting the typical (R-K)
colours of cluster ellipticals and spirals corrected for reddening (Smith et al. 2002).
Finally, we converted to rest-frame luminosities by adopting ![]() (Binney & Merrifield 1998),
a Galaxy extinction of AK=0.023
(Schlegel et al. 1998),
and using K-corrections from Mannucci
et al. (2001).
(Binney & Merrifield 1998),
a Galaxy extinction of AK=0.023
(Schlegel et al. 1998),
and using K-corrections from Mannucci
et al. (2001).
To convert stellar luminosity into stellar mass we followed Lin et al. (2003): for
ellipticals, we took the estimates of the central mass-to-light ratio
as a function of galaxy luminosity from Gerhard
et al. (2001); and for spiral galaxies, we used the
values in Bell & de Jong (2001).
Estimating the mass-to-light ratios is the major source of uncertainty:
different stellar population models predict stellar mass-to-light
ratios as different as ![]() and
and ![]() (Cole et al. 2001).
Additional errors are caused by either interlopers included in the
catalogue or missed member galaxies. Furthermore, we did not consider
stars contributing to the intracluster light, whose total fraction in
AC 114 is
(Cole et al. 2001).
Additional errors are caused by either interlopers included in the
catalogue or missed member galaxies. Furthermore, we did not consider
stars contributing to the intracluster light, whose total fraction in
AC 114 is ![]() in r and
in r and ![]() in B (Krick
& Bernstein 2007). It is then safe to consider an
overall uncertainty
in B (Krick
& Bernstein 2007). It is then safe to consider an
overall uncertainty ![]() 40%.
The projected mass density in stars is plotted in Fig. 2. We
performed the same kind of analysis described above for the
number/luminosity density. Alike the luminosity density, the
distribution of the mass in stars is elongated from northwest to
southeast. The resulting integrated mass profile in the inner core is
plotted in Fig. 5.
The parameters of the distribution modelled as a King profile are
reported in Table 1.
40%.
The projected mass density in stars is plotted in Fig. 2. We
performed the same kind of analysis described above for the
number/luminosity density. Alike the luminosity density, the
distribution of the mass in stars is elongated from northwest to
southeast. The resulting integrated mass profile in the inner core is
plotted in Fig. 5.
The parameters of the distribution modelled as a King profile are
reported in Table 1.
3 Dynamics
3.1 Virial mass
A dynamical estimate of the total mass can be derived using the virial
theorem. Assuming the cluster to be approximately spherical,
non-rotating, and in equilibrium, the virial mass can be expressed as (Binney & Tremaine 1987)

where
and Rij is the projected distance between galaxies i and j. The surface term
Combining information about galaxy position and velocity, we
derived estimates of ![]() for the cluster mean redshift and
for the cluster mean redshift and ![]() for the cluster velocity dispersion (see Appendix A). Non-members can
strongly affect the mass estimate. Inclusion of interlopers that are
currently infalling toward the cluster along filaments causes the
overestimate of the harmonic mean radius, and, at the same time, the
underestimate of the velocity dispersion. Using early-type galaxies as
tracers might substantially reduce the interloper contamination in the
virial mass estimate (Girardi
& Mezzetti 2001; Biviano et al. 2006). In
our approach, we accounted for this issue by estimating the interloper
fraction statistically. The error in
for the cluster velocity dispersion (see Appendix A). Non-members can
strongly affect the mass estimate. Inclusion of interlopers that are
currently infalling toward the cluster along filaments causes the
overestimate of the harmonic mean radius, and, at the same time, the
underestimate of the velocity dispersion. Using early-type galaxies as
tracers might substantially reduce the interloper contamination in the
virial mass estimate (Girardi
& Mezzetti 2001; Biviano et al. 2006). In
our approach, we accounted for this issue by estimating the interloper
fraction statistically. The error in ![]() was estimated by applying a statistical jackknife to the galaxy sample
that passed the shifting gapper cut. The estimate of the cluster mass
is then
was estimated by applying a statistical jackknife to the galaxy sample
that passed the shifting gapper cut. The estimate of the cluster mass
is then ![]() .
.
An alternative mass estimator can be based entirely on the
line-of-sight velocity dispersion. As inferred from fitting to
simulated clusters, the ![]() scaling relation is remarkably independent of cosmology. Using a cubic
relation, Biviano et al.
(2006) obtained
scaling relation is remarkably independent of cosmology. Using a cubic
relation, Biviano et al.
(2006) obtained

The intrinsic velocity distribution of early-type galaxies may be slightly biased relative to that of the dark matter particles (Biviano et al. 2006), so that when using Eq. (4) it is safer not to distinguish between morphological types. To properly apply the
The concentration parameter can also be estimated using
scaling relations fitted to numerical simulations as well. According to
the scaling ![]() (Biviano
et al. 2006; Navarro et al. 1997),
where
(Biviano
et al. 2006; Navarro et al. 1997),
where ![]() is measured within an aperture radius of
is measured within an aperture radius of ![]() ,
we find that
,
we find that ![]() .
.
4 X-ray observations
Table 2: Properties of the projected gas distribution as inferred from the X-ray analysis.
AC 114 has a strongly irregular X-ray morphology (De Filippis et al. 2004),
see Fig. 1.
The cluster does not exhibit a single X-ray peak. Noticeable emission
is associated with the cluster cD galaxy but the centroid of the
overall X-ray emission is located about ![]() northwest of the cD galaxy. Two principal components stand
out: the cluster, roughly centred on the optical position, and a
diffuse filament that spreads southeast for approximately
northwest of the cD galaxy. Two principal components stand
out: the cluster, roughly centred on the optical position, and a
diffuse filament that spreads southeast for approximately ![]() (
(![]()
![]() ), connecting the cluster core
with the location of the SE clump (see Appendix B).
), connecting the cluster core
with the location of the SE clump (see Appendix B).
Additional signs of dynamical activity are observed northeast
close to the cluster centre (see Fig. 2): a cold
front at ![]() (
(![]()
![]() )
from the core centre and a likely shock front at
)
from the core centre and a likely shock front at ![]()
![]() (
(![]()
![]() ).
).
The tail and the fronts might be independent phenomena.
Diffuse X-ray emission is detected near the SE clump, whereas no X-ray
emission is associated with the NW clump. The NE substructure detected
with the ![]() -test (see
Appendix B)
was not targeted by X-ray observations. One possible scenario is that
the SE clump, in its motion from the northwest through the cluster, has
been ram-pressure stripped of most of its intra-group gas, now still
visible as the soft southern tail. The interaction with the cluster
might have also caused the asymmetrical stretch of the cluster emission
detected toward the southeast. The NW clump might have been stripped as
well.
-test (see
Appendix B)
was not targeted by X-ray observations. One possible scenario is that
the SE clump, in its motion from the northwest through the cluster, has
been ram-pressure stripped of most of its intra-group gas, now still
visible as the soft southern tail. The interaction with the cluster
might have also caused the asymmetrical stretch of the cluster emission
detected toward the southeast. The NW clump might have been stripped as
well.
The cluster bolometric luminosity is ![]() (De Filippis et al. 2004).
Based on scaling relations between luminosity and velocity dispersion (Rykoff et al. 2008), we
would expect
(De Filippis et al. 2004).
Based on scaling relations between luminosity and velocity dispersion (Rykoff et al. 2008), we
would expect ![]() ,
which is higher than the observed value. This might suggest that on the
one hand the gas has yet to settle in the cluster potential well and,
on the other hand, the clumpy structure of AC 114 might lead
to an overestimate of the velocity dispersion.
,
which is higher than the observed value. This might suggest that on the
one hand the gas has yet to settle in the cluster potential well and,
on the other hand, the clumpy structure of AC 114 might lead
to an overestimate of the velocity dispersion.
4.1 Projected mass density
The gas mass can be estimated from the X-ray emission. The surface
brightness was modelled in De
Filippis et al. (2004) as a sum of two elliptical
isothermal ![]() -profiles,
a main core plus an extended off-centred south-east tail. To infer the
projected mass associated with each component, we had to project the
corresponding 3D ellipsoid, which were previously obtained by
deprojecting the observed intensity map (see Appendix C). The resulting
projected density profile for each component follows a King-like
-profiles,
a main core plus an extended off-centred south-east tail. To infer the
projected mass associated with each component, we had to project the
corresponding 3D ellipsoid, which were previously obtained by
deprojecting the observed intensity map (see Appendix C). The resulting
projected density profile for each component follows a King-like ![]() distribution (see Eq. (1));
parameters are listed in Table 2. To obtain the
corresponding three-dimensional electron density, we took care to
deproject the surface brightness maps of the main clump and the tail
separately. We then projected back the two separate distributions to
the lens plane (see Appendix C for details).
Since we treated the main clump and the tail separately, the only
uncertainty in the projected mass caused by the casting method is then
a correction geometrical factor depending on the unknown intrinsic
axial ratios and orientation angles. The projected mass map is plotted
in Fig. 2.
The integrated ICM mass is plotted in Fig. 5.
distribution (see Eq. (1));
parameters are listed in Table 2. To obtain the
corresponding three-dimensional electron density, we took care to
deproject the surface brightness maps of the main clump and the tail
separately. We then projected back the two separate distributions to
the lens plane (see Appendix C for details).
Since we treated the main clump and the tail separately, the only
uncertainty in the projected mass caused by the casting method is then
a correction geometrical factor depending on the unknown intrinsic
axial ratios and orientation angles. The projected mass map is plotted
in Fig. 2.
The integrated ICM mass is plotted in Fig. 5.
The main sources of error in the gas mass are the projection
effects and the assumption of isothermal emission. A lack of knowledge
about the intrinsic axial ratios and the orientation of the gas
distribution causes an uncertainty in the overall normalization of the
projected gas density. In Appendix C, we estimate
this uncertainty to be of the order of ![]() 18%.
18%.
As expected from the several indications of dynamical
activity, there is no evidence of a central cool core. The radial
profile suggests a decline at large radii (De
Filippis et al. 2004, see their figure 6),
but because of the large errors a constant temperature is in full
agreement with data. Furthermore, in the small central region targeted
by the strong lensing analysis (
![]() 100 kpc),
there is no evidence of radial variations. The error caused by
deviations from isothermality is a few percents and is much smaller
than the uncertainty in the spectroscopic determination of the
temperature.
100 kpc),
there is no evidence of radial variations. The error caused by
deviations from isothermality is a few percents and is much smaller
than the uncertainty in the spectroscopic determination of the
temperature.
In the inner core, the contribution of the tail is
subdominant. We note that the central convergence for the ICM is ![]() ,
so that the gas mass is subcritical for lensing.
,
so that the gas mass is subcritical for lensing.
5 Strong lensing analysis
![\begin{figure}
\par\includegraphics[width=15cm]{13843fg6.eps}
\end{figure}](/articles/aa/full_html/2010/10/aa13843-09/img119.png)
|
Figure 3:
HST/WFPC-2 image of AC 114 with the observed multiple image
systems. The coordinates |
| Open with DEXTER | |
5.1 Optical data
Many multiple image systems have been detected in the core of AC 114 (see Fig. 3). The first ones were discovered in a search for bright gravitational lensing arcs by Smail et al. (1991). Two images of the prominent three-image system S were first identified by Smail et al. (1995), whereas the third image S3 and the systems A, B, C, and D were discovered by Natarajan et al. (1998). The last image system E was located by Campusano et al. (2001), who also measured source redshifts using spectroscopic observations.
For our strong lensing model, we exploited only the image
systems with confirmed spectroscopic redshift, i.e., A, E, and S. The
other systems were not considered, as they are strongly perturbed by
some cluster galaxies or affected by a lack of precise redshift
measurements. The image system S, at redshift ![]() ,
is composed of three hook-shaped images (see Fig. 4). To take
into account the parity and the orientation of the images and exploit
the information carried by the shape, each S-image was sampled by two
points. We considered an uncertainty of
,
is composed of three hook-shaped images (see Fig. 4). To take
into account the parity and the orientation of the images and exploit
the information carried by the shape, each S-image was sampled by two
points. We considered an uncertainty of ![]() ,
which will be the default error in each positional data point. The
image system E is composed of five nearly point-like images at redshift
,
which will be the default error in each positional data point. The
image system E is composed of five nearly point-like images at redshift
![]() ,
see Fig. 4.
The multiple image system A consists of five images of a single source
at redshift
,
see Fig. 4.
The multiple image system A consists of five images of a single source
at redshift ![]() .
The images A1, A2, and A3 are only weakly stretched by the lens, and it
can be seen that morphologically they are images of the same source. We
distinguished two conjugate knots in each image, see Fig. 4. On the other
hand, A4 and A5 are strongly stretched because they merge into a single
arc across the radial critical curve near the BCG. As the knots in
these two central images cannot be distinguished, they have been
furnished with a larger uncertainty (
.
The images A1, A2, and A3 are only weakly stretched by the lens, and it
can be seen that morphologically they are images of the same source. We
distinguished two conjugate knots in each image, see Fig. 4. On the other
hand, A4 and A5 are strongly stretched because they merge into a single
arc across the radial critical curve near the BCG. As the knots in
these two central images cannot be distinguished, they have been
furnished with a larger uncertainty (
![]() ).
).
| Figure 4:
A mosaic of the zoomed-in regions (
|
|
| Open with DEXTER | |
The adopted positional uncertainties are larger than the HST astrometric resolution. Clusters are complex systems and simple models cannot account for all the mass complexities. A coarser positional error allows us to perform the lensing analysis without adding too many parameters and, at the same time, avoiding the explored region in parameter space being overly confined (Sand et al. 2008). This approach can be effective when dealing with galaxy clumps such as those found in the AC 114 luminosity map, which are usually associated with meso-structures (Saha et al. 2007).
5.2 Mass components
We performed a strong lensing analysis exploiting the available optical observations (see Sect. 2), and measurements in the X-ray band (see Sect. 4). This multiwavelength approach allowed us to model the three main components: the cluster-sized dark matter halo, the cluster-sized ICM, and the observed galaxies. Each component was described with a separate parametric mass model.
The projected surface mass density ![]() of these density profiles is expressed in terms of the convergence
of these density profiles is expressed in terms of the convergence ![]() ,
i.e., in units of the critical surface mass density for lensing,
,
i.e., in units of the critical surface mass density for lensing, ![]() ,
where
,
where ![]() ,
,
![]() ,
and
,
and ![]() are the source, the lens, and the lens-source angular diameter
distances, respectively. We considered mass distributions with
elliptical symmetry, so that the convergence can be written in terms of
the elliptical radius
are the source, the lens, and the lens-source angular diameter
distances, respectively. We considered mass distributions with
elliptical symmetry, so that the convergence can be written in terms of
the elliptical radius ![]() .
.
To model the cluster-sized DM component, we considered
parametric mass models with either isothermal or Navarro-Frenk-White
(NFW) density profiles. DM halos can be successfully described as NFW
profiles (Navarro
et al. 1996,1997), whose 3D distribution
follows
|
(6) |
where
An alternative description of a DM component is given in terms
of isothermal mass density. The non-singular isothermal profiles are
parametrized by a softened power-law ellipsoid (NIE), and represent a
special case of ![]() -models
with
-models
with ![]() (see Eq. (1)).
The mass scale parameter is usually written as
(see Eq. (1)).
The mass scale parameter is usually written as ![]() (Keeton 2001b), where
(Keeton 2001b), where ![]() is the central convergence and
is the central convergence and ![]() is the projected core radius.
is the projected core radius.
The two gas components, i.e., the main X-ray clump and the
soft tail, can be modelled as ![]() -profiles, see Eq. (1). Unlike the DM
component, which was modelled as isothermal, the slope for each gas
component is fixed by the X-ray observations, see Table 2. We note that the
mass distribution of the main X-ray emitting clump is quite flat, so
that the impact on lensing features is limited. We considered a normal
prior on the mass normalization
-profiles, see Eq. (1). Unlike the DM
component, which was modelled as isothermal, the slope for each gas
component is fixed by the X-ray observations, see Table 2. We note that the
mass distribution of the main X-ray emitting clump is quite flat, so
that the impact on lensing features is limited. We considered a normal
prior on the mass normalization ![]() of the main gas component whose mean and dispersion had been determined
from the X-ray analysis, see Table 2, and sharp priors
on the remaining parameters describing the ICM distribution.
of the main gas component whose mean and dispersion had been determined
from the X-ray analysis, see Table 2, and sharp priors
on the remaining parameters describing the ICM distribution.
To perform an accurate lens modelling, we also have to
consider the mass distribution of the galaxies. Galaxies are small
compared to the whole cluster, but have high local mass densities and
can strongly perturb the cluster potential in their neighborhood.
Galaxies affecting the considered image systems must therefore be taken
into account. Our galaxy selection was limited to the region of the
cluster where the multiple image systems are located. We selected
galaxies brighter than R702=21.2
within a radius of ![]() from the BCG finding that 25 galaxies passed the cut.
from the BCG finding that 25 galaxies passed the cut.
Galaxy-sized halos can be modelled by pseudo-Jaffe mass
profiles, which are obtained by subtracting a NIE of core radius ![]() (called truncation radius) from another NIE of core radius
(called truncation radius) from another NIE of core radius ![]() ,
where
,
where ![]() .
Apart from the BCG, see Sect. 2, we considered
spherical galaxies. Each pseudo-Jaffe model was characterised by a
velocity dispersion
.
Apart from the BCG, see Sect. 2, we considered
spherical galaxies. Each pseudo-Jaffe model was characterised by a
velocity dispersion ![]() ,
a core radius
,
a core radius ![]() and a truncation radius
and a truncation radius ![]() .
To minimise the number of parameters, a set of scaling laws was adopted
(Brainerd et al. 1996):
.
To minimise the number of parameters, a set of scaling laws was adopted
(Brainerd et al. 1996):
![]() and
and ![]() .
The core radius
.
The core radius ![]() was scaled in the same way as
was scaled in the same way as ![]() .
The dispersion
.
The dispersion ![]() was related to the total mass using
was related to the total mass using ![]() (Natarajan et al. 1998).
To define a characteristic luminosity L*,
we considered a hypothetical galaxy with R702=19.5.
We considered a flat prior on
(Natarajan et al. 1998).
To define a characteristic luminosity L*,
we considered a hypothetical galaxy with R702=19.5.
We considered a flat prior on ![]() ,
which was left to vary between 0 and
,
which was left to vary between 0 and ![]() ,
whereas
,
whereas ![]() and
and ![]() were fixed to
were fixed to ![]() and
and ![]() ,
respectively (Natarajan
et al. 2009).
,
respectively (Natarajan
et al. 2009).
Being a distinct galaxy population from L* cluster ellipticals, BCGs should be modelled on their own. Treating the BCGs as average cluster members may introduce additional uncertainty when studying the mass-to-light ratios of typical early-type galaxies (Natarajan et al. 1998). However, as far as ellipticity, orientation, and centroid (the main features we are going to compare among the different mass components) of the cluster-sized DM halo are concerned, a different lensing modelling of the BCG would have no significant impact.
In general, modelling each perturbing galaxy on its own would
allow us to obtain a closer fit to the data (Limousin
et al. 2008). On the other hand, the cluster-sized
DM halo cannot be effectively distinguished from that of the BCG by
means of pure lensing analyses![]() .
As far as a regular cluster is concerned, one could assume that the two
halos are centred at the same position and then model only the stellar
content of the BCG in the lensing model. In this way, the cluster-sized
DM halo would also account for the BCG dark halo.
.
As far as a regular cluster is concerned, one could assume that the two
halos are centred at the same position and then model only the stellar
content of the BCG in the lensing model. In this way, the cluster-sized
DM halo would also account for the BCG dark halo.
We explored the mass components in AC 114 without
forcing the DM distribution to follow either the gas or the galaxy
density and we allowed the DM centroid to be free to vary. Since a
reasonable physical model requires DM to be associated with the BCG, we
had to account also for the BCG halo. However, in the present paper, we
were mainly concerned with the cluster-sized DM component so that we
preferred to keep the number of free parameters linked to galactic
halos as small as possible. We then considered three different
modellings. As a first case, the BCG was modelled on its own as a
pseudo-Jaffe profile with ellipticity fixed by his luminosity
distribution and velocity dispersion modelled after imposing a flat
prior ![]() .
Alternatively, we constrained the BCG total mass to follow the same
scaling relations as the other galaxies. With this scaling, the NFW
cluster-sized profile represented most of the DM associated with the
BCG halo. In both cases, the core and the truncation radius were scaled
according to their characteristic values. This has a negligible effect
because of the degeneracy between the scale-length and the velocity
dispersion. As a final case, we assumed that the total BCG mass
distribution is embedded in the cluster-sized dark matter halo. We note
that this worked only for the cusped NFW halo.
.
Alternatively, we constrained the BCG total mass to follow the same
scaling relations as the other galaxies. With this scaling, the NFW
cluster-sized profile represented most of the DM associated with the
BCG halo. In both cases, the core and the truncation radius were scaled
according to their characteristic values. This has a negligible effect
because of the degeneracy between the scale-length and the velocity
dispersion. As a final case, we assumed that the total BCG mass
distribution is embedded in the cluster-sized dark matter halo. We note
that this worked only for the cusped NFW halo.
Our analysis is not meant to investigate whether the BCG can be included as either part of the main cluster or a separate potential. The above-mentioned tested models differ in the values of the central velocity dispersion profile and should be distinguished by exploiting dynamical analyses in the very inner regions. We considered these very different cases of BCG modelling to demonstrate that the impact of gas in lens modelling is nearly independent of the galaxies. However, we emphasise that the gas and stellar mass distribution, discussed in Sect. 7, were inferred with tools independent of the lensing analysis.
6 Inferred mass distribution
Table 3: Model parameters inferred from the lensing analysis.
Table 4:
Model parameters inferred from the lensing analysis when the
cluster-sized halo is modelled as a NIE and ![]() is the projected core radius.
is the projected core radius.
To accomplish the strong lensing analysis, we performed a Bayesian investigation. The parameter probability distributions were then determined studying the posterior function. Computation of the likelihood function was based on the gravlens software (Keeton 2001a,b). This analysis was performed in the source plane. Because of the large number of parameters and models, we exploited the Laplace approximation (Mackay 2003). The total number of constraints (42) equalled the number of coordinates of the observed image positions. The number of free parameters, which was allowed to vary, i.e., the free parameters in the mass models plus the (10) unknown coordinates of the source positions, is 16 for a lens model with just a single cluster-sized halo. An additional parameter may account for the velocity dispersion of the scaled galactic halos. As far as the BCG is concerned, we do not add parameters if the BCG is embedded in the cluster-sized halo or forced to follow the scaling law; otherwise, we add one additional parameter if the velocity dispersion is allowed to vary. Finally, some other parameters account for the gas distribution when the ICM is modelled on its own. As a priori distribution for the parameters of the ICM, we consider the results from the X-ray analysis.
In the present first attempt to include the ICM in a lensing
analysis, we considered how and if the inclusion of gas improves the
lensing modelling. An efficient way to compare different models is to
consider the Bayesian evidence E (Mackay 2003). A difference
of 2 for ![]() is regarded as positive evidence, and of 6 or more as strong evidence,
compared to the model with the smaller value.
is regarded as positive evidence, and of 6 or more as strong evidence,
compared to the model with the smaller value.
We note that performing the fitting to just a single image
system leads to a very small ![]() -value for all the considered
models independently of the system (A, E, or S), since constraints
associated with a single system are not enough to reliably determine
the parameters. Only analysing all the image systems simultaneously
provides a reliable constraint of the mass models.
-value for all the considered
models independently of the system (A, E, or S), since constraints
associated with a single system are not enough to reliably determine
the parameters. Only analysing all the image systems simultaneously
provides a reliable constraint of the mass models.
6.1 NFW profile
We first considered NFW profiles. Models consisted of a cluster-sized NFW distribution and additional components for the galactic halos and the ICM, see Table 3. Notation in Table 3 and in the following discussion distinguishes models according to the matter components included in the cluster-sized halo and the modelling of the BCG. The NFW main halo describes the diluted DM plus possible additional contributions. It can encompass either: i) all the components at the same time (in the ``all'' model, DM and baryons are described by only one NFW profile); ii) just the DM (``halo''); iii) DM and gas (``halo with ICM''); iv) DM and gas and BCG (``halo with ICM and BCG''); or, finally, v) diluted DM plus all galactic halos (``halo with all galaxies'') or vi) plus only the BCG (``halo with BCG''). When modelled apart, the galaxies can account for the BCG plus other ellipticals fitting a single scaling law (``all galaxies'') or just the other ellipticals without the BCG (``other galaxies'').
The simplest model is a single NFW halo, representing the
total matter distribution (DM+ICM+galaxies). Its parameters are listed
in Table 3
(see the ``all'' model). Even if the value of the scale length is
larger than the range over which observational constraints are found, a
combined fit to multiple source redshift image systems allows us to
determine ![]() and its uncertainty (Limousin
et al. 2008). This is an important step in
estimating the concentration (see Sect. 8.2). With this
simple mass model, we were able to reproduce the observed images far
more successfully than assuming a single isothermal profile (see
Sect. 6.2).
All the images were reproduced with a mean distance of
and its uncertainty (Limousin
et al. 2008). This is an important step in
estimating the concentration (see Sect. 8.2). With this
simple mass model, we were able to reproduce the observed images far
more successfully than assuming a single isothermal profile (see
Sect. 6.2).
All the images were reproduced with a mean distance of ![]()
![]() .
Since all the priors on the parameters are flat, it makes sense to
consider the
.
Since all the priors on the parameters are flat, it makes sense to
consider the ![]() of the inferred model. Even for a quite complex system such as
AC 114 a single NFW model, accounting at the same time for
dark matter, stars, and gas, can provide a good fit to the data with a
reduced
of the inferred model. Even for a quite complex system such as
AC 114 a single NFW model, accounting at the same time for
dark matter, stars, and gas, can provide a good fit to the data with a
reduced ![]() .
.
The subsequent addition of ICM and galaxy-sized halos considerably improved the fit, but above all helped to achieve a physically more consistent model, which describes the features of the cluster more accurately. As a first step, we followed the usual approach and considered galactic halos together with a cluster-sized component. In these models (``halo with ICM'' and ``halo with ICM and BCG'' in Table 3), all the diluted mass distributions, i.e., dark matter plus gas, contribute to a single cluster-sized NFW halo. The fitted parameters for each component are listed in Table 3. By allowing the velocity dispersion of the BCG to vary, the degeneracy between the cusped cluster-sized halo and the BCG halo takes over and the posterior probability is maximum for a cD galaxy with null mass. We then limited our analysis to a BCG halo either following galactic scaling laws (``halo with ICM'' and ``all galaxies'') or embedded in the cluster-sized one (``halo with ICM and BCG'' and ``other galaxies''). In both cases, the evidence factor is larger than that for the case a single NFW halo (``all'' model). We note that the listed values of the evidence are given apart from a constant factor depending on the data and a second hidden factor depending on the flat priors on the parameters of the NFW profile, which is constant across the models.
As a second step, we considered the effect of explicitly modelling the gas distribution. For all the analysed models, by adding a component for the ICM the evidence becomes larger. In Bayesian analysis, given equal priors for the different hypotheses, model are ranked by evaluating the evidence. Then, from a statistical point of view it is better to model the gas independently of the DM cluster-sized halo. The physical reason beyond that is that the ICM does not follow the mass. In a relaxed cluster, the gas follows the gravitational potential and is rounder than the mass distribution. Our analysis demonstrates that the differences between gas and dark matter distribution are further exacerbated if the cluster is dynamically active.
Models whose cluster-sized halo has to account for:
i) either DM+gas+galaxies (``all''); or
ii) DM+BCG+gas with other galaxies modelled separately (``halo
with ICM and BCG'' and ``other galaxies''),
or iii) DM+galaxies with gas modelled separately
(``halo with all galaxies'' with ``ICM''); or iv) DM+BCG with
other galaxies and gas modelled separately (``halo with BCG'' and
``other galaxies'' and ``ICM'') have an evidence factor of ![]() ,
-7.6, and -4.0 or 0.0, respectively. Adding physically motivated
components increases the evidence. This trend is also confirmed by a
different version of the model where the cluster-sized components
account only for the diluted DM, whereas the BCG follows the galactic
scaling laws and the ICM is modelled separately (``halo'' and
``galaxies with BCG'' and ``ICM''). The corresponding evidence (
,
-7.6, and -4.0 or 0.0, respectively. Adding physically motivated
components increases the evidence. This trend is also confirmed by a
different version of the model where the cluster-sized components
account only for the diluted DM, whereas the BCG follows the galactic
scaling laws and the ICM is modelled separately (``halo'' and
``galaxies with BCG'' and ``ICM''). The corresponding evidence (
![]() )
is larger than those of models without either the galaxies or the gas.
This confirms that the results are independent of the modelling of the
BCG.
)
is larger than those of models without either the galaxies or the gas.
This confirms that the results are independent of the modelling of the
BCG.
Since accounting for the gas is quite unusual in lensing
analyses, we compare the models accounting for a gas component in the
usual way, i.e., a composite mass distribution in which both ICM and DM
are parameterized altogether as a single NFW profile. This conventional
model provides a close fit to the data either for the BCG scaled
together with the other galaxies (``Halo with ICM'' and ``All
galaxies'', ![]() )
or for the BCG embedded in the cluster-sized halo (``Halo with ICM and
BCG'' and ``Other galaxies'',
)
or for the BCG embedded in the cluster-sized halo (``Halo with ICM and
BCG'' and ``Other galaxies'', ![]() ). We note
that the inclusion of both galactic and ICM components is needed to
improve the fit, whereas accounting only for the gas is not helpful. It
is the physical information obtained from X-ray data that infers we
need to include the ICM in the modelling. Our analysis shows that
adding physically motivated complexity to the lensing models (either in
the form of galactic halos or in the form of diluted gas distribution)
improves the description of a cluster lens from both the statistical
and the physical point of view.
). We note
that the inclusion of both galactic and ICM components is needed to
improve the fit, whereas accounting only for the gas is not helpful. It
is the physical information obtained from X-ray data that infers we
need to include the ICM in the modelling. Our analysis shows that
adding physically motivated complexity to the lensing models (either in
the form of galactic halos or in the form of diluted gas distribution)
improves the description of a cluster lens from both the statistical
and the physical point of view.
We note that as far as a simple ![]() -analysis goes, adding the gas
component would not be justified for AC 114, since the fit is
not significantly improved. This point needs to be investigated further
by considering a sample of clusters with different X-ray surface
brightness slopes.
-analysis goes, adding the gas
component would not be justified for AC 114, since the fit is
not significantly improved. This point needs to be investigated further
by considering a sample of clusters with different X-ray surface
brightness slopes.
Modelling the gas helps us to more clearly investigate the DM halo. Comparing the properties of the cluster-sized DM halos (with or without galaxies), see Table 3, to DM+gas halos (with or without galaxies), two properties stand out. First, to account for the mass contributed by the gas, the DM+ICM halo has a larger central convergence and larger radius. The two parameters vary accordingly in such a way as to leave the concentration nearly unchanged. Second, because of the misalignment between gas and DM, the DM+gas halo turns out to be rotated counter-clockwise with respect to the only DM component.
The addition of the ICM, which is quite flattened, caused a
slight decrease in the projected scale length, ![]() ,
of the DM component, whose orientation experienced a clockwise rotation
of
,
of the DM component, whose orientation experienced a clockwise rotation
of ![]()
![]() .
These changes are small, as the ICM has a relatively low mass compared
to the dark matter, but nevertheless interesting. The decrease in
.
These changes are small, as the ICM has a relatively low mass compared
to the dark matter, but nevertheless interesting. The decrease in ![]() shows that the dark matter component is more compact than the ICM. The
total projected mass within
shows that the dark matter component is more compact than the ICM. The
total projected mass within ![]() (
(
![]() )
is
)
is ![]() (
(
![]() ),
in good agreement with previous estimates (De Filippis et al. 2004;
Natarajan
et al. 1998).
),
in good agreement with previous estimates (De Filippis et al. 2004;
Natarajan
et al. 1998).
The ellipticity and orientation of the dark matter component
are almost the same as those of the southern component of the ICM,
whereas the northern component, which is the main baryonic component in
the cluster core, is less elliptical and rotated counter-clockwise by ![]()
![]() compared to the dark matter. Its centroid is displaced
compared to the dark matter. Its centroid is displaced ![]()
![]() from the centre of the dark matter distribution. This clearly evident
spatial offset between the dark matter and the main baryonic component
in the cluster core provides evidence that the cluster is not in
equilibrium. That between the centre of the dark matter component and
the position of the BCG there is no significant offset portends that
the dark matter behaves like collisionless particles during the merging
process.
from the centre of the dark matter distribution. This clearly evident
spatial offset between the dark matter and the main baryonic component
in the cluster core provides evidence that the cluster is not in
equilibrium. That between the centre of the dark matter component and
the position of the BCG there is no significant offset portends that
the dark matter behaves like collisionless particles during the merging
process.
We can test the predictive power of our model by guessing the
source redshifts of the multiple image systems without spectroscopic
confirmation. Both the B and D systems are strongly perturbed
by local galaxies and a prediction would require a detailed modelling
of galactic halos, which is beyond the scope of our analysis. The
system C is not affected by this problem. This three image system has a
predicted lensing redshift of ![]() 2.3 in agreement with Campusano
et al. (2001).
2.3 in agreement with Campusano
et al. (2001).
6.2 Isothermal profile
Alternatively to the NFW model, we considered an isothermal profile for the main mass component (see Table 4). When the BCG is modelled apart from the other galaxies an additional entry line shows up (``pJaffe-BCG''); in the absence of this line, the BCG halo follows the standard scaling law for ellipticals. As a first step, we modelled AC 114 with a single NIE, representing all the matter present in the galaxy cluster. As in the case of NFW parameters, we used flat priors. This model, which turned out to be centred on the neighbourhood of the BCG galaxy, was quite inadequate. The reason is that the central density of this model is too low and therefore the central caustic too narrow, which in turn causes the merging images A4 and A5 to vanquish.
To solve this issue we added the mass distribution from
galaxy-sized halos. In contrast to the cusped NFW, a cored NIE needs an
additional peaked mass distribution associated with the BCG to provide
a good fit to the data. Owing to the degeneracy between BCG and
cluster-sized DM halo, it is then misleading to interpret the DM
distributions studied in this section as pure cored isothermal ones.
Because of the the small core radius imposed on the BCG, the overall
profile has an effective central divergence that comes afloat from the
cored NIE. The distribution is isothermal, ![]() ,
only at large radii (
,
only at large radii (![]()
![]() ).
We note that the fit, and consequently the evidence, improves
significantly when the BCG is not constrained to follow the galactic
scaling laws.
).
We note that the fit, and consequently the evidence, improves
significantly when the BCG is not constrained to follow the galactic
scaling laws.
We finally considered separately the ICM, the galaxy sized
halos, and the dark matter component that was modelled as a NIE
profile. The total projected mass within the circle of radius ![]() (150
(150 ![]() )
is
)
is ![]() (
(
![]() ),
which agrees with the estimate based on the assumption of DM
distributed as a NFW profile and with previous results in Campusano et al. (2001),
who used a slightly different modelling, i.e., pseudo-Jaffe profiles
for both galactic and cluster-sized halos. We note that they had to
consider additional NW and SE substructures to account for weak lensing
effects outside of the very inner core.
),
which agrees with the estimate based on the assumption of DM
distributed as a NFW profile and with previous results in Campusano et al. (2001),
who used a slightly different modelling, i.e., pseudo-Jaffe profiles
for both galactic and cluster-sized halos. We note that they had to
consider additional NW and SE substructures to account for weak lensing
effects outside of the very inner core.
As in the NFW case, the addition of the ICM mass components
did not significantly improve the ![]() ,
since its mass distribution is widely distributed, with a subcritical
surface density that is unable to produce any strong lensing. Only its
total mass has an influence on the lensing properties of the cluster.
On the other hand, the evidence factor increases for each subsequent
addition of physically motivated components. Models with an explicit
component for the ICM have larger evidences than corresponding models
without. The result is then independent of the parameterization of the
DM halo.
,
since its mass distribution is widely distributed, with a subcritical
surface density that is unable to produce any strong lensing. Only its
total mass has an influence on the lensing properties of the cluster.
On the other hand, the evidence factor increases for each subsequent
addition of physically motivated components. Models with an explicit
component for the ICM have larger evidences than corresponding models
without. The result is then independent of the parameterization of the
DM halo.
The value of ![]() for the L* galaxy has to be
much higher when assuming an isothermal profile for the DM rather than
a NFW distribution. The cored NIE is quite inadequate as a model of the
DM so that galaxies, and in particular the BCG, have to supply
additional convergence to broaden the central caustic. The discrepancy
between the values of L*
inferred from different hypotheses (see Tables 3 and 4), gives an
estimate of the systematic uncertainties that plague galactic
parameters inferred from lensing in our analysis.
for the L* galaxy has to be
much higher when assuming an isothermal profile for the DM rather than
a NFW distribution. The cored NIE is quite inadequate as a model of the
DM so that galaxies, and in particular the BCG, have to supply
additional convergence to broaden the central caustic. The discrepancy
between the values of L*
inferred from different hypotheses (see Tables 3 and 4), gives an
estimate of the systematic uncertainties that plague galactic
parameters inferred from lensing in our analysis.
Although a single NIE is unable to provide a good fit, when a second central peak associated with the BCG is added, the overall profile is no more isothermal. On the other hand a single NFW profile provides a good description of the overall mass distribution. However this advantage disappears when we focus on the cluster-sized dark matter distribution instead of the overall distribution. When we add separate components for the gas and the galactic halos, either an isothermal or a NFW profile for the dark matter provide a good fit. Exploiting Bayesian evidence should be the most accurate way to compare the two scenarios, but we are cautious of doing this for two main reasons. First, the reported evidences do not include a factor with depends on the priors on the cluster-sized halo parameters. Since we considered flat priors, the evidence depends on the allowed range. This a priori factor has no effect on the model comparison given a shape for the halo, but could affect the comparison between the isothermal and the NFW profile.
Furthermore, because of the large number of models and
discontinuities, mainly associated with the central radial caustic, we
had to perform our analysis in the source plane. Computation of the
likelihood in the image plane for a number of models showed that the ![]() values in the source plane may be overestimated by
values in the source plane may be overestimated by ![]() 2
for the models with a NFW components, but be underestimated by
2
for the models with a NFW components, but be underestimated by ![]() 2
in the isothermal case.
2
in the isothermal case.
Such effects can considerably affect any model comparison, so we prefer to address this problem in future work investigating a larger sample of clusters.
7 Results
We review the results that follow directly from our multi-component parametric approach.
7.1 Dynamical status
The strong lensing analysis of the inner regions of AC 114
provides additional insight into its dynamical status. We have
attempted a novel multiwavelength approach in which the baryonic
components were mainly constrained using observations either in the
X-ray or optical band, allowing us to infer directly the dark matter
distribution from the lensing analysis. The gas was found to be
systematically displaced from the dark matter. The main X-ray clump and
the cluster-sized DM halo are off-centre by ![]()
![]() ,
an offset much larger than the Chandra accuracy of
,
an offset much larger than the Chandra accuracy of ![]()
![]() ,
which determines the accuracy of the X-ray peak position. The relative
orientation differs by
,
which determines the accuracy of the X-ray peak position. The relative
orientation differs by ![]() .
On the other hand, the DM clump is nearly aligned with the X-ray tail.
This implies that the X-ray surface brightness of the core has been
strongly perturbed by the dynamical activity. The likely motion of a
substructure toward the northeast, as suggested by the fronts, might
have distorted the local emission causing a rotation of the overall
surface brightness of the central X-ray clump towards the east and the
relative misalignment of gas and dark matter.
.
On the other hand, the DM clump is nearly aligned with the X-ray tail.
This implies that the X-ray surface brightness of the core has been
strongly perturbed by the dynamical activity. The likely motion of a
substructure toward the northeast, as suggested by the fronts, might
have distorted the local emission causing a rotation of the overall
surface brightness of the central X-ray clump towards the east and the
relative misalignment of gas and dark matter.
We note that the above analysis is limited to the very inner regions probed by strong lensing. When averaged over larger scales, distribution features might differ and the impact of substructure should be properly addressed.
7.2 Collisionless dark matter
While the ICM is clearly displaced from the galaxy density, the dark matter distribution follows it. The quite large errors in the parameters describing either the number, luminosity, or stellar mass density distributions (see Table 1) make it difficult to determine whether a given galaxy density traces the dark matter distribution more closely than the others. However, the good agreement between each of them allows us to draw some conclusions. The galaxy and dark matter distributions have comparable centroid positions, orientations, and ellipticities. Since dark matter was modelled with a cusped profile, whereas the galaxy density was fitted with a cored distribution, the comparison cannot be extended to the remaining parameters. The agreement provides additional evidence of the collisionless nature of dark matter, as suggested by observations of the bullet cluster (Clowe et al. 2004). This time, we have been able to establish that the agreement between galaxies and dark matter concerns not only the location but also the shape of the distribution.
When comparing dark matter with the galaxy distributions, the agreement becomes striking when we consider the number density distribution. As aforementioned before, errors are quite large and definite statements cannot be drawn but the similarities between the expected values are nevertheless noteworthy. Galaxy abundance has been considered as a proxy of the cluster mass (Hicks et al. 2006). Our result provides additional evidence that galaxy number density is a dependable tracer also for DM shape and orientation.
7.3 Baryons and dark matter
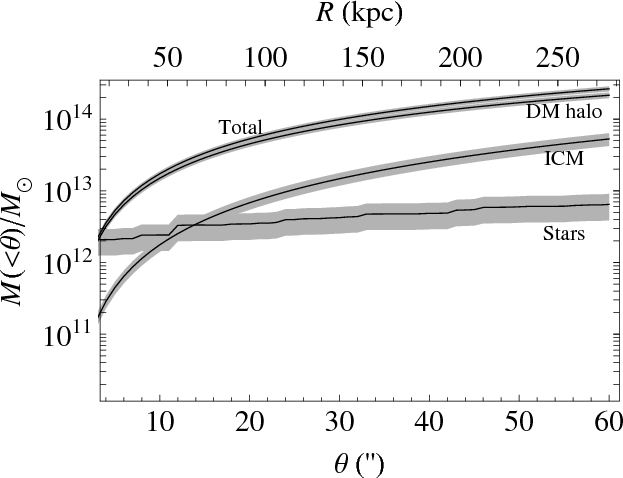
|
Figure 5:
Mass, in units of |
| Open with DEXTER | |
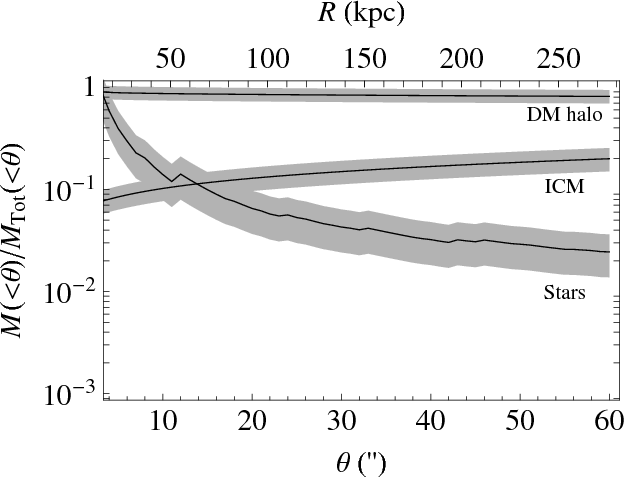
|
Figure 6: Mass fractions as a function of the projected radius. Notation is the same as in Fig. 5. |
| Open with DEXTER | |
Our multiwavelength approach allows us to determine the mass profile of
each component in the very inner regions. Figures 5 and 6 show
the enclosed projected masses within clustercentric distances smaller
than 1
![]() (
(
![]() ).
We consider the two main baryonic components (stars in galaxies and
ICM), the cluster-sized dark matter halo and the total projected mass
(as modelled with a single NFW profile, see Sect. 6.1). The mass
values with the smaller errors are those from the lensing analysis. The
estimates of the different mass components scale differently with the
Hubble constant, so that for comparison we fixed h=0.7.
We note that we consider projected mass distributions for each
component, which avoids biases caused by comparing projected with
three-dimensional quantities. We recall that the mass of each component
has been derived using a different method: the DM distribution has been
inferred from lensing, whereas the ICM and the stellar mass have been
estimated from X-ray data (see Sect. 4), and optical
light data (see Sect. 2.1),
respectively.
).
We consider the two main baryonic components (stars in galaxies and
ICM), the cluster-sized dark matter halo and the total projected mass
(as modelled with a single NFW profile, see Sect. 6.1). The mass
values with the smaller errors are those from the lensing analysis. The
estimates of the different mass components scale differently with the
Hubble constant, so that for comparison we fixed h=0.7.
We note that we consider projected mass distributions for each
component, which avoids biases caused by comparing projected with
three-dimensional quantities. We recall that the mass of each component
has been derived using a different method: the DM distribution has been
inferred from lensing, whereas the ICM and the stellar mass have been
estimated from X-ray data (see Sect. 4), and optical
light data (see Sect. 2.1),
respectively.
We found typical trends (Biviano
& Salucci 2006). The dark matter halo is the most
prominent component (![]()
![]() at
at ![]() ).
At the centre (
).
At the centre (
![]() ),
the baryonic budget is dominated by the stellar mass of the BCG,
whereas the ICM contribution is more important at larger radii. The gas
distribution with radius is shallower than the dark matter profile, so
that the ICM fraction increases from
),
the baryonic budget is dominated by the stellar mass of the BCG,
whereas the ICM contribution is more important at larger radii. The gas
distribution with radius is shallower than the dark matter profile, so
that the ICM fraction increases from ![]()
![]() at
at ![]() to
to ![]()
![]() at
at ![]() .
These values are larger but still compatible with typical values
inferred from X-ray analyses of luminous clusters (Allen et al. 2008). On
the other hand, the stellar fraction is only a few percent at
.
These values are larger but still compatible with typical values
inferred from X-ray analyses of luminous clusters (Allen et al. 2008). On
the other hand, the stellar fraction is only a few percent at ![]() (Biviano & Salucci 2006).
(Biviano & Salucci 2006).
The luminosity function of AC 114 has been
extensively studied (Andreon
et al. 2005). Adopting a total luminosity of ![]() in r and
in r and ![]() in B within
in B within ![]() (Krick & Bernstein 2007),
we derive mass-to-light ratios of
(Krick & Bernstein 2007),
we derive mass-to-light ratios of ![]() and
and ![]() ,
which are indicative of a underluminous cluster core. However, because
of the large errors, especially in the B-band, the
mass-to-light ratios remain slightly compatible with estimates from
other clusters (Rines
et al. 2004; Biviano 2008).
,
which are indicative of a underluminous cluster core. However, because
of the large errors, especially in the B-band, the
mass-to-light ratios remain slightly compatible with estimates from
other clusters (Rines
et al. 2004; Biviano 2008).
8 Comparison with theoretical predictions
It is of interest to compare the results of our analysis with the expectations of N-body simulations or theoretical studies. The comparison requires an extrapolation of our mass model to larger radii, well beyond that directly probed by strong lensing. For this reason, we decided to limit the analysis in this section only to the global fits, i.e., to mass models that describe the total matter distribution (baryons and dark matter) within a single cluster-sized halo. The following considerations can then be seen as a corollary of the main result of the paper, i.e., that ICM has an effect in lens modelling, and do not make use of the explicit gas modelling discussed before.
8.1 Inner slope
Values of the inner and outer slopes of density profiles predicted by N-body
simulations are still debated with different parameterizations
competing (Merritt
et al. 2006; Saha & Read 2009). Baryons
play a role too, since their infalling would steepen the dark matter
profile. However, in large clusters this effect is expected to be small
exterior to ![]()
![]() (Gnedin et al. 2004).
The general consensus is that in the inner regions of clusters the dark
matter profile should go as
(Gnedin et al. 2004).
The general consensus is that in the inner regions of clusters the dark
matter profile should go as ![]() ,
where
,
where ![]() is between 1 and 1.4 (Diemand
et al. 2004).
is between 1 and 1.4 (Diemand
et al. 2004).
To investigate the inner slope, we considered a total matter
distribution modelled as a singular softened power-law (
![]() ), which represents a power
law mass profile, i.e.,
), which represents a power
law mass profile, i.e., ![]() .
This mass profile is able to reproduce all the images of the observed
systems, and for the slope we obtained a best-fit model value of
.
This mass profile is able to reproduce all the images of the observed
systems, and for the slope we obtained a best-fit model value of ![]() .
This estimate is determined mainly by the images near the central
radial caustic.
.
This estimate is determined mainly by the images near the central
radial caustic.
The simple power-law used in our analysis allow us to compare
with previous analyses that employed the same parameterization, showing
good agreement (Saha et al.
2006). On the other hand, the very small uncertainty in ![]() is caused more by not enough accurate modelling than to very precise
statistical accuracy. Since we were mainly interested in comparing with
N-body simulations, we modelled the total mass
profile as a single power-law. We did not attempt to distinguish a
baryonic from a DM component. Inferring the inner slope of the DM
component would require a far more detailed modelling (Limousin et al. 2008).
Different parameterizations of the cD galaxies can produce an
uncertainty of
is caused more by not enough accurate modelling than to very precise
statistical accuracy. Since we were mainly interested in comparing with
N-body simulations, we modelled the total mass
profile as a single power-law. We did not attempt to distinguish a
baryonic from a DM component. Inferring the inner slope of the DM
component would require a far more detailed modelling (Limousin et al. 2008).
Different parameterizations of the cD galaxies can produce an
uncertainty of ![]() 0.05
in the inner slope (Limousin
et al. 2008). On the other hand, when the ICM mass
distribution is modelled with a cored profile, the estimate of
0.05
in the inner slope (Limousin
et al. 2008). On the other hand, when the ICM mass
distribution is modelled with a cored profile, the estimate of ![]() does not depend on the inclusion of the gas in the fit procedure.
does not depend on the inclusion of the gas in the fit procedure.
The main source of error (![]() 0.1) is related to the absence of a length scale
in the simple power-law profile we used. We can quantify the
uncertainty with the following simple reasoning. The slope of a NFW
profile changes from
0.1) is related to the absence of a length scale
in the simple power-law profile we used. We can quantify the
uncertainty with the following simple reasoning. The slope of a NFW
profile changes from ![]() in the very inner regions to
in the very inner regions to ![]() at
at ![]() ,
with a mean value of
,
with a mean value of ![]() .
Then, for sets of multiple images covering nearly one tenth of the
length scale, modelling the profile with a power-law causes an
overestimate of the inner slope
.
Then, for sets of multiple images covering nearly one tenth of the
length scale, modelling the profile with a power-law causes an
overestimate of the inner slope ![]() of
of ![]() 0.1. An
additional source of error is caused by the degeneracy between the
slope and the scale radius of a generalized NFW profile. Limousin et al. (2008)
showed that fixing
0.1. An
additional source of error is caused by the degeneracy between the
slope and the scale radius of a generalized NFW profile. Limousin et al. (2008)
showed that fixing ![]() to a value smaller that the best-fit model estimate causes an
underestimate of the slope. The related uncertainty is
to a value smaller that the best-fit model estimate causes an
underestimate of the slope. The related uncertainty is ![]() 0.05 (Limousin et al. 2008).
Even after accounting for these systematics, we see that the estimated
value of the inner slope of AC 114 remains steeper than a
simple NFW profile and falls just in the middle of the range compatible
with theoretical predictions (Diemand
et al. 2004).
0.05 (Limousin et al. 2008).
Even after accounting for these systematics, we see that the estimated
value of the inner slope of AC 114 remains steeper than a
simple NFW profile and falls just in the middle of the range compatible
with theoretical predictions (Diemand
et al. 2004).
8.2 Concentration
The concentration parameter depends on the central density of the halo,
uncovering imprints of the halo assembly history and thereby of its
time of formation. When analysing ellipsoidal halos, we need
generalized definitions for the intrinsic NFW parameters. We follow Corless & King (2007), who
defined a triaxial radius r200
such that the mean density contained within an ellipsoid of semi-major
axis r200 is 200 times the
critical density at the halo redshift; the corresponding concentration
is ![]() .
The characteristic overdensity in terms of c200
is then the same as that of a spherical profile. The mass, M200,
is the mass within the ellipsoid of semi-major axis r200.
The parameters c200 and M200
defined in this way have small deviations from the parameters computed
by fitting spherically averaged density profiles, as performed in N-body
simulations. The only caveat is that the spherical mass obtained in
simulations is significantly less than the ellipsoidal M200
for extreme axial ratios (Corless
& King 2007).
.
The characteristic overdensity in terms of c200
is then the same as that of a spherical profile. The mass, M200,
is the mass within the ellipsoid of semi-major axis r200.
The parameters c200 and M200
defined in this way have small deviations from the parameters computed
by fitting spherically averaged density profiles, as performed in N-body
simulations. The only caveat is that the spherical mass obtained in
simulations is significantly less than the ellipsoidal M200
for extreme axial ratios (Corless
& King 2007).
We estimated M200
and c200 from the projected
NFW parameters directly inferred from the fit, i.e., ![]() and
and ![]() ,
see Appendix C.
We assumed that a single NFW profile accurately describes the overall
mass distribution (see Sect. 6.1). A main
source of uncertainty is related to triaxiality issues (Gavazzi 2005;
Corless
et al. 2009; Oguri et al. 2005). A
simple way of accounting for projection effects is detailed in
Appendix C.
The expected values of the geometrical correction factors can be
estimated assuming random orientations and intrinsic axial ratios of
probability density obtained from the results of N-body
simulations (Jing & Suto 2002).
To compare our results with theoretical predictions, we did not
consider a generalized NFW profile but we fixed the inner slope to
,
see Appendix C.
We assumed that a single NFW profile accurately describes the overall
mass distribution (see Sect. 6.1). A main
source of uncertainty is related to triaxiality issues (Gavazzi 2005;
Corless
et al. 2009; Oguri et al. 2005). A
simple way of accounting for projection effects is detailed in
Appendix C.
The expected values of the geometrical correction factors can be
estimated assuming random orientations and intrinsic axial ratios of
probability density obtained from the results of N-body
simulations (Jing & Suto 2002).
To compare our results with theoretical predictions, we did not
consider a generalized NFW profile but we fixed the inner slope to ![]() ,
see Sect. 6.1.
We obtained
,
see Sect. 6.1.
We obtained ![]() ,
in close agreement with the estimate based on the velocity dispersion
derived in Sect. 3.1,
and
,
in close agreement with the estimate based on the velocity dispersion
derived in Sect. 3.1,
and ![]() ,
slightly lower than the mass from the virial theorem (see
Sect. 3.1).
We note that neglecting projection effects, the error on c200
would have been
,
slightly lower than the mass from the virial theorem (see
Sect. 3.1).
We note that neglecting projection effects, the error on c200
would have been ![]() 0.2.
We obtain nearly the same value for
0.2.
We obtain nearly the same value for ![]() if we consider the cluster-sized DM halo instead of the total mass
distribution. Because of the flatness of the ICM distribution, the
central value for the concentration of the DM halo is higher than when
we consider the overall distribution. However, the shift is smaller
that the statistical uncertainty.
if we consider the cluster-sized DM halo instead of the total mass
distribution. Because of the flatness of the ICM distribution, the
central value for the concentration of the DM halo is higher than when
we consider the overall distribution. However, the shift is smaller
that the statistical uncertainty.
The halo concentration parameter is expected to be related to
its virial mass, the concentration decreasing gradually with mass (Bullock et al. 2001).
According to some recent numerical simulations (Duffy
et al. 2008), the concentration of a cluster with
the same mass as that just derived for AC 114 at its redshift
should be ![]() .
The agreement with our result is striking, something unusual when
comparing concentrations derived from lensing analyses to predicted
values.
.
The agreement with our result is striking, something unusual when
comparing concentrations derived from lensing analyses to predicted
values.
9 Discussion
Multiwavelength analyses of lensing observations are a very powerful
tool to constrain properties of galaxy clusters (Sereno 2007; Smith et al. 2005; Clowe
et al. 2004; Lemze et al. 2009; Fox & Pen
2002). Here, we have performed a lensing analysis in which
the gas mass distribution, previously inferred from X-ray observations,
has been included from the very beginning in the modelling. Gas is the
main baryonic component and typically contributes ![]() 10%
of the total mass of galaxy clusters (Allen
et al. 2008). Considering the ICM in the
parameterization can be see as an improvement on the usual way of
modelling only cluster-sized dark matter and galaxy-sized halos. We
have attempted a first step in this direction.
10%
of the total mass of galaxy clusters (Allen
et al. 2008). Considering the ICM in the
parameterization can be see as an improvement on the usual way of
modelling only cluster-sized dark matter and galaxy-sized halos. We
have attempted a first step in this direction.
The main result of this paper is that the explicit inclusion of the gas distribution has an important effect on lensing modelling. While it is well known that galactic halos have to be accounted for to increase the accuracy of strong lensing modelling, we have demonstrated that including an additional component that accounts for the gas distribution also helps. Models in which the cluster-sized dark matter halo is considered with the ICM provide more accurate results than parametric solutions with a single halo that accounts at the same time for both dark matter and diluted baryons. The physical gain is quite significant too, since modelling the gas on its own allows us to place direct observational constraints on the dark matter distribution. This is crucial to the understanding of the formation of cosmic structures and the co-evolution of baryons and dark matter in clusters of galaxies.
X-ray data are usually exploited to investigate the mass distribution of a galaxy cluster on a larger scale than the very inner regions analysed with strong lensing analyses. However, X-ray telescopes also map the intracluster medium in the central parts. Our method has been designed to exploit this information. We do not rely on the usual hypotheses needed to infer the total mass from X-ray data (e.g., hydrostatic equilibrium and/or constant baryonic fraction) which are more accurate within a radius as large as the virial one. We only consider the gas distribution directly measured from X-ray observations, which is reliable on all scales. As far as a study of the inner regions is concerned, no calibration on a larger scale, such as those provided by weak-lensing studies, is then needed.
As a test-bed, we have applied our novel method to AC 114, a dynamically active cluster. Comparison of the dark matter map directly obtained from lensing modelling with either the gas or the stellar mass distribution can provide important insight into the properties of the cluster. Our analysis of AC 114 identified another example in which the ICM is displaced from the dark matter in dynamically active clusters, while the collisionless nature of dark matter was confirmed by the close matching with the galaxy distribution.
Our lensing analysis provided a mass modelling of AC 114 that can be compared with N-body simulations. The obtained results are in remarkable agreement with predictions. For AC 114, we found that: i) a cusped NFW model for the overall mass distribution seems to be preferred over an isothermal profile; ii) the inner slope is slightly steeper than a simple NFW; iii) the concentration parameter is in line with predictions from mass-concentration scaling relations.
However, comparisons with N-body simulations must be taken cum grano salis. Statistical samples of halos with the mass of a galaxy cluster are very demanding to obtain with numerical simulations. In addition, AC 114 is dynamically active, which makes the comparison even more ambiguous. Furthermore, our estimation of the virial mass and of the concentration parameter required an extrapolation to scales much larger than what mapped by strong lensing. Calibration with other methods, such as weak lensing, is then needed to support conclusions on the global properties. Nevertheless, we feel encouraged by the agreement between the parameters estimated with lensing and those inferred by a dynamical analysis.
Our estimated inner slope agrees with the estimates of
numerical simulations. A value of ![]() might be an indication of steepening caused by adiabatic contraction,
but the very young dynamical age of AC 114 and its intense
ongoing merging activity weaken this interpretation. We note that the
modelling of the seemingly relaxed cluster A 1703 fitted an
inner slope larger than one (
might be an indication of steepening caused by adiabatic contraction,
but the very young dynamical age of AC 114 and its intense
ongoing merging activity weaken this interpretation. We note that the
modelling of the seemingly relaxed cluster A 1703 fitted an
inner slope larger than one (
![]() )
too (Limousin et al. 2008).
)
too (Limousin et al. 2008).
Different models used for the BCG do not change our results. For a comparison with numerical simulations, we used global fits (i.e., a single DM+baryon halo); as far as the comparison between DM and gas (or light) is concerned, different assumptions about the BCG do not significantly affect either the orientation or centroid of the DM distribution. Finally, as far as the integrated mass distributions of the different components are concerned, the stellar mass estimate is based solely on measured photometry, whereas the gas mass is derived from X-ray observations.
Lensing clusters appear to be quite over-concentrated (Mandelbaum et al. 2008; Oguri & Blandford 2009; Okabe et al. 2010; Johnston et al. 2007; Broadhurst et al. 2008; Oguri et al. 2009; Corless et al. 2009; Comerford & Natarajan 2007). The analysis that we have performed provides additional insights. First, some peculiarities ensure that our results are less affected by biases. We derived the concentration parameter using only strong lensing data and we did not use the spherical approximation of the halo profile. Different definitions of parameters for spherically averaged profiles can play a role when comparing observations to predictions (Broadhurst & Barkana 2008). Second, AC 114 has some peculiar features that might make the high concentration problem much less pronounced. In particular, the very long tail in the X-ray morphology and the detection of a shock front suggest that the cluster develops in the plane of sky. The elongation of the cluster could be probed by observationally combining lensing and X-ray data with measurements of the Sunyaev-Zeldovich effect (Sereno 2007; Sereno et al. 2006; De Filippis et al. 2005; Fox & Pen 2002). Unfortunately, detection for AC 114 is still marginal (Andreani et al. 1996) and deeper radio observations are needed.
AcknowledgementsThe authors thank E. De Filippis and P. Martini for some useful clarifications. For the first stages of this work, M.S. has been supported by the Swiss National Science Foundation.
Appendix A: Velocity dispersion
A cluster galaxy velocity dispersion represents a crucial source of
information. We collected positions and redshifts of galaxies in the
vicinity of AC 114 from the NASA/IPAC Extragalactic Database
(NED). We retrieved 248 galaxies within ![]()
![]() from the BCG in the redshift range
from the BCG in the redshift range ![]() .
A careful treatment of interlopers is required in dynamical modelling.
Many approaches have been proposed and their efficiency has been tested
using numerical simulations (Biviano et al. 2006; Wojtak
et al. 2007). Here, we propose a method of
interloper removal that combines several approaches.
.
A careful treatment of interlopers is required in dynamical modelling.
Many approaches have been proposed and their efficiency has been tested
using numerical simulations (Biviano et al. 2006; Wojtak
et al. 2007). Here, we propose a method of
interloper removal that combines several approaches.
To select member galaxies, we first exploit velocity
information using an adaptive kernel technique (Pisani 1993,1996). This nonparametric method
evaluates the underlying density probability function from the observed
discrete data-set. We identify the main peak in the distribution and
reject galaxies that do not belong to this peak. This cut has been
successfully employed in many studies (Girardi et al. 1998; Girardi &
Mezzetti 2001). To evaluate the optimal smoothing parameter,
we minimise the integrated square error (Pisani
1993), fixing the initial value to the estimate proposed by Vio et al. (1994). As a
second step, we take into account both the position and the velocity
information by using the procedure of the shifting gapper (Girardi
et al. 1998; Fadda et al. 1996). This
method combines velocity information with the clustercentric radial
distance. In each bin, shifting along the radial distance form the
centre, a galaxy is removed if separated from the main local body by
more than a fixed gap in velocity. We use a gap of ![]()
![]() in the cluster rest frame and a bin of
in the cluster rest frame and a bin of ![]() .
.
As a third and final step, we employ a Bayesian technique (Andreon et al. 2008).
The effect of a contaminating population can be inferred by considering
that data vi
come from a Gaussian-distributed intensity superimposed on an
homogeneous random process (van der Marel et al. 2000;
Mahdavi
& Geller 2004; Andreon et al. 2008)
| (A.1) |
where
|
(A.2) |
After considering a sharp prior on
Our expected value for ![]() is lower (but compatible within the errors) than the estimate of Martini et al. (2007),
but higher, despite being marginally compatible, with early estimates
from Couch & Sharples (1987)
and Mahdavi & Geller (2001).
On the other hand, the estimate of Girardi
& Mezzetti (2001), who considered only a sample of
non-active galaxies, is substantially lower.
is lower (but compatible within the errors) than the estimate of Martini et al. (2007),
but higher, despite being marginally compatible, with early estimates
from Couch & Sharples (1987)
and Mahdavi & Geller (2001).
On the other hand, the estimate of Girardi
& Mezzetti (2001), who considered only a sample of
non-active galaxies, is substantially lower.
Appendix B: Substructures
Substructures in the galaxy distributions of AC 114 have been
detected with several tecniques. Two clumps of galaxies, the first one
northwest (NW clump) and the second one southest (SE clump) of the BCG
were noted by Natarajan
et al. (1998), who combined optical data with weak
lensing. According to a combined weak and strong lensing modelling (Campusano et al. 2001),
the NW clump at ![]() and the SE clump at
and the SE clump at ![]() have a mass
have a mass ![]() 20%
and
20%
and ![]() 35%,
respectively, of the mass of the main clump associated with the central
cD galaxy. A clump of galaxies resembling a group with its own cD-like
galaxy at
35%,
respectively, of the mass of the main clump associated with the central
cD galaxy. A clump of galaxies resembling a group with its own cD-like
galaxy at ![]()
![]() northwest of the BCG was noted by Krick
& Bernstein (2007), who also found evidence of
associated intracluster light emission. Actually, the main galaxy in
the NW clump is as luminous as the central BCG galaxy (Couch
et al. 1998; Stanford et al. 2002).
The luminosity map also reveals other features, most notably a filament
towards the northeast in the very inner region, almost perpendicular to
the overall orientation.
northwest of the BCG was noted by Krick
& Bernstein (2007), who also found evidence of
associated intracluster light emission. Actually, the main galaxy in
the NW clump is as luminous as the central BCG galaxy (Couch
et al. 1998; Stanford et al. 2002).
The luminosity map also reveals other features, most notably a filament
towards the northeast in the very inner region, almost perpendicular to
the overall orientation.
By combining galaxy velocity and position information, we can
identify local substructures and compact subsystems. Here, we wish to
use this information fro this purpose. The ![]() test (Dressler & Shectman 1988)
searches for significant deviations in local groups that have either an
average velocity
test (Dressler & Shectman 1988)
searches for significant deviations in local groups that have either an
average velocity ![]() that differs from the cluster mean,
that differs from the cluster mean, ![]() ,
or a velocity dispersion,
,
or a velocity dispersion, ![]() ,
that differs from the global one,
,
that differs from the global one, ![]() .
For our analysis, we considered the classic version of the test, which
considers all possible subgroups of ten neighbors around each cluster
galaxy (Dressler & Shectman 1988)
with the only slight difference being that to calculate location and
scale we consider the biweight estimators instead of mean and standard
deviation (Beers et al. 1990).
The deviation for each galaxy can then be expressed as (Dressler & Shectman 1988)
.
For our analysis, we considered the classic version of the test, which
considers all possible subgroups of ten neighbors around each cluster
galaxy (Dressler & Shectman 1988)
with the only slight difference being that to calculate location and
scale we consider the biweight estimators instead of mean and standard
deviation (Beers et al. 1990).
The deviation for each galaxy can then be expressed as (Dressler & Shectman 1988)
![\begin{displaymath}\delta_{\rm DS}^2= \frac{11}{\sigma_{\rm glo}^2}\left[ (\bar{...
...\rm glo})^2+ (\sigma_{\rm loc}-\sigma_{\rm glo})^2\right]\cdot
\end{displaymath}](/articles/aa/full_html/2010/10/aa13843-09/img231.png)
|
(B.1) |
The parameter
The method can be adapted to determine which galaxies have the
highest likelihood of residing in subclusters. This can be achieved by
considering the ![]() -statistic
in a way similar to what we have just done for
-statistic
in a way similar to what we have just done for ![]() .
The
.
The ![]() -analysis
identifies a potential substructure
-analysis
identifies a potential substructure ![]() (
(![]()
![]() )
northeast of the BCG. Four galaxies located at
)
northeast of the BCG. Four galaxies located at ![]() (
(![]()
![]() )
have a chance in excess of 99.8% of belonging to a substructure. In
conclusion, the
)
have a chance in excess of 99.8% of belonging to a substructure. In
conclusion, the ![]() and the
and the ![]() -test
provide additional evidence for dynamical activity.
-test
provide additional evidence for dynamical activity.
Appendix C: Projection effects
The projected map ![]() of a volume density
of a volume density ![]() ,
which is constant on surfaces of constant ellipsodial radius
,
which is constant on surfaces of constant ellipsodial radius ![]() ,
is elliptical on the plane of the sky (Sereno 2007; Stark 1977)
,
is elliptical on the plane of the sky (Sereno 2007; Stark 1977)
where
where

where the parameter
|
(C.4) |
where
where
|
(C.6) |
When we estimate the gas mass from measurements of the surface brightness
When inferring the concentration parameter of the matter
distribution, we face a slightly different case. We have just a single
projection, so that the central convergence of a NFW profile estimated
from lensing can be written in terms of c200
and the projected scale-length modulus a factor ![]() ,
,
The estimate of the mass M200 also depends on the scale-length
|
(C.8) |
where
The geometrical correction factors can be estimated based on
some working hypotheses. Assuming that the cluster is drawn from a
population with random orientations and intrinsic axial ratios with
probability density following results from N-body
simulations (Jing & Suto 2002),
we can estimate for ![]() (
(
![]() )
an expected value of 0.93 (0.95) with a dispersion of 0.37 (0.18). The
concentration is obtained from Eq. (C.7) after expressing
)
an expected value of 0.93 (0.95) with a dispersion of 0.37 (0.18). The
concentration is obtained from Eq. (C.7) after expressing ![]() in terms of c200 for an
ellipsoidal halo (Corless &
King 2007).
in terms of c200 for an
ellipsoidal halo (Corless &
King 2007).
References
- Allen, S. W., Rapetti, D. A., Schmidt, R. W., et al. 2008, MNRAS, 383, 879 [NASA ADS] [CrossRef] [Google Scholar]
- Andreani, P., Pizzo, L., dall'Oglio, G., et al. 1996, ApJ, 459, L49 [NASA ADS] [CrossRef] [Google Scholar]
- Andreon, S., de Propris, R., Puddu, E., Giordano, L., & Quintana, H. 2008, MNRAS, 383, 102 [NASA ADS] [CrossRef] [Google Scholar]
- Andreon, S., Punzi, G., & Grado, A. 2005, MNRAS, 360, 727 [NASA ADS] [CrossRef] [Google Scholar]
- Beers, T. C., Flynn, K., & Gebhardt, K. 1990, AJ, 100, 32 [NASA ADS] [CrossRef] [Google Scholar]
- Bell, E. F., & de Jong, R. S. 2001, ApJ, 550, 212 [NASA ADS] [CrossRef] [Google Scholar]
- Binney, J., & Merrifield, M. 1998, Galactic astronomy (Princeton, NJ: Princeton University Press) [Google Scholar]
- Binney, J., & Tremaine, S. 1987, Galactic dynamics (Princeton, NJ: Princeton University Press) [Google Scholar]
- Biviano, A. 2008, unpublished [arXiv:0811.3535] [Google Scholar]
- Biviano, A., & Salucci, P. 2006, A&A, 452, 75 [NASA ADS] [CrossRef] [EDP Sciences] [Google Scholar]
- Biviano, A., Katgert, P., Thomas, T., & Adami, C. 2002, A&A, 387, 8 [NASA ADS] [CrossRef] [EDP Sciences] [Google Scholar]
- Biviano, A., Murante, G., Borgani, S., et al. 2006, A&A, 456, 23 [NASA ADS] [CrossRef] [EDP Sciences] [Google Scholar]
- Bradac, M., Allen, S. W., Treu, T., et al. 2008, ApJ, 687, 959 [NASA ADS] [CrossRef] [Google Scholar]
- Brainerd, T. G., Blandford, R. D., & Smail, I. 1996, ApJ, 466, 623 [NASA ADS] [CrossRef] [Google Scholar]
- Broadhurst, T., Umetsu, K., Medezinski, E., Oguri, M., & Rephaeli, Y. 2008, ApJ, 685, L9 [NASA ADS] [CrossRef] [Google Scholar]
- Broadhurst, T. J., & Barkana, R. 2008, MNRAS, 390, 1647 [NASA ADS] [Google Scholar]
- Bullock, J. S., Kolatt, T. S., Sigad, Y., et al. 2001, MNRAS, 321, 559 [Google Scholar]
- Campusano, L. E., Pelló, R., Kneib, J.-P., et al. 2001, A&A, 378, 394 [NASA ADS] [CrossRef] [EDP Sciences] [Google Scholar]
- Clowe, D., Gonzalez, A., & Markevitch, M. 2004, ApJ, 604, 596 [NASA ADS] [CrossRef] [Google Scholar]
- Cole, S., Norberg, P., Baugh, C. M., et al. 2001, MNRAS, 326, 255 [NASA ADS] [CrossRef] [Google Scholar]
- Comerford, J. M., & Natarajan, P. 2007, MNRAS, 379, 190 [NASA ADS] [CrossRef] [Google Scholar]
- Corless, V. L., & King, L. J. 2007, MNRAS, 380, 149 [NASA ADS] [CrossRef] [Google Scholar]
- Corless, V. L., King, L. J., & Clowe, D. 2009, MNRAS, 393, 1235 [NASA ADS] [CrossRef] [Google Scholar]
- Couch, W. J., & Sharples, R. M. 1987, MNRAS, 229, 423 [NASA ADS] [CrossRef] [Google Scholar]
- Couch, W. J., Balogh, M. L., Bower, R. G., et al. 2001, ApJ, 549, 820 [NASA ADS] [CrossRef] [Google Scholar]
- Couch, W. J., Barger, A. J., Smail, I., Ellis, R. S., & Sharples, R. M. 1998, ApJ, 497, 188 [NASA ADS] [CrossRef] [Google Scholar]
- Danese, L., de Zotti, G., & di Tullio, G. 1980, A&A, 82, 322 [NASA ADS] [Google Scholar]
- De Filippis, E., Bautz, M. W., Sereno, M., & Garmire, G. P. 2004, ApJ, 611, 164 [NASA ADS] [CrossRef] [Google Scholar]
- De Filippis, E., Sereno, M., Bautz, M. W., & Longo, G. 2005, ApJ, 625, 108 [NASA ADS] [CrossRef] [Google Scholar]
- Diemand, J., Moore, B., & Stadel, J. 2004, MNRAS, 353, 624 [NASA ADS] [CrossRef] [Google Scholar]
- Dressler, A., & Shectman, S. A. 1988, AJ, 95, 985 [NASA ADS] [CrossRef] [Google Scholar]
- Duffy, A. R., Schaye, J., Kay, S. T., & Dalla Vecchia, C. 2008, MNRAS, 390, L64 [NASA ADS] [CrossRef] [Google Scholar]
- Fadda, D., Girardi, M., Giuricin, G., Mardirossian, F., & Mezzetti, M. 1996, ApJ, 473, 670 [NASA ADS] [CrossRef] [Google Scholar]
- Fox, D. C., & Pen, U.-L. 2002, ApJ, 574, 38 [NASA ADS] [CrossRef] [Google Scholar]
- Gavazzi, R. 2005, A&A, 443, 793 [NASA ADS] [CrossRef] [EDP Sciences] [Google Scholar]
- Gerhard, O., Kronawitter, A., Saglia, R. P., & Bender, R. 2001, AJ, 121, 1936 [NASA ADS] [CrossRef] [Google Scholar]
- Girardi, M., & Mezzetti, M. 2001, ApJ, 548, 79 [NASA ADS] [CrossRef] [Google Scholar]
- Girardi, M., Giuricin, G., Mardirossian, F., Mezzetti, M., & Boschin, W. 1998, ApJ, 505, 74 [NASA ADS] [CrossRef] [Google Scholar]
- Gnedin, O. Y., Kravtsov, A. V., Klypin, A. A., & Nagai, D. 2004, ApJ, 616, 16 [NASA ADS] [CrossRef] [Google Scholar]
- Hennawi, J. F., Dalal, N., Bode, P., & Ostriker, J. P. 2007, ApJ, 654, 714 [NASA ADS] [CrossRef] [Google Scholar]
- Hicks, A. K., Ellingson, E., Hoekstra, H., & Yee, H. K. C. 2006, ApJ, 652, 232 [NASA ADS] [CrossRef] [Google Scholar]
- Jing, Y. P., & Suto, Y. 2002, ApJ, 574, 538 [NASA ADS] [CrossRef] [Google Scholar]
- Johnston, D. E., Sheldon, E. S., Wechsler, R. H., et al. 2007, unpublished [arXiv:0709.1159] [Google Scholar]
- Keeton, C. R. 2001a, unpublished [arXiv:astro-ph/0102341] [Google Scholar]
- Keeton, C. R. 2001b, unpublished [arXiv:astro-ph/0102340] [Google Scholar]
- Krick, J. E., & Bernstein, R. A. 2007, AJ, 134, 466 [Google Scholar]
- Lemze, D., Broadhurst, T., Rephaeli, Y., Barkana, R., & Umetsu, K. 2009, ApJ, 701, 1336 [NASA ADS] [CrossRef] [Google Scholar]
- Limousin, M., Richard, J., Kneib, J.-P., et al. 2008, A&A, 489, 23 [NASA ADS] [CrossRef] [EDP Sciences] [Google Scholar]
- Lin, Y.-T., Mohr, J. J., & Stanford, S. A. 2003, ApJ, 591, 749 [NASA ADS] [CrossRef] [Google Scholar]
- Mackay, D. J. C. 2003, Information Theory, Inference and Learning Algorithms (Cambridge Univ. Press, Cambridge) [Google Scholar]
- Mahdavi, A., & Geller, M. J. 2001, ApJ, 554, L129 [NASA ADS] [CrossRef] [Google Scholar]
- Mahdavi, A., & Geller, M. J. 2004, ApJ, 607, 202 [NASA ADS] [CrossRef] [Google Scholar]
- Mandelbaum, R., Seljak, U., & Hirata, C. M. 2008, JCAP, 8, 6 [Google Scholar]
- Mannucci, F., Basile, F., Poggianti, B. M., et al. 2001, MNRAS, 326, 745 [NASA ADS] [CrossRef] [Google Scholar]
- Martini, P., Mulchaey, J. S., & Kelson, D. D. 2007, ApJ, 664, 761 [NASA ADS] [CrossRef] [EDP Sciences] [Google Scholar]
- Merritt, D., Graham, A. W., Moore, B., Diemand, J., & Terzic, B. 2006, AJ, 132, 2685 [NASA ADS] [CrossRef] [Google Scholar]
- Miranda, M., Sereno, M., de Filippis, E., & Paolillo, M. 2008, MNRAS, 385, 511 [NASA ADS] [CrossRef] [Google Scholar]
- Natarajan, P., Kneib, J.-P., Smail, I., & Ellis, R. S. 1998, ApJ, 499, 600 [NASA ADS] [CrossRef] [Google Scholar]
- Natarajan, P., Kneib, J., Smail, I., et al. 2009, ApJ, 693, 970 [NASA ADS] [CrossRef] [Google Scholar]
- Navarro, J. F., Frenk, C. S., & White, S. D. M. 1996, ApJ, 462, 563 [NASA ADS] [CrossRef] [Google Scholar]
- Oguri, M., & Blandford, R. D. 2009, MNRAS, 392, 930 [NASA ADS] [CrossRef] [Google Scholar]
- Oguri, M., Hennawi, J. F., Gladders, M. D., et al. 2009, ApJ, 699, 1038 [NASA ADS] [CrossRef] [Google Scholar]
- Oguri, M., Takada, M., Umetsu, K., & Broadhurst, T. 2005, ApJ, 632, 841 [NASA ADS] [CrossRef] [Google Scholar]
- Okabe, N., Takada, M., Umetsu, K., Futamase, T., & Smith, G. P. 2010, PASJ, 62, 811 [NASA ADS] [Google Scholar]
- Okabe, N., & Umetsu, K. 2008, PASJ, 60, 345 [NASA ADS] [Google Scholar]
- Pisani, A. 1993, MNRAS, 265, 706 [NASA ADS] [Google Scholar]
- Pisani, A. 1996, MNRAS, 278, 697 [NASA ADS] [CrossRef] [Google Scholar]
- Rines, K., Geller, M. J., Diaferio, A., Kurtz, M. J., & Jarrett, T. H. 2004, AJ, 128, 1078 [NASA ADS] [CrossRef] [Google Scholar]
- Rykoff, E. S., McKay, T. A., Becker, M. R., et al. 2008, ApJ, 675, 1106 [NASA ADS] [CrossRef] [Google Scholar]
- Saha, P., & Read, J. I. 2009, ApJ, 690, 154 [NASA ADS] [CrossRef] [Google Scholar]
- Saha, P., Read, J. I., & Williams, L. L. R. 2006, ApJ, 652, L5 [NASA ADS] [CrossRef] [Google Scholar]
- Saha, P., Williams, L. L. R., & Ferreras, I. 2007, ApJ, 663, 29 [NASA ADS] [CrossRef] [Google Scholar]
- Sand, D. J., Treu, T., Ellis, R. S., Smith, G. P., & Kneib, J.-P. 2008, ApJ, 674, 711 [NASA ADS] [CrossRef] [Google Scholar]
- Schlegel, D. J., Finkbeiner, D. P., & Davis, M. 1998, ApJ, 500, 525 [NASA ADS] [CrossRef] [Google Scholar]
- Sereno, M. 2007, MNRAS, 380, 1207 [NASA ADS] [CrossRef] [Google Scholar]
- Sereno, M., De Filippis, E., Longo, G., & Bautz, M. W. 2006, ApJ, 645, 170 [NASA ADS] [CrossRef] [Google Scholar]
- Smail, I., Ellis, R. S., Fitchett, M. J., et al. 1991, MNRAS, 252, 19 [NASA ADS] [Google Scholar]
- Smail, I., Couch, W. J., Ellis, R. S., & Sharples, R. M. 1995, ApJ, 440, 501 [NASA ADS] [CrossRef] [Google Scholar]
- Smith, G. P., Smail, I., Kneib, J.-P., et al. 2002, MNRAS, 330, 1 [NASA ADS] [CrossRef] [Google Scholar]
- Smith, G. P., Kneib, J.-P., Smail, I., et al. 2005, MNRAS, 359, 417 [NASA ADS] [CrossRef] [Google Scholar]
- Stanford, S. A., Eisenhardt, P. R., Dickinson, M., Holden, B. P., & De Propris, R. 2002, ApJS, 142, 153 [NASA ADS] [CrossRef] [Google Scholar]
- Stark, A. A. 1977, ApJ, 213, 368 [NASA ADS] [CrossRef] [Google Scholar]
- van der Marel, R. P., Magorrian, J., Carlberg, R. G., Yee, H. K. C., & Ellingson, E. 2000, AJ, 119, 2038 [NASA ADS] [CrossRef] [Google Scholar]
- Vio, R., Fasano, G., Lazzarin, M., & Lessi, O. 1994, A&A, 289, 640 [NASA ADS] [Google Scholar]
- Wojtak, R., ▯okas, E. L., Mamon, G. A., et al. 2007, A&A, 466, 437 [NASA ADS] [CrossRef] [EDP Sciences] [Google Scholar]
Footnotes
- ... analyses
![[*]](/icons/foot_motif.png)
- Dynamical analyses of the inner velocity profile are required to differentiate the cluster-sized from the BCG contribution (Sand et al. 2008).
All Tables
Table 1:
Properties of the galaxy distributions, modelled as ![]() profiles, within circular regions of outer radius
profiles, within circular regions of outer radius ![]() .
.
Table 2: Properties of the projected gas distribution as inferred from the X-ray analysis.
Table 3: Model parameters inferred from the lensing analysis.
Table 4:
Model parameters inferred from the lensing analysis when the
cluster-sized halo is modelled as a NIE and ![]() is the projected core radius.
is the projected core radius.
All Figures
|
|
Figure 1:
Grey-scale archive HST/ACS image (F850 band) of the
core of AC 114. North is up and east is to the left. The field
covers |
| Open with DEXTER | |
| In the text | |
|
|
Figure 2:
Surface matter density distribution in the core region of
AC 114, in units of the projected critical density for a
source redshit at |
| Open with DEXTER | |
| In the text | |
|
|
Figure 3:
HST/WFPC-2 image of AC 114 with the observed multiple image
systems. The coordinates |
| Open with DEXTER | |
| In the text | |
| |
Figure 4:
A mosaic of the zoomed-in regions (
|
| Open with DEXTER | |
| In the text | |
|
|
Figure 5:
Mass, in units of |
| Open with DEXTER | |
| In the text | |
|
|
Figure 6: Mass fractions as a function of the projected radius. Notation is the same as in Fig. 5. |
| Open with DEXTER | |
| In the text | |
Copyright ESO 2010
Current usage metrics show cumulative count of Article Views (full-text article views including HTML views, PDF and ePub downloads, according to the available data) and Abstracts Views on Vision4Press platform.
Data correspond to usage on the plateform after 2015. The current usage metrics is available 48-96 hours after online publication and is updated daily on week days.
Initial download of the metrics may take a while.