| Issue |
A&A
Volume 519, September 2010
|
|
|---|---|---|
| Article Number | A29 | |
| Number of page(s) | 14 | |
| Section | Cosmology (including clusters of galaxies) | |
| DOI | https://doi.org/10.1051/0004-6361/200913334 | |
| Published online | 08 September 2010 | |
Non-parametric modeling of the intra-cluster gas using APEX-SZ bolometer imaging data
K. Basu1,2 - Y.-Y. Zhang2 - M. W. Sommer2,1 - A. N. Bender3 - F. Bertoldi2 - M. Dobbs4 - H. Eckmiller2 - N. W. Halverson3 - W. L. Holzapfel5 - C. Horellou6 - V. Jaritz2 - D. Johansson6 - B. Johnson5 - J. Kennedy4 - R. Kneissl7 - T. Lanting8 - A. T. Lee5,9 - J. Mehl10 - K. M. Menten1 - F. P. Navarrete1 - F. Pacaud2 - C. L. Reichardt5 - T. H. Reiprich2 - P. L. Richards5 - D. Schwan5 - B. Westbrook5
1 - Max Planck Institute for Radio Astronomy, 53121 Bonn, Germany
2 -
Argelander Institute for Astronomy, Bonn University, 53121 Bonn, Germany
3 -
Center for Astrophysics and Space Astronomy, University of Colorado,
Boulder, CO, 80309, USA
4 -
Physics Department, McGill University, Montreal, H2T 2Y8 Canada
5 -
Department of Physics, University of California, Berkeley, CA, 94720, USA
6 -
Onsala Space Observatory, Chalmers University of Technology, 43992
Onsala, Sweden
7 -
Joint ALMA Observatory, Las Condes, Santiago, Chile
8 -
Schoold of Physics and Astronomy, Cardiff University, CF243YB, UK
9 -
Lawrence Berkeley National Laboratory, Berkeley, CA, 94720, USA
10 -
University of Chicago, 5640 South Ellis Avenue, Chicago, IL 60637, USA
Received 21 September 2009 / Accepted 23 April 2010
Abstract
Aims. We aim to demonstrate the usability of mm-wavelength
imaging data obtained from the APEX-SZ bolometer array to derive the
radial temperature profile of the hot intra-cluster gas out to radius r500
and beyond. The goal is to study the physical properties of the
intra-cluster gas by using a non-parametric de-projection method that
is, aside from the assumption of spherical symmetry, free from modeling
bias.
Methods. We use publicly available X-ray spectroscopic-imaging data in the 0.7-2 keV energy band from the XMM-Newton
observatory and our Sunyaev-Zel'dovich Effect (SZE) imaging data from
the APEX-SZ experiment at 150 GHz to de-project the density and
temperature profiles for a well-studied relaxed cluster,
Abell 2204. We derive the gas density, temperature and entropy
profiles assuming spherical symmetry, and obtain the total mass profile
under the assumption of hydrostatic equilibrium. For comparison with
X-ray spectroscopic temperature models, a re-analysis of recent Chandra
observation is done with the latest calibration updates. We compare the
results with that from an unrelaxed cluster, Abell 2163, to
illustrate some differences between relaxed and merging systems.
Results. Using the non-parametric modeling, we demonstrate a
decrease of gas temperature in the cluster outskirts, and also measure
gas entropy profiles, both of which are done for the first time
independently of X-ray spectroscopy using the SZE and X-ray imaging
data. The gas entropy measurement in the central 100 kpc
shows the usability of APEX-SZ data for inferring cluster dynamical
states with this method. The contribution of the SZE systematic
uncertainties in measuring ![]() at large radii is shown to be small compared to XMM-Newton and Chandra
systematic spectroscopic errors. The total mass profile obtained using
the hydrostatic equilibrium assumption is in agreement with the
published X-ray and weak lensing results; the upper limit on M200 derived from the non-parametric method is consistent with the NFW model prediction from weak lensing analysis.
at large radii is shown to be small compared to XMM-Newton and Chandra
systematic spectroscopic errors. The total mass profile obtained using
the hydrostatic equilibrium assumption is in agreement with the
published X-ray and weak lensing results; the upper limit on M200 derived from the non-parametric method is consistent with the NFW model prediction from weak lensing analysis.
Key words: galaxies: clusters: individual: Abell 2204 - cosmology: observations - cosmic microwave background - intergalactic medium - X-rays: galaxies: clusters
1 Introduction
Current cosmological models are built upon two complementary approaches of astronomical observation: the statistical study of the ensemble properties in a large sample of objects (i.e. from surveys) and the detailed analysis of the individual objects for gaining better understanding of the physical processes affecting those ensemble properties. This is particularly important in the study of galaxy clusters, where extraction of cosmological parameters from large survey samples (X-ray, optical, or in the radio/mm wavebands) relies critically on our understanding of different mass observables, which depends on the detailed physical processes affecting constituent gas and galaxies.
Accurately determining the thermodynamic state of the intra-cluster medium (ICM) out to a large radius is critical for understanding the link between cluster mass and observables. For over a decade, observations of the thermal Sunyaev-Zel'dovich Effect (tSZE, hereafter simply SZE; Sunyaev & Zel'dovich 1970; Birkinshaw 1999) have been considered as a promising complement to X-ray observations for modeling the ICM in galaxy clusters, yet only recently has it been possible to make meaningful de-projections of gas temperature and density profiles using SZE imaging data from multi-pixel bolometer arrays, in combination with X-ray data. The APEX-SZ experiment (Dobbs et al. 2006; Halverson et al. 2009) employs one of the first such powerful multi-pixel Transition-Edge Sensor (TES) bolometer cameras, and a joint analysis of the ICM properties using SZE and X-ray data has been presented by Nord et al. (2009, hereafter NBP09) for the massive cluster Abell 2163.
In this paper we use the de-projection method used in NBP09 on the prototypical relaxed cluster Abell 2204. Our non-parametric analysis does not rely on any prior physical models in the construction of temperature and density profiles (apart from the assumption of spherical symmetry), hence the results are not based on parametric model fits. We measure the ICM entropy profile, as well as demonstrate the decrease of the ICM temperature in the cluster outskirts, first time from an SZE imaging data and independently from the X-ray spectroscopy. The derived ICM and cluster properties are compared with available X-ray and lensing results to highlight the level of accuracy of this independent method.
Joint SZE/X-ray de-projection analysis is expected to become a standard tool in the near future for understanding the ICM physical state, as large numbers of resolved SZE maps will be available from the new generation SZE experiments. Our analysis assumes the gas to be in thermal equilibrium to model its physical properties, but presence of multi-phase ICM due to gas clumping will drive the electron temperature lower than the ion temperature in the electron-ion plasma (Evrard et al. 1996; Nagai et al. 2000). Recent hydro-simulations by Rudd & Nagai (2009) have shown, with a limited sample of halo models, that this deviation is small (about 5%) near r200 for a relaxed cluster. Joint SZE/X-ray analysis using interferometric measurement of the SZE with OVRO/BIMA (Reese et al. 2002) has already shown that clumping effects are not large in the cluster interior (within r500). Jia et al. (2008) have demonstrated the effect of the gas clumping on SZE and X-ray derived gas temperatures, and also found that these two quantities are in very good agreement within r500 for the massive relaxed cluster RXC J2228.6+2036. But at large radii the gas should get clumpier, due to the onset of filamentary structures. One vital goal for sensitive imaging of the SZE signal using wide-field, multi-pixel bolometer cameras, and its combination with the X-ray and weak-lensing measurements, will be to provide an ultimate tool for measuring the gas clumping and thermodynamic state near the cluster virial radius, to give a dynamic view on the growth of clusters through accretion.
1.1 Previous SZE/X-ray joint modeling
Due to the unavailability of resolved SZE images most of previous SZE/X-ray joint analysis studies have been limited to analytical or numerically simulated cluster models with idealized noise properties. Zaroubi et al. (2001) considered a method for reconstructing the triaxial structure of clusters based on Fourier slice theorem and applied it to a set of cluster simulations. Lee & Suto (2004) also considered de-projection method combining SZE and X-ray data and applied to analytical cluster models. Puchwein & Bartelman (2006) have employed the Richardson-Lucy de-projection technique to reconstruct the ICM and probe the dynamical state of clusters from simulations, and Ameglio et al. (2007) used a joint SZE/X-ray likelihood function maximization using a Monte Carlo Markov Chain (MCMC) for a similar objective.
Modeling ICM properties from real SZE observations has been limited mainly to isothermal ![]() -models (Cavaliere & Fusco-Femiano 1978). Holzapfel et al. (1997), Hughes & Birkinshaw (1998)
used isothermal models to constrain the Hubble parameter from
observations of the clusters Abell 2163 and CL 0016+16,
respectively, and later Reese et al. (2002)
extended this analysis to a sample of 18 clusters detected by
OVRO/BIMA. De Filippis et al. (2005) used published SZE
decrement values and X-ray imaging data to constrain the triaxial
structure of clusters using isothermal
-models (Cavaliere & Fusco-Femiano 1978). Holzapfel et al. (1997), Hughes & Birkinshaw (1998)
used isothermal models to constrain the Hubble parameter from
observations of the clusters Abell 2163 and CL 0016+16,
respectively, and later Reese et al. (2002)
extended this analysis to a sample of 18 clusters detected by
OVRO/BIMA. De Filippis et al. (2005) used published SZE
decrement values and X-ray imaging data to constrain the triaxial
structure of clusters using isothermal ![]() -models.
Zhang & Wu (2000) similarly used the
-models.
Zhang & Wu (2000) similarly used the ![]() -model
to combine SZE and X-ray data to derive central gas temperature in
clusters. A more detailed parametric modeling has been done by Mahdavi
et al. (2007) for the
cluster Abell 478, using simultaneous fits to the X-ray, lensing
and SZE data assuming parametric models for dark matter, gas and
stellar mass distribution, and hydrostatic equilibrium.
-model
to combine SZE and X-ray data to derive central gas temperature in
clusters. A more detailed parametric modeling has been done by Mahdavi
et al. (2007) for the
cluster Abell 478, using simultaneous fits to the X-ray, lensing
and SZE data assuming parametric models for dark matter, gas and
stellar mass distribution, and hydrostatic equilibrium.
Yoshikawa & Suto (1999) first used Abel's integral inversion technique, originally proposed by Silk & White (1978),
for a non-parametric reconstruction of radial density and temperature
profiles using analytical and simulated cluster models. More recently
Yuan et al. (2008) has extended this method for the most X-ray luminous cluster RXC J1347.5-1145 using published ![]() -model
fit values from SZE and X-ray measurements. Extrapolation of the
density and temperature profiles to the cluster outskirts based on such
parametric modeling can be problematic, in particular for clusters with
a very peaked central emission such as RXC J1347.5-1145. Additionally,
this cluster is considered to be a merging system (Cohen & Kneib
2002) where the assumptions of spherical symmetry and hydrostatic
equilibrium may not be valid. The nearest approach to non-parametric
modeling was made by Kitayama et al. (2004)
for the same cluster, RXC J1347.5-1145, using a beta-model density
profile to fit the X-ray surface brightness and obtaining fitted
temperature values separately in each radial bin from their SZE imaging
data. The small extent of their SZE map (less than 2 arcmin)
limited the temperature modeling again to the cluster core region.
-model
fit values from SZE and X-ray measurements. Extrapolation of the
density and temperature profiles to the cluster outskirts based on such
parametric modeling can be problematic, in particular for clusters with
a very peaked central emission such as RXC J1347.5-1145. Additionally,
this cluster is considered to be a merging system (Cohen & Kneib
2002) where the assumptions of spherical symmetry and hydrostatic
equilibrium may not be valid. The nearest approach to non-parametric
modeling was made by Kitayama et al. (2004)
for the same cluster, RXC J1347.5-1145, using a beta-model density
profile to fit the X-ray surface brightness and obtaining fitted
temperature values separately in each radial bin from their SZE imaging
data. The small extent of their SZE map (less than 2 arcmin)
limited the temperature modeling again to the cluster core region.
1.2 Scope of the present work
In this paper we apply the non-parametric ICM modeling based on Abel's
integral inversion technique, as presented in NBP09, to the well
studied and dynamically relaxed galaxy cluster Abell 2204 (z=0.1523,
![]() h50-2 erg s-1 in the 0.1-2.4 keV band,
h50-2 erg s-1 in the 0.1-2.4 keV band,
![]() keV; Reiprich & Böhringer 2002).
The only assumptions in this analysis are spherical symmetry for
reconstructing temperature and density profiles, and hydrostatic
equilibrium (HSE) for reconstructing the total mass profile. The
primary aim is to confirm the validity of this method for modeling the
ICM distribution and cluster mass - and compare the results with those
obtained from deep X-ray spectroscopic and weak lensing data - in a
cluster where the assumptions of spherical symmetry and HSE are
generally accepted to be valid.
keV; Reiprich & Böhringer 2002).
The only assumptions in this analysis are spherical symmetry for
reconstructing temperature and density profiles, and hydrostatic
equilibrium (HSE) for reconstructing the total mass profile. The
primary aim is to confirm the validity of this method for modeling the
ICM distribution and cluster mass - and compare the results with those
obtained from deep X-ray spectroscopic and weak lensing data - in a
cluster where the assumptions of spherical symmetry and HSE are
generally accepted to be valid.
We compute the Chandra spectral temperature profile
with the latest calibration updates and compare it with the SZE-derived
temperature profile. In contrast to the X-ray spectroscopic
measurements from Chandra, the SZE-derived ICM temperature
measurements near the cluster virial radius are constrained primarily
by the statistical uncertainties in the SZE data. This fact
demonstrates the potential for stacking the SZE signal of several
relaxed clusters to put tighter constraints on the slope of the gas
temperature profile in the cluster outskirts (Basu et al., in
prep.). For a single cluster (Abell 2204), the depth in the
APEX-SZ map allows us to model the temperature profile with meaningful
errors up to ![]()
![]() of the cluster virial radius (which we take to be r200, the radius within which the mean total density is 200 times the critical density).
of the cluster virial radius (which we take to be r200, the radius within which the mean total density is 200 times the critical density).
From density and temperature profiles we derive other physical
properties like total gravitational mass, gas mass fraction and the gas
entropy index. The total mass modeling provides a quantitative
comparison with the published X-ray and lensing results. The modeling
of the gas entropy profile from SZE/X-ray imaging data is a first, and
we compare the central entropy values of two clusters with different
morphologies, A2204 and A2163 (APEX-SZ analysis of the latter was
presented in NBP09). This comparison shows how the gas entropy in the
cluster core derived from SZE/X-ray joint modeling can be used to infer
the dynamical state of clusters without the need for X-ray
spectroscopy. A further comparison of the baryonic fraction of the ICM
between A2204 and two other dynamically complex clusters detected by
APEX-SZ (Bullet and A2163) illustrates a statistically significant
difference of
![]() inside r2500.
inside r2500.
All the scientific results in this paper are computed from the radial profiles of two observables: the SZE temperature decrement at 150 GHz, and the X-ray surface brightness in the 0.7-2 keV band of XMM-Newton. In Sects. 2 and 3, we describe the map making and radial profile extraction steps from the X-ray and SZE data, and discuss the different systematic uncertainties associated with each profile. Section 4 describes Abel's integral inversion method and presents our primary results in the form of the radial density and temperature profiles. In Sect. 5 we present the other derived quantities like gas entropy and the total cluster mass profiles, and list the conclusions in Sect. 6.
We use the currently favored ![]() CDM cosmology with the following parameters:
CDM cosmology with the following parameters:
![]() ,
,
![]() ,
and the Hubble constant H0=70 km s-1 Mpc-1. At redshift of z=0.1523,
the angular diameter distance of Abell 2204 is 541.6 Mpc. To
put the radial profiles in perspective using the characteristic cluster
radii, we adopted the maximum likelihood NFW fit parameters from
Corless et al. (2009),
,
and the Hubble constant H0=70 km s-1 Mpc-1. At redshift of z=0.1523,
the angular diameter distance of Abell 2204 is 541.6 Mpc. To
put the radial profiles in perspective using the characteristic cluster
radii, we adopted the maximum likelihood NFW fit parameters from
Corless et al. (2009),
![]() and c=4.5, which gives
r200=1.76 Mpc (11.2'),
r500=1.16 Mpc (7.3') and
r2500=0.51 Mpc (3.2').
and c=4.5, which gives
r200=1.76 Mpc (11.2'),
r500=1.16 Mpc (7.3') and
r2500=0.51 Mpc (3.2').
2 Extraction of the X-ray surface brightness profile
This section describes the basic data analysis steps for X-ray map making, and the method for extracting the radial profile. A brief description of the analysis method is provided below, refer to references for further details. We discuss the main source of the X-ray systematic error caused by particle background, that is incorporated in the analysis.
2.1 XMM-Newton observation and data reduction
A2204 was observed by the XMM-Newton EPIC camera with medium filter in the full frame mode (ID: 0112230301). After carrying out the screening procedure (e.g. Zhang et al. 2008, hereafter ZF08) to filter flares, we obtained 17.5 ks, 18.5 ks and 14.3 ks clean exposure for the MOS1, MOS2 and pn instruments. For pn data, the fraction of the out-of-time (OOT) events caused by read-out time delay is 6.30%, and a simulated OOT event file is created to statistically correct for this. The SAS command ``edetect_chain'' was used to detect point-like sources, which were subtracted before further data reduction. The vignetting correction to the effective area is accounted for by the weight column in the event lists. Geometric factors such as bad pixel and gap corrections are accounted for in the exposure maps. We choose the XMM-Newton blank sky accumulations in the Chandra Deep Field South (CDFS) as background. The background observations were processed in the same way as the cluster observations. The CDFS observations used the thin filter, while the A2204 observations used the medium filter. The background of the A2204 observations is thus different from the CDFS using the thin filter at energies below 0.7 keV. Therefore we performed all the analysis at energies above 0.7 keV, in which the difference of the background is negligible. The image of A2204 is shown in Fig. 1.
![\begin{figure}
\par\includegraphics[width=6.5cm,clip]{13334fg1.ps}
\end{figure}](/articles/aa/full_html/2010/11/aa13334-09/img20.png)
|
Figure 1:
|
| Open with DEXTER | |
2.2 X-ray profile extraction
The 0.7-2 keV band is used to derive the surface brightness profiles.
This ensures an almost temperature-independent X-ray emission
coefficient over the expected temperature range. The width of the
radial bins is
![]() .
An azimuthally averaged surface
brightness profile of the CDFS is derived in the same detector
coordinates as for the target.
The count rate ratios of the target and
CDFS in the 10-12 keV band and 12-14 keV band for MOS and pn,
respectively, are used to scale the CDFS surface brightness.
The residual background in each annulus of the surface brightness is the
count rate in the 0.7-2 keV band of the area scaled residual spectrum
obtained in the spectral analysis. Both the scaled CDFS surface
brightness profile and the residual background are subtracted from the
target surface brightness profile. The background subtracted and
vignetting corrected surface brightness profiles for three detectors
are added into a single profile, and re-binned to reach a significance
level of at least 3-
.
An azimuthally averaged surface
brightness profile of the CDFS is derived in the same detector
coordinates as for the target.
The count rate ratios of the target and
CDFS in the 10-12 keV band and 12-14 keV band for MOS and pn,
respectively, are used to scale the CDFS surface brightness.
The residual background in each annulus of the surface brightness is the
count rate in the 0.7-2 keV band of the area scaled residual spectrum
obtained in the spectral analysis. Both the scaled CDFS surface
brightness profile and the residual background are subtracted from the
target surface brightness profile. The background subtracted and
vignetting corrected surface brightness profiles for three detectors
are added into a single profile, and re-binned to reach a significance
level of at least 3-![]() in each annulus out to
in each annulus out to ![]() arcmin.
The particle-induced background varies by less
than 10% comparing the background observations. Therefore the
dispersion of the re-normalization of the background observations is
typically 10%. We take into account a 10% uncertainty of the scaled
CDFS background and residual background. The resulting profile is shown in Fig. 2, and the values are given in Table 1.
arcmin.
The particle-induced background varies by less
than 10% comparing the background observations. Therefore the
dispersion of the re-normalization of the background observations is
typically 10%. We take into account a 10% uncertainty of the scaled
CDFS background and residual background. The resulting profile is shown in Fig. 2, and the values are given in Table 1.
Table 1: The input X-ray surface brightness and SZE temperature decrement values at each radial bin, and the different de-projected quantities derived from these two observables.
![\begin{figure}
\par\includegraphics[width=7.5cm,clip]{13334fg2.ps}
\end{figure}](/articles/aa/full_html/2010/11/aa13334-09/img76.png)
|
Figure 2: X-ray surface brightness profile from the XMM-Newton map in black squares, converted to physical units. The profile has been convolved and re-binned to match the APEX-SZ resolution. The errors include the systematic uncertainties due to background modeling and are incorporated in the de-projection analysis. Over-plotted in green are the surface brightness values prior to re-binning. |
| Open with DEXTER | |
Note that raising the upper cut of the energy band does not provide dramatic improvement in the signal-to-noise ratio in the surface brightness profile in the cluster outskirts (>3'), where the gas has a lower temperature and therefore does not contribute significant X-ray photons at high energies.
The X-ray surface brightness profile obtained from the above procedure
is convolved with a one-arcmin Gaussian kernel to bring its
resolution to the same level as for the APEX-SZ raw image. This
smoothing raises the S/N
ratio, particularly in the cluster outskirts. Additional re-binning is
performed to conform the X-ray profile with the SZE data, since the
latter is averaged in wide annular bins in the cluster outskirts to
keep the statistical uncertainties under control. The widths of the
radial bins are given in Table 1, where the central bin corresponds to the central 1 arcmin circle in each map.
The resulting X-ray surface brightness profile after re-binning is shown
in Fig. 2 (squares). The errors indicate 1![]() uncertainty from the added poisson errors of the target and CDF
surface brightness profiles, plus systematic uncertainties
due to the variation of the particle-induced background. Beyond
6 arcmin radius the systematic uncertainty starts to dominate, but we
still have a S/N of
uncertainty from the added poisson errors of the target and CDF
surface brightness profiles, plus systematic uncertainties
due to the variation of the particle-induced background. Beyond
6 arcmin radius the systematic uncertainty starts to dominate, but we
still have a S/N of ![]() 3 within 9 arcmin radius. As we will
discuss in the next section, our results are currently dominated by the
statistical uncertainties in the SZE imaging at this radius, therefore
we are not limited by X-ray systematics in the modeling of one single cluster.
3 within 9 arcmin radius. As we will
discuss in the next section, our results are currently dominated by the
statistical uncertainties in the SZE imaging at this radius, therefore
we are not limited by X-ray systematics in the modeling of one single cluster.
2.3 X-ray imaging vs. spectral spatial ranges
Here we briefly highlight the advantage of the SZE/X-ray
de-projection method to obtain the ICM temperature out to large radii, in
comparison with the X-ray spectral measurements (in particular from XMM-Newton and Chandra). To constrain the gas temperature to an uncertainty smaller than 10%
from the X-ray spectra for such a hot cluster, one needs typically S/N >150 in the 0.7-7.8 keV energy band (e.g. Zhang et al. 2009). Therefore such
temperature measurements are typically limited to the central regions
of clusters (up to a radius between r2500 and r500, less than half of the
cluster virial radius, see ZF08).
Recently data from the Suzaku satellite have been used
to measure gas temperature beyond
r500 for a few clusters (Fujita et al.
2008; Reiprich et al. 2009; George et al. 2009).
However, these observations are expensive and limited to a few nearby (![]() )
clusters only. SZE/X-ray joint modeling can overcome this issue, by using
X-ray surface brightness to provide primarily a constraint on
the gas density, and then obtaining the temperature from SZE data. This
easily allows for measuring the gas temperature at
the outer radii where the X-ray S/N
is low, e.g. 3-5. Thus ICM modeling up to the cluster
virial radius can be done, if the systematic uncertainties in both the
X-ray and SZE imaging are controlled, and the SZE statistical
uncertainties are brought down.
)
clusters only. SZE/X-ray joint modeling can overcome this issue, by using
X-ray surface brightness to provide primarily a constraint on
the gas density, and then obtaining the temperature from SZE data. This
easily allows for measuring the gas temperature at
the outer radii where the X-ray S/N
is low, e.g. 3-5. Thus ICM modeling up to the cluster
virial radius can be done, if the systematic uncertainties in both the
X-ray and SZE imaging are controlled, and the SZE statistical
uncertainties are brought down.
3 Extraction of the SZE temperature decrement profile
This section describes the basic reduction and map making steps for the APEX-SZ data. The analysis is very similar to that of NBP09, which should be consulted for further details. Here we emphasize the construction of a set of SZE temperature decrement profiles, all consistent with our APEX-SZ measurement, that we use to estimate the uncertainties in the de-projection analysis. A similar approach was also used in NBP09, but the details of SZE profile construction and de-projection procedure were not discussed.
3.1 APEX-SZ observation and map making
Abell 2204 was observed with the APEX-SZ camera in May 2008 and April 2009, with roughly 80% of the observing time spent in the 2008 run. The usable data on the target amounts to approximately 10 h, divided between scans of 20 min duration. The primary calibration source at 150 GHz was Mars, and secondary calibrators were Neptune and RCW38. Details of the observing technique and data calibration for APEX-SZ are given in Halverson et al. (2009, hereafter HL09). We also refer to the Fig. 1 of that paper for an illustration of the scanning pattern.
![\begin{figure}
\par\includegraphics[width=8.5cm,clip]{13334fg3.ps}\vspace{-3mm}
\end{figure}](/articles/aa/full_html/2010/11/aa13334-09/img79.png)
|
Figure 3:
|
| Open with DEXTER | |
The reduction process is optimized for the circular drift scans employed for
the observation. After eliminating detectors with low optical response,
correlated atmospheric noise is removed by subtracting the
median signal across the good channels of the array at each time step after a temporary
normalization step has been carried out. Additional reduction steps such as
despiking and de-glitching are used, but affect only a small amount of data.
Circular subscans are baselined, by defining the subscans consisting of 3 full
circles and then applying a fifth order polynomial, which corresponds to a low-pass
spatial filter (affecting spatial scales only marginally larger than those
filtered out by the circular scan pattern itself). For each scan, a map with
![]() pixels is constructed, weighting the
data by the inverse rms at the position of each pixel in each scan. The result
we refer to as the ``raw map'', and the radial profile made from this map is
shown in Fig. 4. In parallel, a bright point source
convolved with the instrument beam (obtained from fitting the Mars scans out
to a 4.5' radius) is processed by an identical pipeline to obtain the
transfer function (see HL09), which is used to perform the deconvolution.
pixels is constructed, weighting the
data by the inverse rms at the position of each pixel in each scan. The result
we refer to as the ``raw map'', and the radial profile made from this map is
shown in Fig. 4. In parallel, a bright point source
convolved with the instrument beam (obtained from fitting the Mars scans out
to a 4.5' radius) is processed by an identical pipeline to obtain the
transfer function (see HL09), which is used to perform the deconvolution.
The deconvolution of the map is performed iteratively in map space as
described by NBP09 and discussed in more detail by Nord (2009).
The process essentially reconstructs the cluster signal as the sum of many
point sources as seen by the instrument beam. The final deconvolved map is
shown in Fig. 3, overlaid with the X-ray surface brightness
contours. The noise on scales equal to the APEX-SZ beam is ![]() K
K
![]() in the
central region of the map, corresponding to a peak signal-to-noise ratio of 8.5.
in the
central region of the map, corresponding to a peak signal-to-noise ratio of 8.5.
The outer contours of the APEX-SZ map with low
signal-to-noise ratio shows an elliptical shape.
This is most likely the result of unfiltered noise
on scales of several arcminutes (but see Corless et al. 2009 for a discussion
on the triaxial dark matter halo in this cluster). We perform spherical and elliptical
isothermal ![]() model fits to the SZE map, which yield identical values for
the SZE emission center; (RA, Dec
) = (248.196, 5.577). These coordinates are
within 4 arcsec of the flux-weighted X-ray emission center, which
is defined iteratively though a series of concentric circles in the
X-ray map (see Zhang et al. 2010, Sect. 2.3). This 4 arcsec offset is comparable to
the pointing accuracy of the APEX telescope at 150 GHz. This provides additional
confirmation for the relaxed morphology of this cluster, to apply spherical de-projection using a common SZE/X-ray center.
model fits to the SZE map, which yield identical values for
the SZE emission center; (RA, Dec
) = (248.196, 5.577). These coordinates are
within 4 arcsec of the flux-weighted X-ray emission center, which
is defined iteratively though a series of concentric circles in the
X-ray map (see Zhang et al. 2010, Sect. 2.3). This 4 arcsec offset is comparable to
the pointing accuracy of the APEX telescope at 150 GHz. This provides additional
confirmation for the relaxed morphology of this cluster, to apply spherical de-projection using a common SZE/X-ray center.
3.2 SZE profile extraction and noise properties
To estimate how uncertainties in the SZE map are propagated through our analysis, we compute a set of (typically 100) deconvolved SZE profiles by applying the above map making process on different noise realizations. The resulting profiles are used to compute all the relevant cluster properties (i.e. profiles of gas density and temperature, and thereafter mass and entropy profiles).
![\begin{figure}
\par\includegraphics[width=7.5cm,clip]{13334fg4.eps}
\end{figure}](/articles/aa/full_html/2010/11/aa13334-09/img84.png)
|
Figure 4:
Radial profile of the SZE temperature decrement at 150 GHz. The
profile obtained from the raw reduction is shown by the blue diamonds, and
the mean deconvolved profile by the red squares. The errors on the
deconvolved profile represent the |
| Open with DEXTER | |
We first obtain a set of ``jack-knived'' noise maps, by randomly selecting half of the scan maps and inverting their signs, and then co-adding them with the remaining scans (see HL09 for details of this technique applied to APEX-SZ data). This removes all astrophysical signals but retains the noise structures unfiltered by the pipeline. A random realization of the Cosmic Microwave Background (CMB) sky is added to these noise maps to estimate the contamination of the SZE signal by the CMB (Sect. 3.3). An azimuthally symmetric cluster map is made from the radial profile of the raw map, and added to the jack-knived noise maps. The thus simulated raw maps are deconvolved using the transfer function, and a set of radial SZE profiles are obtained from the final maps. The scatter in this set of profiles constitutes the total statistical uncertainty in the SZE measurement, shown in Fig. 4.
The primary motivation for constructing a set of SZE radial profiles
from jack-knived noise maps is to incorporate the effect of noise
correlation occurring due to the presence of unfiltered noise
structures in the map, which typically have scales much larger than the
APEX-SZ beam. This reduces the significance of the
detection of the SZE signal, in particular if narrow binning is used.
This is clearly seen from the errors on the final deconvolved radial
profile in Fig. 4, which are about ![]() larger than the errors computed from the variance in each annular bin in the
deconvolved cluster image (Fig. 3).
The total statistical uncertainties are then easily propagated through
the de-projection analysis by computing the relevant physical
quantities for each profile and measuring their scatter in each radial
bin. This method also makes sure that the numerical errors coming from
the de-projection method are not artificially enhanced (see details in
Sect. 4.3).
larger than the errors computed from the variance in each annular bin in the
deconvolved cluster image (Fig. 3).
The total statistical uncertainties are then easily propagated through
the de-projection analysis by computing the relevant physical
quantities for each profile and measuring their scatter in each radial
bin. This method also makes sure that the numerical errors coming from
the de-projection method are not artificially enhanced (see details in
Sect. 4.3).
Additionally, the choice of 1 arcmin binning in the central
region of the SZE map leads to a correlation between the adjacent bins
due to PSF smearing. The measured solid angle of the APEX-SZ beam is
1.5 arcmin2, and ![]() of the beam power is in the near sidelobes outside the best fit Gaussian beam with full-width at half maximum (FWHM) of
of the beam power is in the near sidelobes outside the best fit Gaussian beam with full-width at half maximum (FWHM) of
![]() (Reichardt et al. 2009).
Density and temperature de-projection based on a proper PSF
deconvolution is not attempted in this paper; we simply note that the
errors in the narrow central bins are possibly under-estimated by a
small amount, with an overall downward bias in the measured gas
temperature in these bins. The current choice of narrow binning inside r2500 of the cluster is motivated by the aim of demonstrating
the compatibility of our temperature and mass profiles with published X-ray
results. It is also not desirable to smooth out the effect of the central cool
core of Abell 2204.
(Reichardt et al. 2009).
Density and temperature de-projection based on a proper PSF
deconvolution is not attempted in this paper; we simply note that the
errors in the narrow central bins are possibly under-estimated by a
small amount, with an overall downward bias in the measured gas
temperature in these bins. The current choice of narrow binning inside r2500 of the cluster is motivated by the aim of demonstrating
the compatibility of our temperature and mass profiles with published X-ray
results. It is also not desirable to smooth out the effect of the central cool
core of Abell 2204.
The amount of correlation present between different radial bins is easily
computed by means of the correlation matrix.
We compute the correlation matrix for the set of 100 deconvolved SZE profiles
and find that the 4 central bins are almost fully correlated (
![]() ), while the outermost bins have little correlation. For uniform binning
of the SZE profile (12 bins of 1 arcmin each) there is correlation between
adjacent bins all across the profile due to large scale noise structures, and in addition
the bins near the center are correlated more strongly than the others
due to PSF smearing. However, uniform binning is not used at large radii for extracting information out to the very low S/N
regions of the SZE map, in a cluster whose detection significance is
lower than those presented previously from APEX-SZ (HL09, NBP09). When
fewer broad bins are used, the correlation becomes
negligible as can be expected (
), while the outermost bins have little correlation. For uniform binning
of the SZE profile (12 bins of 1 arcmin each) there is correlation between
adjacent bins all across the profile due to large scale noise structures, and in addition
the bins near the center are correlated more strongly than the others
due to PSF smearing. However, uniform binning is not used at large radii for extracting information out to the very low S/N
regions of the SZE map, in a cluster whose detection significance is
lower than those presented previously from APEX-SZ (HL09, NBP09). When
fewer broad bins are used, the correlation becomes
negligible as can be expected (![]() for 4 equal bins), but this is not used either as we are interested in the cluster cool core.
This correlation pattern for any radial binning will propagate through all the other derived cluster quantities
(like temperature, total mass and entropy bin values). Additionally, the noise will not go down as
expected when averaging several bins due to correlated errors, therefore we re-bin
the original set of deconvolved maps for computing errors on averaged values.
for 4 equal bins), but this is not used either as we are interested in the cluster cool core.
This correlation pattern for any radial binning will propagate through all the other derived cluster quantities
(like temperature, total mass and entropy bin values). Additionally, the noise will not go down as
expected when averaging several bins due to correlated errors, therefore we re-bin
the original set of deconvolved maps for computing errors on averaged values.
3.3 Sources of systematic errors
The deconvolution method used in making the final SZE map can introduce
systematic bias in the final profiles. As in NBP09, a series of simulations is
performed by adding artificial cluster models (![]() -profiles) to jack-knived
noise maps and passing them through the reduction pipeline. These are then
deconvolved using the transfer function, and the resulting profiles are
compared with the input
-profiles) to jack-knived
noise maps and passing them through the reduction pipeline. These are then
deconvolved using the transfer function, and the resulting profiles are
compared with the input ![]() -models. The effect is a systematic lowering of
the cluster signal at large radii due to flux loss, by as much as
-models. The effect is a systematic lowering of
the cluster signal at large radii due to flux loss, by as much as ![]() at
r200 (this number is true only if the real cluster profile follows an
isothermal
at
r200 (this number is true only if the real cluster profile follows an
isothermal ![]() -model).
This error is considerably lower than the intrinsic
statistical uncertainties on the profile, which in case of A2204 is almost
-model).
This error is considerably lower than the intrinsic
statistical uncertainties on the profile, which in case of A2204 is almost ![]() at r200.
Resulting systematic uncertainties on the ICM temperature profile are
discussed in Sect. 4.3, after describing the de-projection method.
at r200.
Resulting systematic uncertainties on the ICM temperature profile are
discussed in Sect. 4.3, after describing the de-projection method.
For a large cluster like A2204 (virial radius ![]() 12 arcmin), the
temperature anisotropies in the CMB are a major source of confusion. Following
the same prescription as in NBP09, we attempt to quantify this by making
multiple realizations of the CMB sky using the HEALpix software (Gorski et al.
2005), and adding these to the jack-knived noise maps before performing noise
simulations. The additional scatter in the resulting radial profiles is 14%
at r500 and roughly twice as large at r200, again less than the
statistical errors in the APEX-SZ measurements. The systematic uncertainty on
the APEX-SZ measurement arising from calibration errors is of the order of 5%
(HL09).
12 arcmin), the
temperature anisotropies in the CMB are a major source of confusion. Following
the same prescription as in NBP09, we attempt to quantify this by making
multiple realizations of the CMB sky using the HEALpix software (Gorski et al.
2005), and adding these to the jack-knived noise maps before performing noise
simulations. The additional scatter in the resulting radial profiles is 14%
at r500 and roughly twice as large at r200, again less than the
statistical errors in the APEX-SZ measurements. The systematic uncertainty on
the APEX-SZ measurement arising from calibration errors is of the order of 5%
(HL09).
Other systematic errors in the SZ map can arise from unresolved
point sources (radio or sub-millimeter galaxies) and galactic dust
emission, which we have ignored. There is no indication of any point
like sources in the 150 GHz SZE map. The NVSS radio catalog
(Condon et al. 1998) lists a 70 mJy radio source at 1.4 GHz approximately
![]() from the cluster X-ray center. After subtracting the best fit
from the cluster X-ray center. After subtracting the best fit ![]() -model
from the raw map the rms noise at the map center is 2.2 mJy/beam,
and no indication of a point source is seen in the residual raw map.
The IR luminosity of the central brightest cluster galaxy (BCG) in
Abell 2204 is reported by Quillen et al. (2008).
The corresponding dust thermal emission at 150 GHz
(<0.1 mJy/beam) is much below the noise level at the map
center, and the downward bias in the measured gas temperature at the
cluster center can be ignored. Knudsen et al. (2008)
found a bright sub-millimeter galaxy, SMM J163244.7+053452, in the
field of A2204 at a distance of 39 arcsec N-W from the cluster center.
Its
-model
from the raw map the rms noise at the map center is 2.2 mJy/beam,
and no indication of a point source is seen in the residual raw map.
The IR luminosity of the central brightest cluster galaxy (BCG) in
Abell 2204 is reported by Quillen et al. (2008).
The corresponding dust thermal emission at 150 GHz
(<0.1 mJy/beam) is much below the noise level at the map
center, and the downward bias in the measured gas temperature at the
cluster center can be ignored. Knudsen et al. (2008)
found a bright sub-millimeter galaxy, SMM J163244.7+053452, in the
field of A2204 at a distance of 39 arcsec N-W from the cluster center.
Its ![]() m flux density is
m flux density is
![]() mJy, with estimated magnification of
mJy, with estimated magnification of ![]() .
Assuming a spectral index
.
Assuming a spectral index ![]() ,
where
,
where
![]() ,
this source will produce a flux density of roughly 1.7 mJy at
150 GHz, corresponding to a temperature increment of 34
,
this source will produce a flux density of roughly 1.7 mJy at
150 GHz, corresponding to a temperature increment of 34 ![]() K for the APEX-SZ beam. This is lower than the noise rms at the position of this galaxy in the map.
K for the APEX-SZ beam. This is lower than the noise rms at the position of this galaxy in the map.
4 De-projection of radial density and temperatures
The three-dimensional (de-projected) density and temperature profiles are obtained directly using Abel's integral inversion method (as in NBP09), with the assumption of spherical symmetry. Although proposed nearly three decades ago for joint SZE/X-ray analysis (Silk & White 1978), this method has remained largely unused. One possible reason for this limited application might be due to its numerical instability, as it involves computing derivatives at each point on the observed profiles. We have utilized the noise correlation in the real SZE data to partially overcome this problem, which makes Abel's inversion technique a particularly simple and intuitive method for de-projection. Unlike the standard ``onion-skin'' method of de-projection used in X-ray spectral analyses (Kriss et al. 1983), Abel's inversion is not dependent on the choice of the outermost bin. The strong anti-correlation in the de-projected temperature values between adjacent bins, a numerical artifact found in several geometrical de-projection techniques (see Ameglio et al. 2007), is also not significant.
4.1 Method for de-projection
For the de-projection analysis, the SZE temperature decrement can be
written as the integral of the electron pressure along the line of
sight as
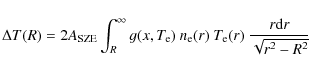
where
In a similar way, the X-ray surface brightness profile can be
written as
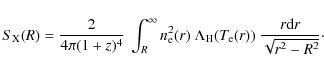
We compute the value of the X-ray emissivity function
Using Abel's integral equation, Eqs. (1) and (2)
can be inverted to obtain joint radial density and temperature profiles (Yoshikawa & Suto 1999)
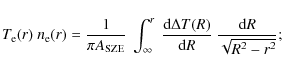
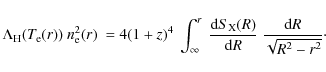
Equations (3) and (4) are integrated numerically by summing in radial bins from
To show that our analysis results do not depend on any a priori
knowledge of the radial temperature profile, we tried two alternative
approaches for the computation of the emissivity function in addition
to the MEKAL model. We used a mean value of the X-ray temperature in
all bins to compute
![]() ,
where
,
where
![]() keV (Arnaud et al. 2005). Alternatively, we used a weak power-law dependence of the emissivity function on the gas temperature, as
keV (Arnaud et al. 2005). Alternatively, we used a weak power-law dependence of the emissivity function on the gas temperature, as
![]() .
The second assumption gives excellent approximation to the X-ray
emissivity values from the MEKAL code if we assume the bulk of the
cluster gas has a temperature in the range 2-14 keV. The
de-projected ICM density and temperature profiles from all three
methods, after combining with the SZE radial profiles, are essentially
identical given the statistical error in each radial bin. This confirms
the fact that the use of the soft-band X-ray data in our analysis is
primarily providing the constraints on gas density profile, whereas the
gas temperature constraints come from the SZE measurement.
.
The second assumption gives excellent approximation to the X-ray
emissivity values from the MEKAL code if we assume the bulk of the
cluster gas has a temperature in the range 2-14 keV. The
de-projected ICM density and temperature profiles from all three
methods, after combining with the SZE radial profiles, are essentially
identical given the statistical error in each radial bin. This confirms
the fact that the use of the soft-band X-ray data in our analysis is
primarily providing the constraints on gas density profile, whereas the
gas temperature constraints come from the SZE measurement.
![\begin{figure}
\par\includegraphics[width=7.5cm,clip]{13334fg5a.eps}\par\vspace*{2mm}
\hspace*{3mm}\includegraphics[width=7.2cm,clip]{13334fg5b.eps}
\end{figure}](/articles/aa/full_html/2010/11/aa13334-09/img121.png)
|
Figure 5:
Top panel: the de-projected electron density with corresponding
errors. The dashed line is the density profile from ZF08, obtained from
fitting a double |
| Open with DEXTER | |
4.2 Radial profiles for gas density and temperature
The results for de-projection of density and temperature profiles for A2204 are shown in Fig. 5, and the corresponding values with their errors are given in Table 1.
Note that the uncertainties on the X-ray surface brightness profile due
to the background modeling are included in the results, but the
additional (small) systematic uncertainties from X-ray flux calibration
are neglected, which likely produces an under-estimation of the errors
on the density values in the inner bins. In the upper panel of
Fig. 5, we overplot the density profile obtained by ZF08 by fitting a double ![]() -model to the X-ray surface brightness. This density profile is XMM-Newton PSF corrected, and the common
-model to the X-ray surface brightness. This density profile is XMM-Newton PSF corrected, and the common ![]() slope parameter is obtained by fitting the outer component (see A.3 in ZF08).
The rms fractional errors shown below Fig. 5 are computed as
slope parameter is obtained by fitting the outer component (see A.3 in ZF08).
The rms fractional errors shown below Fig. 5 are computed as
![]() .
Except for the inner arcminute where the X-ray brightness profile is
extremely cuspy, the double beta model provides a good fit to our
de-projected bin densities. This follows from the fact that in the
0.7-2 keV energy band the X-ray surface brightness is practically
independent of the gas temperature. A similar argument had been used by
Kitayama et al. (2004) while modeling the gas density profile with the X-ray derived
.
Except for the inner arcminute where the X-ray brightness profile is
extremely cuspy, the double beta model provides a good fit to our
de-projected bin densities. This follows from the fact that in the
0.7-2 keV energy band the X-ray surface brightness is practically
independent of the gas temperature. A similar argument had been used by
Kitayama et al. (2004) while modeling the gas density profile with the X-ray derived ![]() -model to obtain best fit radial temperature values in RXC J1347-1145.
-model to obtain best fit radial temperature values in RXC J1347-1145.
In the lower panel of Fig. 5
the radial temperature profile is shown. There is a clear indication of
the cluster cool core from APEX-SZ data; the temperature drops almost
by a factor 3 from 500 kpc to 100 kpc radius.
This is in contrast with the temperature profile for A2163 in NBP09,
which could be fitted with a single isothermal profile at all radii
within the ![]() uncertainties
of the bin values. There is also a strong indication of a decreasing
ICM temperature beyond its peak at
uncertainties
of the bin values. There is also a strong indication of a decreasing
ICM temperature beyond its peak at ![]() 500 kpc. However, the temperature value at the last radial bin at r200
is essentially an upper limit, there is no statistically significant
SZE signal at this radius given the current noise level in the map.
500 kpc. However, the temperature value at the last radial bin at r200
is essentially an upper limit, there is no statistically significant
SZE signal at this radius given the current noise level in the map.
The decreasing temperature profile in the cluster outskirts can
be made clearer by re-binning the APEX-SZ data. As noted in
Sect. 3.2, the errors in the bin values are correlated and do not
average down as expected in random Gaussian noise. Therefore, we re-bin
the original set of deconvolved maps to compute the bin errors. The
result is shown in Fig. 6, where we have divided the data in only two bins, excluding the central
![]() of the map. A decrease in gas temperature from its peak value is supported at
of the map. A decrease in gas temperature from its peak value is supported at ![]() confidence level (
confidence level (![]() ). To put this temperature slope in perspective, we overplot in Fig. 6
the results from recent X-ray observations and numerical simulations of
clusters, scaled to the values for A2204. The solid line is the mean
spectroscopic temperature profile in cooling core clusters (Vikhlinin
et al. 2005), and the gray shaded region is the average profile of the cooling core clusters from ASCA with their
). To put this temperature slope in perspective, we overplot in Fig. 6
the results from recent X-ray observations and numerical simulations of
clusters, scaled to the values for A2204. The solid line is the mean
spectroscopic temperature profile in cooling core clusters (Vikhlinin
et al. 2005), and the gray shaded region is the average profile of the cooling core clusters from ASCA with their ![]() dispersion (Markevitch et al. 1998). The SZE radial temperature is
statistically consistent with both these measurements, although it
appears to indicate a steeper slope. The SZE-derived temperature slope
also appears steeper than the Universal Temperature Profile (UTP) fit
from numerical simulations of relaxed cluster (Hallman et al. 2007), shown in the dashed line with the hatched region for the
dispersion (Markevitch et al. 1998). The SZE radial temperature is
statistically consistent with both these measurements, although it
appears to indicate a steeper slope. The SZE-derived temperature slope
also appears steeper than the Universal Temperature Profile (UTP) fit
from numerical simulations of relaxed cluster (Hallman et al. 2007), shown in the dashed line with the hatched region for the ![]() uncertainties in the UTP fit values. Again, SZE measurement from one
cluster is not yet adequate to provide a quantitative comparison with
the numerical simulations, but a stacking analysis of several relaxed
clusters can be expected to yield a meaningful comparison by lowering
the statistical noise.
uncertainties in the UTP fit values. Again, SZE measurement from one
cluster is not yet adequate to provide a quantitative comparison with
the numerical simulations, but a stacking analysis of several relaxed
clusters can be expected to yield a meaningful comparison by lowering
the statistical noise.
![\begin{figure}
\par\includegraphics[width=7.5cm,clip]{13334fg6.eps}
\end{figure}](/articles/aa/full_html/2010/11/aa13334-09/img126.png)
|
Figure 6: The APEX-SZ measurement
of the outer temperature profile in the cluster A2204, as compared to
simulations and X-ray spectral measurements. The two data points
represent the SZE-derived temperature values with |
| Open with DEXTER | |
As mentioned in the introduction, the two quantities ![]() and
and
![]() are used synonymously in this paper, where the latter is defined as
are used synonymously in this paper, where the latter is defined as
![]() .
They can differ if the post-shock equilibrium timescale between the
electrons and ions is large, especially in the low density environment
near r200 (where
.
They can differ if the post-shock equilibrium timescale between the
electrons and ions is large, especially in the low density environment
near r200 (where
![]() ). Recently, Rudd & Nagai (2009)
have provided quantitative estimate for this bias from cosmological
hydrodynamic simulations of galaxy clusters, and found that for relaxed
clusters (CL 104 in their simulations, with
). Recently, Rudd & Nagai (2009)
have provided quantitative estimate for this bias from cosmological
hydrodynamic simulations of galaxy clusters, and found that for relaxed
clusters (CL 104 in their simulations, with
![]() keV)
keV) ![]() can under-estimate the
can under-estimate the
![]() by about
by about ![]() at r200.
Therefore this effect can be ignored for our current analysis of a
single cluster. Their results most likely present the upper limit of
this bias, since non-adiabatic heating due to shocks in the cluster
outskirts is neglected in their models.
at r200.
Therefore this effect can be ignored for our current analysis of a
single cluster. Their results most likely present the upper limit of
this bias, since non-adiabatic heating due to shocks in the cluster
outskirts is neglected in their models.
4.3 Errors on the de-projected profiles
As seen from Eqs. (3) and (4), the de-projection of density and temperature requires taking derivatives at each radial bin, which are the major source of introducing modeling errors onto the de-projected profiles. This fact may possibly have limited the application of Abel's inversion in the SZE simulations, using realistic mock observations with white noise. Although the high S/N imaging data from APEX-SZ with 1 arcmin resolution makes the application of Abel's inversion method feasible for the first time, propagating errors through a Monte-Carlo method will lead to a high and unphysical error level if the noise correlations between radial bins are ignored. As noted by Yoshikawa & Suto (1999), pre-smoothing the data will reduce this error, but due to its model dependent nature we refrain from smoothing. It is also difficult to determine the degree of smoothing to be applied: a small smoothing kernel is insufficient to offset the numerical error (in particular for the narrow central bins), whereas smoothing over several bins will make their errors artificially low and introduce modeling bias.
The construction of a set of radial SZE profiles from jack-knived noise maps, described in Sect. 3.2, is used to overcome this problem. The X-ray systematic error due to uncertainties in the background modeling is treated as an amplified white noise, and random realizations of X-ray brightness profiles are obtained. Each of these X-ray profiles are then combined with one deconvolved SZE profile, and the de-projected density and temperature profiles are obtained. The scatter in each SZE profile is reduced by noise correlation, which keeps the numerical errors coming from Abel's inversion method at a minimum. Apart from density and temperature, profiles for all other cluster properties (like total mass, entropy) are obtained similarly: the scatter of the profiles measures the statistical uncertainties in each bin. The treatment of X-ray systematics as random noise is justified as the uncertainties in the current de-projected temperature values originate almost entirely from the SZE measurement. For comparison, estimating errors from a ``blind'' Monte-Carlo method treating the SZE decrement value in each bin as independent gives temperature profile errors that are on average 2-4 times higher, thus making a demonstration of the decreasing gas temperature in the cluster outskirts impossible.
The effect of SZE systematic errors on the gas temperature
measurements are computed by methods described in Sect. 3.3. The
relative amplitude with respect to statistical uncertainties and the
radial dependence of the SZE systematic errors are similar to those
found for Abell 2163 in NBP09. That work presented tabulated
uncertainty values on both ![]() and
and ![]() .
We ignore systematic uncertainties on gas density as it is much more
robustly constrained than the gas temperature. The systematic
uncertainties on
.
We ignore systematic uncertainties on gas density as it is much more
robustly constrained than the gas temperature. The systematic
uncertainties on ![]() at r500 due to confusion with the primary CMB anisotropies is
at r500 due to confusion with the primary CMB anisotropies is ![]()
![]() ,
and at r200
it increases to nearly twice that amount. Irrecoverable loss of the SZE
signal occurs for scales larger than the path of a single bolometer,
and hence can not be recovered by the transfer function (see
Sect. 5.2 in NBP09). This bias amounts to a systematic uncertainty
of
,
and at r200
it increases to nearly twice that amount. Irrecoverable loss of the SZE
signal occurs for scales larger than the path of a single bolometer,
and hence can not be recovered by the transfer function (see
Sect. 5.2 in NBP09). This bias amounts to a systematic uncertainty
of ![]() at r500, and roughly
at r500, and roughly ![]() near r200 (these numbers are accurate only in the context of an isothermal
near r200 (these numbers are accurate only in the context of an isothermal ![]() -model). For comparison, the statistical uncertainty in the SZE map at r500 is about
-model). For comparison, the statistical uncertainty in the SZE map at r500 is about ![]() ,
increasing to
,
increasing to ![]()
![]() at r200. In Fig. 7
we have shown the effect of adding systematic uncertainties (by adding
in quadrature with statistical errors) on the measured gas temperature
values.
at r200. In Fig. 7
we have shown the effect of adding systematic uncertainties (by adding
in quadrature with statistical errors) on the measured gas temperature
values.
4.4 Comparison with X-ray spectral analysis
In Fig. 5 we also
showed the de-projected X-ray spectroscopic temperature measurements
for A2204 (ZF08), to provide a direct comparison between our results
and those derived from X-ray analysis. There is partial overlap between
these two profiles within their ![]() uncertainties, however, near r2500
the SZE-derived temperature is systematically higher. It is beyond the
scope of this paper to present a detailed discussion on X-ray spectral
analysis and its biases, but we mention the fact that for
multi-temperature ICM in hot clusters the spectral analysis method can
significantly underestimate (by up to 40%) the mass-weighted gas
temperature (Mazzotta et al. 2004),
and this effect is expected to be stronger near cluster cool cores
where the line of sight crosses many temperature components.
The low temperature value in the innermost bin from our measurement may
be partially caused by the numerical uncertainty of taking derivatives
at the inner edge of the profile, or APEX-SZ beam smearing. Snowden
et al. (2008) considered the effect of XMM-Newton PSF smearing in analysis of this cluster, and gave a higher value of X-ray spectroscopic temperature near
uncertainties, however, near r2500
the SZE-derived temperature is systematically higher. It is beyond the
scope of this paper to present a detailed discussion on X-ray spectral
analysis and its biases, but we mention the fact that for
multi-temperature ICM in hot clusters the spectral analysis method can
significantly underestimate (by up to 40%) the mass-weighted gas
temperature (Mazzotta et al. 2004),
and this effect is expected to be stronger near cluster cool cores
where the line of sight crosses many temperature components.
The low temperature value in the innermost bin from our measurement may
be partially caused by the numerical uncertainty of taking derivatives
at the inner edge of the profile, or APEX-SZ beam smearing. Snowden
et al. (2008) considered the effect of XMM-Newton PSF smearing in analysis of this cluster, and gave a higher value of X-ray spectroscopic temperature near
![]() radius.
radius.
In order to avoid added complexities from the X-ray spectral
de-projection, a simpler way is to make a projected (i.e. two
dimensional) temperature profile from our measurements using an
appropriate weighting scheme. The mean weighted value of the gas
temperature
along the line of sight can be computed as
![]() ,
where T is the de-projected gas temperature and W is the weight
function. We use two different weighting schemes: the
standard emission weight with
,
where T is the de-projected gas temperature and W is the weight
function. We use two different weighting schemes: the
standard emission weight with
![]() (using
(using
![]() as discussed earlier), and the weighting for a ``spectroscopic-like''
temperature as discussed by Mazzotta et al. (2004), using
W = n2 T-3/4. As seen in
NBP09, the results are almost identical for these two methods, and
projection results only for the Mazzotta model are used for comparison
with the X-ray data. As can be expected, the effect of projection on
the radial temperature profile is small when compared to the current
statistical errors.
as discussed earlier), and the weighting for a ``spectroscopic-like''
temperature as discussed by Mazzotta et al. (2004), using
W = n2 T-3/4. As seen in
NBP09, the results are almost identical for these two methods, and
projection results only for the Mazzotta model are used for comparison
with the X-ray data. As can be expected, the effect of projection on
the radial temperature profile is small when compared to the current
statistical errors.
![\begin{figure}
\par\includegraphics[width=7.5cm,clip]{13334fg7.eps}
\end{figure}](/articles/aa/full_html/2010/11/aa13334-09/img141.png)
|
Figure 7: Comparison of the
projected gas temperature profile in A2204 deduced from APEX-SZ data
(blue, solid boundaries) with X-ray spectral measurements from Chandra data (red, dashed boundaries). The Chandra spectral analysis has been re-performed taking the latest calibration update into account. The hatched regions show the |
| Open with DEXTER | |
For an accurate measurement of the X-ray spectroscopic temperatures, we have
re-analyzed two Chandra observations of A2204 (Obs. IDs 6104 and 7940),
resulting in a total exposure of 88 ks. While a temperature profile using
these data has already been published (Sanders et al. 2009), the calibration
update released recently (CALDB 4) was expected to have a significant effect for
this hot cluster. Therefore, the Chandra data was re-analyzed in the same way as described in
Hudson et al. (2010); in addition, a correction for a
possible difference in the cosmic X-ray background between source and
blank sky observations was applied since we are also interested in low
surface brightness cluster outskirts.
The analysis with the new calibration results
in approximately 15-20% lower temperatures in the hot cluster regions (at ![]() r2500)
as compared to Sanders et al. (2009).
r2500)
as compared to Sanders et al. (2009).
The results from the updated Chandra spectral analysis and the projection of the SZE/X-ray 3D temperature profile are shown in Fig. 7. The blue hatched region marks the ![]()
![]() statistical
uncertainties around the mean SZE-derived temperature, and similarly
the red hatched region shows the statistical uncertainties in the X-ray
spectral analysis. Both results are in excellent agreement within their
mutual uncertainties. But the point to note in Fig. 7 is the relative increase in the statistical and systematic errors in the Chandra
and APEX-SZ measurements of the gas temperature. The statistical and
systematic errors are added in quadrature and the total uncertainties
are shown on top of the statistical uncertainties (white bordered
regions). At r500 the Chandra measurement is
already dominated by systematic uncertainties due to the background
modeling; beyond that radius it is impossible to put meaningful
constraints on the gas temperature using the current Chandra data. In contrast, the uncertainties on the SZE-derived temperatures are dominated by the statistical errors also at r200. At r500 the ratio of statistical and total systematic errors on the SZE-derived
statistical
uncertainties around the mean SZE-derived temperature, and similarly
the red hatched region shows the statistical uncertainties in the X-ray
spectral analysis. Both results are in excellent agreement within their
mutual uncertainties. But the point to note in Fig. 7 is the relative increase in the statistical and systematic errors in the Chandra
and APEX-SZ measurements of the gas temperature. The statistical and
systematic errors are added in quadrature and the total uncertainties
are shown on top of the statistical uncertainties (white bordered
regions). At r500 the Chandra measurement is
already dominated by systematic uncertainties due to the background
modeling; beyond that radius it is impossible to put meaningful
constraints on the gas temperature using the current Chandra data. In contrast, the uncertainties on the SZE-derived temperatures are dominated by the statistical errors also at r200. At r500 the ratio of statistical and total systematic errors on the SZE-derived
![]() value in A2204 is roughly 2:1.
value in A2204 is roughly 2:1.
The low systematic uncertainties in our analysis make it possible to
lower the error budget on the temperature profile significantly by
stacking the SZE signal of several relaxed clusters (Basu et al.,
in prep.). It is true that a very long exposure will drive down the
systematic uncertainties associated with the X-ray background
correction, and the remaining systematic uncertainties in the flux
calibration are small (![]() 5% for Chandra, Vikhlinin et al. 2005).
A precise comparison between the two gas temperature profiles, derived
from joint SZE/X-ray analysis and X-ray spectroscopy, will be the most
promising way to observationally constrain gas clumping and non-LTE
effects near a cluster's virial radius.
5% for Chandra, Vikhlinin et al. 2005).
A precise comparison between the two gas temperature profiles, derived
from joint SZE/X-ray analysis and X-ray spectroscopy, will be the most
promising way to observationally constrain gas clumping and non-LTE
effects near a cluster's virial radius.
We mention here the recent advances made by the X-ray spectral analysis method to constrain gas temperatures out to r200 using the Suzaku experiment (Reiprich et al. 2009; George et al. 2009; Bautz et al. 2009). This is due to the low level of particle background in the Suzaku orbit as compared to XMM-Newton and Chandra. For Abell 2204 Reiprich et al. (2009) have constrained the gas temperature near r200 at
4.49+1.18-0.91 keV,
including both systematic and statistical errors. This is far superior
to the current uncertainties in the APEX-SZ measurement. However, the
extended PSF of Suzaku limits its ability to spectroscopically measure the gas temperature out to the cluster virial radius to only low redshift
![]() massive clusters (most of which are too extended for single-frequency
APEX-SZ measurement). This also makes modeling of the gas temperature
at the inner radial bins difficult. Joint SZE/X-ray temperature
modeling with XMM-Newton, Chandra or ROSAT data for X-ray surface brightness is therefore promising for the majority of clusters out to high redshifts.
massive clusters (most of which are too extended for single-frequency
APEX-SZ measurement). This also makes modeling of the gas temperature
at the inner radial bins difficult. Joint SZE/X-ray temperature
modeling with XMM-Newton, Chandra or ROSAT data for X-ray surface brightness is therefore promising for the majority of clusters out to high redshifts.
4.5 Direct comparison of de-projected pressure profile with parametric models
Applying Abel's inversion technique to the SZE map produces an unbiased and non-parametric estimate of the cluster pressure profile for a spherically symmetric system. This can be used to compare the usability of different parametric models, needed to extract cluster properties like M200, from SZE or X-ray measurements made within r2500. For example, parametric extension is unavoidable while using interferometric measurements of the SZE signal in low and intermediate redshift clusters.
The de-projected pressure profile assuming spherical symmetry for A2204 is presented in Fig. 8, error bars show the ![]() statistical uncertainties in the SZE measurement. We have plotted the best-fit spherical isothermal
statistical uncertainties in the SZE measurement. We have plotted the best-fit spherical isothermal ![]() -model and Nagai model (Nagai et al. 2007) fits on this profile. The fits are limited only to data within
-model and Nagai model (Nagai et al. 2007) fits on this profile. The fits are limited only to data within
![]() radius,
to mimic an SZE observation with limited spatial extent that uses
parametric model fitting to extrapolate out to the cluster virial
radius. We used the Nagai profile parameters as used by the recent SZA
analysis of pressure profiles (Mroczkowski et al. 2009), with parameters
(a,b,c) = (0.9, 5.0, 0.4). Our fitted scale radius is much larger than the predicted value of
radius,
to mimic an SZE observation with limited spatial extent that uses
parametric model fitting to extrapolate out to the cluster virial
radius. We used the Nagai profile parameters as used by the recent SZA
analysis of pressure profiles (Mroczkowski et al. 2009), with parameters
(a,b,c) = (0.9, 5.0, 0.4). Our fitted scale radius is much larger than the predicted value of
![]() (
(
![]() in our fit), although it is strongly degenerate with the normalization factor. Similarly, the
in our fit), although it is strongly degenerate with the normalization factor. Similarly, the ![]() -model parameters
-model parameters
![]() are also highly degenerate. We use fit values
are also highly degenerate. We use fit values
![]() and
and
![]() for this comparison; setting
for this comparison; setting ![]() we obtain
we obtain
![]() which provides a marginally better fit to the peak SZE decrement in the deconvolved map.
which provides a marginally better fit to the peak SZE decrement in the deconvolved map.
The ![]() -model is found to provide a poor extrapolated fit to the pressure profile even at r500 (Fig. 8), whereas the Nagai model provides a much better fit. The two outer bins representing roughly the values at r500 and r200 in our analysis have
-model is found to provide a poor extrapolated fit to the pressure profile even at r500 (Fig. 8), whereas the Nagai model provides a much better fit. The two outer bins representing roughly the values at r500 and r200 in our analysis have ![]() upper limits at
upper limits at
![]() keV cm-3 and
keV cm-3 and
![]() keV cm-3, respectively. This puts the values predicted by the Nagai model at these radii at roughly
keV cm-3, respectively. This puts the values predicted by the Nagai model at these radii at roughly ![]() above our measured values, whereas the
above our measured values, whereas the ![]() -model predictions are at
-model predictions are at
![]() off. Note the limited spatial range used in this comparison study; a more accurate
off. Note the limited spatial range used in this comparison study; a more accurate ![]() -model fit for the full SZE-derived pressure profile is possible given the degeneracy of the fitting parameters.
-model fit for the full SZE-derived pressure profile is possible given the degeneracy of the fitting parameters.
![\begin{figure}
\par\includegraphics[width=7.5cm,clip]{13334fg8.eps}
\end{figure}](/articles/aa/full_html/2010/11/aa13334-09/img156.png)
|
Figure 8:
Comparison of the de-projected pressure profile with commonly used
parametric models. The data points with errors show the result of
direct inversion of the SZE temperature decrement map using Abel's
integral. The red (solid) line is the best fit isothermal |
| Open with DEXTER | |
We have also attempted to fit the de-projected pressure profile using a
polytropic model for the gas, where the pressure and density are
related by the relation
![]() .
Many authors continue to use this model, e.g. Afshordi et al. (2007)
use it to constrain cluster pressure profiles from WMAP data. This
model is found to be too steep for the pressure profile near the
cluster center, although in the outer regions (
.
Many authors continue to use this model, e.g. Afshordi et al. (2007)
use it to constrain cluster pressure profiles from WMAP data. This
model is found to be too steep for the pressure profile near the
cluster center, although in the outer regions (![]() Mpc) the fit is good (using
Mpc) the fit is good (using
![]() ,
e.g. Finoguenov et al. 2001). A combination of
,
e.g. Finoguenov et al. 2001). A combination of ![]() -model
in the cluster center and polytropic model in the outskirts can be used
to fit the entire pressure profile, in particular to avoid the
cuspiness of the Nagai model at the center. A more comprehensive
analysis of the different parametric models to describe the SZE-derived
pressure profile near r200 will be discussed in a future paper.
-model
in the cluster center and polytropic model in the outskirts can be used
to fit the entire pressure profile, in particular to avoid the
cuspiness of the Nagai model at the center. A more comprehensive
analysis of the different parametric models to describe the SZE-derived
pressure profile near r200 will be discussed in a future paper.
5 Mass and entropy profiles of the ICM
If the ICM is in hydrostatic equilibrium (HSE) within the DM gravitational potential, the gas temperature reflects directly the depth of the potential well. The ratio between gas mass and total mass as function of radius shows the amount of baryons that is contained in the ICM. A low value of the ICM mass fraction, or a falling gas entropy profile, can indicate the existence of multi-phase ICM with non-thermal pressure support near the cluster virial radius, and physical processes hitherto unexplored in numerical cluster simulations.
5.1 Gas mass and total mass distribution
The total mass,
![]() ,
is obtained by solving the hydrostatic
equilibrium equation assuming spherical symmetry (e.g. Sarazin 1988):
,
is obtained by solving the hydrostatic
equilibrium equation assuming spherical symmetry (e.g. Sarazin 1988):
![\begin{displaymath}M_{{\rm total}}(<r) = - \frac{k_{{\rm B}}T_{\rm e}(r) \ r}{G ...
...+ \frac{{\rm d}\!\ln T_{\rm e}(r)}{{\rm d}\!\ln r}\right]\cdot
\end{displaymath}](/articles/aa/full_html/2010/11/aa13334-09/img161.png)
where
![\begin{figure}
\par\includegraphics[width=7.5cm,clip]{13334fg9.ps}
\end{figure}](/articles/aa/full_html/2010/11/aa13334-09/img166.png)
|
Figure 9: Cumulative gas mass and total mass profiles in Abell 2204 from the SZE/X-ray joint analysis. The black data points (boxes) show the result using the de-projected temperature and density profiles, assuming hydrostatic equilibrium condition. The green data points (triangles) show the results from XMM-Newton analysis by ZF08 under the same assumption. The blue solid line is the best fit NFW model from weak lensing analysis by Corless et al. (2009), the hatched region at r200 indicates their quoted errors in M200. The lower red dashed line shows the gas mass profile computed directly from the de-projected electron density. |
| Open with DEXTER | |
![\begin{figure}
\par\includegraphics[width=7.5cm,clip]{13334fg10.eps}
\end{figure}](/articles/aa/full_html/2010/11/aa13334-09/img167.png)
|
Figure 10: Ratio of the total cluster mass derived from the hydrostatic equilibrium assumption, to the best fit NFW model obtained from the optical data. The cumulative total mass derived from APEX-SZ temperature measurements are consistent with the NFW model by Corless et al. (2009) under a spherical prior. For comparison, three data points from the stacking analysis for X-ray ( XMM-Newton) to weak lensing (Subaru) mass ratio in 5 low redshift relaxed clusters are shown (Zhang et al. 2010). |
| Open with DEXTER | |
Results from the non-parametric mass modeling are shown in Fig. 9,
in comparison with results from recent X-ray and weak lensing analyses.
The mass profile is in excellent agreement with the X-ray results
obtained under the same assumptions of spherical symmetry and
hydrostatic equilibrium (ZF08). The solid line in Fig. 9 refers to the best fit NFW model for A2204 from weak lensing analysis by Corless et al. (2009). The mean mass profile indicates a slowly rising integrated mass near r500,
resulting from the rapid fall in gas temperature near this radius,
although the results are still consistent with the NFW model from
Corless et al. (2009) within ![]() errors. ZF08 reports a value of
errors. ZF08 reports a value of
![]() from the X-ray modeling, and the weak lensing analysis under a spherical prior gives
from the X-ray modeling, and the weak lensing analysis under a spherical prior gives
![]() .
Our SZE/X-ray joint de-projection analysis predicts
.
Our SZE/X-ray joint de-projection analysis predicts
![]() ,
somewhat lower than the X-ray and weak lensing results. The
,
somewhat lower than the X-ray and weak lensing results. The ![]() upper limit on M200 from our analysis is
upper limit on M200 from our analysis is
![]() ,
again consistent with the Corless et al. (2009) maximum likelihood model prediction of
,
again consistent with the Corless et al. (2009) maximum likelihood model prediction of
![]() (shown by the blue hatched region in Fig. 9).
(shown by the blue hatched region in Fig. 9).
![\begin{figure}
\par\includegraphics[width=7.5cm,clip]{13334fg11.ps}
\end{figure}](/articles/aa/full_html/2010/11/aa13334-09/img174.png)
|
Figure 11:
The gas mass fraction obtained from the SZE-X/ray joint non-parametric
analysis (red squares). The hatched region is the measurement from
Afshordi et al. (2007)
from the stacking analysis of 193 massive clusters in the WMAP 3-year
data. The solid line is the prediction from the isothermal |
| Open with DEXTER | |
To show more clearly the deviation of the non-parametric mass modeling
under the HSE assumption from the weak lensing mass, we plot in
Fig. 10
the ratio of the hydrostatic mass and the mass derived from the weak
lensing analysis. Optical observations of A2204 are complicated by its
low galactic latitude and presence of a MV=5.6 star
![]() away from the center, making its shear profile in the cluster center
extremely noisy (Clowe & Schneider 2002). Thus we have used the
profile from the NFW model fit to the weak lensing data instead. The
ratio obtained is mostly consistent with 1 within
away from the center, making its shear profile in the cluster center
extremely noisy (Clowe & Schneider 2002). Thus we have used the
profile from the NFW model fit to the weak lensing data instead. The
ratio obtained is mostly consistent with 1 within ![]() statistical errors. The HSE assumption is expected to under-estimate
the total mass by 15-20% near the virial radius, due to the stochastic
gas motions caused by infalling matter (Nagai et al. 2007; Ameglio et al. 2009).
However, the current uncertainties on the APEX-SZ measurement of a
single cluster are too large to confirm any such trend. For comparison,
we have shown in Fig. 10 the recent results from the stacking analysis for the
statistical errors. The HSE assumption is expected to under-estimate
the total mass by 15-20% near the virial radius, due to the stochastic
gas motions caused by infalling matter (Nagai et al. 2007; Ameglio et al. 2009).
However, the current uncertainties on the APEX-SZ measurement of a
single cluster are too large to confirm any such trend. For comparison,
we have shown in Fig. 10 the recent results from the stacking analysis for the
![]() ratio using XMM-Newton and Subaru data of 5 relaxed clusters (Zhang et al. 2010).
Note however, that this joint X-ray/weak-lensing stacking analysis uses
the actual weak lensing shear measurements in clusters and not the
best-fit NFW profiles, which should cause their ratio to be closer to
unity than ours.
ratio using XMM-Newton and Subaru data of 5 relaxed clusters (Zhang et al. 2010).
Note however, that this joint X-ray/weak-lensing stacking analysis uses
the actual weak lensing shear measurements in clusters and not the
best-fit NFW profiles, which should cause their ratio to be closer to
unity than ours.
The integrated baryon fraction of the ICM as function of radius
is computed directly by dividing the gas mass by the total mass
obtained from the HSE assumption. The results from our non-parametric
analysis are shown in Fig. 11. The cosmic baryon fraction obtained from the WMAP 5-year result (
![]() ,
Dunkley et al. 2009) is shown in horizontal dot-dashed line. In the inner region of the cluster (
,
Dunkley et al. 2009) is shown in horizontal dot-dashed line. In the inner region of the cluster (
![]() )
the gas-to-mass ratio is clearly much lower than the cosmic baryon
fraction, and there is an indicative trend of increasing ICM mass
fraction at larger radii. Near r200 the cumulative value of
)
the gas-to-mass ratio is clearly much lower than the cosmic baryon
fraction, and there is an indicative trend of increasing ICM mass
fraction at larger radii. Near r200 the cumulative value of
![]() is statistically consistent with the cosmic value. Low values of gas
mass fraction near cluster centers is well known from X-ray studies;
Vikhlinin et al. (2006) have shown the value of
is statistically consistent with the cosmic value. Low values of gas
mass fraction near cluster centers is well known from X-ray studies;
Vikhlinin et al. (2006) have shown the value of
![]() at r2500 for a sample of nearby relaxed cluster to be in the range
0.04-0.1. It is interesting to note, however, that the gas mass fraction in Abell 2204 at r2500 is significantly lower than previous APEX-SZ measurements of this ratio in non-relaxed clusters. The integrated
at r2500 for a sample of nearby relaxed cluster to be in the range
0.04-0.1. It is interesting to note, however, that the gas mass fraction in Abell 2204 at r2500 is significantly lower than previous APEX-SZ measurements of this ratio in non-relaxed clusters. The integrated
![]() values in Abell 2163 at
values in Abell 2163 at
![]() were found to be consistent with the cosmic baryon fraction (NBP09), and HL09 measured the integrated
were found to be consistent with the cosmic baryon fraction (NBP09), and HL09 measured the integrated
![]() for the Bullet cluster (1E 0657-56) within r2500 and 1.42 Mpc to be in the range
0.18-0.22. One obvious explanation for the higher
for the Bullet cluster (1E 0657-56) within r2500 and 1.42 Mpc to be in the range
0.18-0.22. One obvious explanation for the higher
![]() value at the center of dynamically complex systems can be due to the
fact that merging activity will most likely cause the gas to remain at
the center while the dark matter halos are separated, thus causing an
increase in the gas-to-mass ratio. Also the central AGN in the strong
cool core cluster A2204 can be responsible for driving out the gas from
the innermost region (Bhattacharya et al. 2008; Puchwein et al. 2008).
value at the center of dynamically complex systems can be due to the
fact that merging activity will most likely cause the gas to remain at
the center while the dark matter halos are separated, thus causing an
increase in the gas-to-mass ratio. Also the central AGN in the strong
cool core cluster A2204 can be responsible for driving out the gas from
the innermost region (Bhattacharya et al. 2008; Puchwein et al. 2008).
The
![]() profile predicted from the isothermal
profile predicted from the isothermal ![]() -model (fit to the SZE data) is shown in Fig. 11. As noted in NBP09, our non-parametric modeling shows clear departure from the typical isothermal
-model (fit to the SZE data) is shown in Fig. 11. As noted in NBP09, our non-parametric modeling shows clear departure from the typical isothermal ![]() -model prediction of
-model prediction of
![]() at the cluster center. We have also shown for comparison the results for the stacking analysis of 193 massive clusters with
at the cluster center. We have also shown for comparison the results for the stacking analysis of 193 massive clusters with
![]() keV from the WMAP 3-year data by Afshordi et al. (2007). Note that the resolution of WMAP does not allow a direct measurement of the mean pressure profile in clusters down to
0.1r200, the hatched region is the prediction from their numerical simulations with
keV from the WMAP 3-year data by Afshordi et al. (2007). Note that the resolution of WMAP does not allow a direct measurement of the mean pressure profile in clusters down to
0.1r200, the hatched region is the prediction from their numerical simulations with
![]() prior that is consistent with the WMAP stacked measurement. The
stacking signal from WMAP data predicts a higher ICM mass fraction than
seen in A2204 near the center, although beyond r2500 they are consistent with each other within
prior that is consistent with the WMAP stacked measurement. The
stacking signal from WMAP data predicts a higher ICM mass fraction than
seen in A2204 near the center, although beyond r2500 they are consistent with each other within ![]() .
The difference near the center is expected, since the sample of Afshordi et al. (2007) contains both relaxed and non-relaxed clusters, which results in a higher average
.
The difference near the center is expected, since the sample of Afshordi et al. (2007) contains both relaxed and non-relaxed clusters, which results in a higher average
![]() value. If similar low gas-to-mass ratios are found consistently from
SZE observations of massive relaxed clusters, then in parallel with the
currently favored lower value of
value. If similar low gas-to-mass ratios are found consistently from
SZE observations of massive relaxed clusters, then in parallel with the
currently favored lower value of ![]() parameter (Komatsu et al. 2009), this will cause significantly low cluster yields in blind SZE surveys.
parameter (Komatsu et al. 2009), this will cause significantly low cluster yields in blind SZE surveys.
5.2 The entropy profile of the ICM
The entropy profile can be considered a more fundamental property for analyzing the thermodynamic state of the ICM than density or temperature, as it depends directly on the history of heating and cooling within the cluster. Consequently, cluster entropy profiles have received significant attention in X-ray studies (e.g. Voit et al. 2005; Morandi & Ettori 2007; Cavagnolo et al. 2009), but no direct measurement of entropy from SZE-derived temperatures have been done. The latter can potentially overcome the biases inherent in the X-ray spectral analysis, caused by gas clumping and substructures, and also from multiple temperature components near the cluster core. In this final part of our work we present the first SZE-derived entropy measurement in a cluster.
We adopt the standard definition of gas entropy used in the X-ray literature:
![]() (Ponman et al. 1999). This relates to the classical thermodynamic entropy in an ideal gas as
(Ponman et al. 1999). This relates to the classical thermodynamic entropy in an ideal gas as
![]() .
Simulations for self similar cluster models predict an entropy profile in the form of a power law:
.
Simulations for self similar cluster models predict an entropy profile in the form of a power law:
![]() (Tozzi & Norman 2001; Voit et al. 2005),
except at the very core of the cluster where excess entropy due to
non-gravitational heating processes tend to flatten the entropy
profile. This general behavior has been verified from numerous X-ray
observations (e.g. Lloyd-Davies et al. 2000; Morandi & Ettori 2007; Cavagnolo et al. 2009).
(Tozzi & Norman 2001; Voit et al. 2005),
except at the very core of the cluster where excess entropy due to
non-gravitational heating processes tend to flatten the entropy
profile. This general behavior has been verified from numerous X-ray
observations (e.g. Lloyd-Davies et al. 2000; Morandi & Ettori 2007; Cavagnolo et al. 2009).
![\begin{figure}
\par\includegraphics[width=7.5cm,clip]{13334fg12.eps}
\end{figure}](/articles/aa/full_html/2010/11/aa13334-09/img186.png)
|
Figure 12:
Comparison of entropy profile in A2204 from the SZE-X-ray joint analysis, and Chandra X-ray analysis by Sanders et al. (2008). The red triangles are from the Chandra data, shown without errors. The dotted line is the best fit entropy profile of the form
|
| Open with DEXTER | |
The entropy profile of Abell 2204 obtained from the SZE temperature measurements is shown in Fig. 12. Also shown are the radial entropy values obtained by Sanders et al. (2009) from the Chandra
measurements (triangles). The statistical errors in their measurements
are comparable with the symbol sizes and much smaller than the present
SZE measurement errors (although note that the systematic uncertainties
should dominate the errors in the outer Chandra bins, which was not shown by Sanders et al. 2009).
The two measurements agree within the ![]() uncertainties of our analysis. The agreement between the APEX-SZ and Chandra values within the central
uncertainties of our analysis. The agreement between the APEX-SZ and Chandra values within the central
![]() radius shows that any downward bias on the APEX-SZ value due to PSF smearing is sufficiently small.
The dotted line in Fig. 12 is the power-law prediction from self-similar cluster models, fitted to our entropy measurement within 8' radius.
radius shows that any downward bias on the APEX-SZ value due to PSF smearing is sufficiently small.
The dotted line in Fig. 12 is the power-law prediction from self-similar cluster models, fitted to our entropy measurement within 8' radius.
A flattening of the entropy profile near the virial radius of clusters has been measured only very recently from X-ray spectral analysis with Suzaku data: for PKS 0745-191 (z=0.10, George et al. 2009) and Abell 1795 (z=0.06, Bautz et al. 2009). Note that the result of Bautz et al. (2009) was obtained by extrapolating the values within r500. Such flattening or dropping entropy profile is another indicator of the non-thermal pressure support in the cluster outskirts. From the mean de-projected radial density and temperature profiles, we also see similar flattening for Abell 2204 near r500 (Fig. 12), but the statistical uncertainties in these SZE measurements are too large which makes our profile compatible with the power law scaling of the self similar cluster models.
The 1 arcmin resolution of the APEX-SZ experiment is sufficient to
compare the gas entropy at the cluster cores for low and intermediate
redshift massive clusters (
![]() ).
As mentioned before, this comparison is important in analyzing the
cluster dynamical states, by comparing the extent of non-gravitational
heating or cooling at the cluster core. We have used the results for
Abell 2163 from the analysis in NBP09, which is a good example of
a dynamically complex cluster which most likely has undergone a merging
event (Maurogordato et al. 2008). The data for A2163 is analyzed
with the same radial binning as for A2204 used in the current paper.
The comparison of the entropy profiles between these two clusters is
shown in Fig. 13. The
difference in the central entropy values is clearly seen. Although the
central bin errors are possibly under-estimated by a small amount
because of neglecting PSF extension, the statistical significance of
the entropy difference (
).
As mentioned before, this comparison is important in analyzing the
cluster dynamical states, by comparing the extent of non-gravitational
heating or cooling at the cluster core. We have used the results for
Abell 2163 from the analysis in NBP09, which is a good example of
a dynamically complex cluster which most likely has undergone a merging
event (Maurogordato et al. 2008). The data for A2163 is analyzed
with the same radial binning as for A2204 used in the current paper.
The comparison of the entropy profiles between these two clusters is
shown in Fig. 13. The
difference in the central entropy values is clearly seen. Although the
central bin errors are possibly under-estimated by a small amount
because of neglecting PSF extension, the statistical significance of
the entropy difference (![]()
![]() )
is sufficiently high. Outside the central
)
is sufficiently high. Outside the central ![]() 2 arcmin the two profiles are consistent with each other and both follow the
2 arcmin the two profiles are consistent with each other and both follow the ![]() r1.1
scaling law. It is interesting to note that the merging system A2163
shows better agreement with the power law scaling than the relaxed
cluster A2204. Using a
r1.1
scaling law. It is interesting to note that the merging system A2163
shows better agreement with the power law scaling than the relaxed
cluster A2204. Using a ![]() statistic to describe the goodness of fit is problematic because of the
noise correlation, nevertheless, it can be used to compare the results
between two clusters. A fit with the expected power law scaling
excluding the inner- and outermost bins for A2204 gives
statistic to describe the goodness of fit is problematic because of the
noise correlation, nevertheless, it can be used to compare the results
between two clusters. A fit with the expected power law scaling
excluding the inner- and outermost bins for A2204 gives
![]() ,
and for A2163 it is
,
and for A2163 it is
![]() .
.
![\begin{figure}
\par\includegraphics[width=8cm,clip]{13334fg13.eps}
\end{figure}](/articles/aa/full_html/2010/11/aa13334-09/img193.png)
|
Figure 13: Comparison between entropy profiles for A2204 (black, diamonds) and A2163 (blue, squares). The increased entropy value in the central region of A2163 supports the merging nature of this cluster, whereas the continually decreasing entropy towards the center in A2204 shows its dynamically relaxed state. |
| Open with DEXTER | |
6 Conclusions
- 1.
- We describe the detailed application of a direct, nonparametric de-projection method of cluster density and temperature profiles, using APEX-SZ and XMM-Newton data. The method was presented in NBP09, the current paper builds upon the previous work by applying this technique to the well-studied relaxed cluster Abell 2204.
- 2.
- Analysis of both SZE and X-ray data have been done from their raw data sets, to create images and radial profile. In particular, we describe the creation of a set of SZE radial profiles, all consistent with the APEX-SZ measurement, to characterize the statistical uncertainties on the bin values and minimize the numerical errors in Abel's de-projection method. Our final results are dominated by the statistical uncertainties in the SZE data, the signal at r200 is essentially an upper limit for A2204. We describe the different sources of systematic uncertainties and include them in the analysis.
- 3.
- The decreasing gas temperature in the cluster outskirts is
demonstrated for the first time from SZE measurements, using a broad
re-binning of the APEX-SZ (and X-ray) data. The temperature drop can be
confirmed to
 confidence level. We also compare the direct de-projected pressure
profile with some parametric models, and show that the Nagai profile is
adequate for modeling the gas pressure, within the current statistical
uncertainties in APEX-SZ imaging of a single cluster.
confidence level. We also compare the direct de-projected pressure
profile with some parametric models, and show that the Nagai profile is
adequate for modeling the gas pressure, within the current statistical
uncertainties in APEX-SZ imaging of a single cluster.
- 4.
- We re-perform the X-ray spectral analysis for the ICM temperature profile from publicly available Chandra data, primarily to find the changes from the recent calibration updates (CALDB 4), but also to show the effect of systematic uncertainties due to the background modeling in the X-ray spectral analysis. A comparison with the projected temperature profile obtained from SZE data confirms that our SZE derived temperature values are much less affected by systematic uncertainties at large radii, in comparison with Chandra and XMM-Newton. Precise comparison between the SZE and X-ray spectroscopic measurements of the gas temperature in the cluster outskirts will be a promising method to constrain gas clumping and non-LTE effects.
- 5.
- The integrated total mass profile is computed assuming
hydrostatic equilibrium for the cluster gas. The mass profile is in
excellent agreement with the recent X-ray and weak lensing analyses.
Our model prediction for M500 is
 .
This is somewhat lower than the X-ray and lensing results but consistent within
.
This is somewhat lower than the X-ray and lensing results but consistent within  errors. The upper limit on M200 from our analysis is in good agreement with the published NFW model fit from weak lensing analysis of A2204.
- 6.
- The ICM mass fraction as function of radius is computed using the non-parametric modeling, and found to be below 0.1 within r500. The low
 value in A2204 in the cluster center is in contrast with the previous
APEX-SZ measurement of this ratio for Abell 2163 and the Bullet
cluster.
value in A2204 in the cluster center is in contrast with the previous
APEX-SZ measurement of this ratio for Abell 2163 and the Bullet
cluster.
- 7.
- We compute the ICM entropy profile from SZE/X-ray joint
analysis and confirm the general agreement with the self-similar
cluster model predictions within the present statistical uncertainties.
The significance of the APEX-SZ measurement of A2204 is not
sufficiently high at
 to constrain the slope of the entropy profile in the cluster outskirts.
- 8.
- We compare the entropy profiles of Abell 2204 (relaxed)
and Abell 2163 (merging system), using the same non-parametric
SZE/X-ray de-projection and radial binning, and find a clear entropy
difference in their central 200 kpc. This corresponds to the different
dynamical states of these two clusters and seen for the first time from
SZE derived
 measurement.
We appreciate the comments from the anonymous referee which have improved the discussion on the future applicability of this method. We thank the APEX staff for their assistance during APEX-SZ observations. This work has been partially supported by the DFG Priority Programme 1177 and Transregio Programme TR33. APEX is a collaboration between the Max-Planck-Institut für Radioastronomie, the European Southern Observatory, and the Onsala Space Observatory. APEX-SZ is funded by the National Science Foundation under Grant No. AST-0138348. The XMM-Newton project is an ESA Science Mission with instruments and contributions directly funded by ESA Member States and the USA (NASA). The XMM-Newton project is supported by the Bundesministerium für Wirtschaft und Technologie/Deutsches Zentrum für Luft- und Raumfahrt (BMWI/DLR, FKZ 50 OX 0001) and the Max-Planck Society. K.B. acknowledges Hans Böhringer for discussion and reading the manuscript. Y.Y.Z. and T.H.R. acknowledges support by the DFG through Emmy Noether Research Grant RE 1462/2 and by the BMBF/DLR grant No. 50 OR 0601. M.N. and F.P.N. acknowledges support for this research through the International Max Planck Research School (IMPRS) for Radio and Infrared Astronomy at the Universities of Bonn and Cologne.
References
- Afshordi, N., Lin, Y.-T., Nagai, D., & Sanderson, A. J. R. 2007, MNRAS, 378, 293 [NASA ADS] [CrossRef] [Google Scholar]
- Ameglio, S., Borgani, S., Pierpaoli, E., & Dolag, K. 2007, MNRAS, 382, 397 [NASA ADS] [CrossRef] [Google Scholar]
- Ameglio, S., Borgani, S., Pierpaoli, E., et al. 2009, MNRAS, 394, 479 [NASA ADS] [CrossRef] [Google Scholar]
- Arnaud, M., Pointecouteau, E., & Pratt, G. 2005, A&A, 441, 893 [NASA ADS] [CrossRef] [EDP Sciences] [Google Scholar]
- Bautz, M., Miller, E. D., Sanders, J., et al. 2009, PASJ, 61, 1117 [NASA ADS] [Google Scholar]
- Bhattacharya, S., Di Matteo, T., & Kosowski, A. 2008, MNRAS, 389, 34 [NASA ADS] [CrossRef] [Google Scholar]
- Birkinshaw, M. 1999, Phys. Rep., 310, 97 [NASA ADS] [CrossRef] [Google Scholar]
- Cavagnolo, K., Donahue, M., Voit, G. M., et al. 2009, ApJS, 182, 12 [NASA ADS] [CrossRef] [Google Scholar]
- Cavaliere, A., & Fusco-Femiano, R. 1978, A&A, 70, 677 [NASA ADS] [Google Scholar]
- Condon, J. J., Cotton, W. D., Greisen, E. W., et al. 1998, AJ, 115, 1693 [NASA ADS] [CrossRef] [Google Scholar]
- Corless, V. L., King, L. J., & Clowe, D. 2009, MNRAS, 393, 1235 [NASA ADS] [CrossRef] [Google Scholar]
- De Filippis, E., Sereno, M., Bautz, M. W., & Longo, G. 2005, ApJ 625, 108 [NASA ADS] [CrossRef] [Google Scholar]
- Dobbs, M., Halverson, N., Ade, P. A. R., et al. 2006, NewAR, 50, 960 [NASA ADS] [CrossRef] [Google Scholar]
- Dunkley, J., Komatsu, E., Nolta, N., et al. 2009, ApJS, 180, 306 [NASA ADS] [CrossRef] [Google Scholar]
- Evrard, A. E., Metzler, C., & Navarro, J. 1996, ApJ, 469, 494 [NASA ADS] [CrossRef] [Google Scholar]
- Finoguenov, A., Reiprich, T. H., & Böhringer, H. 2001, A&A, 368, 749 [NASA ADS] [CrossRef] [EDP Sciences] [Google Scholar]
- Fujita, Y., Noriaki, T., Kiyoshi, H., et al. 2008, PASJ, 60S, 343 [Google Scholar]
- George, M., Fabian, A., Sanders, J., et al. 2009, MNRAS 395, 657 [NASA ADS] [CrossRef] [Google Scholar]
- Gorski, K. M., Hivon, E., Banday, A. J. 2005, ApJ, 622, 759 [NASA ADS] [CrossRef] [Google Scholar]
- Hallman, E. J., Burns, J., Motl, P., & Norman, M. 2007, ApJ, 665, 911 [NASA ADS] [CrossRef] [Google Scholar]
- Halverson N., Lanting, T., Basu, K., et al. 2009, ApJ, 701, 42 (HL09) [NASA ADS] [CrossRef] [Google Scholar]
- Hudson, D. S., Mittal, R., Reiprich, T. H., et al. 2010, A&A, 513, A37 [NASA ADS] [CrossRef] [EDP Sciences] [Google Scholar]
- Hughes, J., & Birkinshaw, M. 1998, ApJ, 501, 1 [NASA ADS] [CrossRef] [Google Scholar]
- Holzapfel, W. L., Arnaud, M., Ade, P. A. R., et al. 1997, ApJ, 480, 449 [NASA ADS] [CrossRef] [Google Scholar]
- Jia, S. M., Böhringer, H., Pointecouteau, E., et al. 2008, A&A, 489, 1 [NASA ADS] [CrossRef] [EDP Sciences] [Google Scholar]
- Kaastra, J. S. 1992, An X-Ray Spectral Code for Optically Thin Plasmas (Internal SRON-Leiden Report) [Google Scholar]
- Kitayama, T., Komatsu, E., Ota, N., et al. 2004, PASJ, 56, 17 [NASA ADS] [Google Scholar]
- Knudsen, K. K., van der Werf, P. P., & Kneib, J.-P. 2008, MNRAS, 384, 161 [NASA ADS] [CrossRef] [Google Scholar]
- Kriss, G. A., Cioffi, D., & Canizares, C. R. 1983, ApJ, 272, 439 [NASA ADS] [CrossRef] [Google Scholar]
- Lee, J., Suto, Y. 2004, ApJ, 601, L599 [NASA ADS] [CrossRef] [Google Scholar]
- Lloyd-Davies, E., Ponman, T., & Cannon, D. 2000, MNRAS, 315, 689 [NASA ADS] [CrossRef] [Google Scholar]
- Mahdavi, A., Hoekstra, E., Babul, A., et al. 2007, ApJ, 664, 162 [NASA ADS] [CrossRef] [Google Scholar]
- Markevitch, M., Forman, W., Sarazin, C. L., & Vikhlinin, A. 1998, ApJ, 503, 77 [NASA ADS] [CrossRef] [Google Scholar]
- Mazzotta, P., Rasia, E., Moscardini, L., & Tormen, G. 2004, MNRAS, 354, 10 [NASA ADS] [CrossRef] [Google Scholar]
- Mewe, R., Gronenschild, E., & van den Oord, G. 1985, A&AS, 62, 197 [Google Scholar]
- Morandi, S., & Ettori, S. 2007, MNRAS, 380, 1521 [NASA ADS] [CrossRef] [Google Scholar]
- Mroczkowski, T., Bonamente, M., Carlstrom, J., et al. 2009, ApJ, 694, 103 [Google Scholar]
- Nagai, D., Sulkanen, M. E., & Evrard, A. E. 2000, MNRAS, 316, 120 [NASA ADS] [CrossRef] [Google Scholar]
- Nagai, D., Kravtsov, A., & Vikhlinin, A. 2007, ApJ, 668, 1 [NASA ADS] [CrossRef] [Google Scholar]
- Nord, M. 2009, Ph.D. Thesis [Google Scholar]
- Nord, M., Basu, K., Pacaud, F., et al. 2009, A&A, 506, 623 (NBP09) [NASA ADS] [CrossRef] [EDP Sciences] [Google Scholar]
- Ponman, T., Cannon, D., & Navarro, J. 1999, Nature, 397, 135 [NASA ADS] [CrossRef] [Google Scholar]
- Puchwein, E., Bartelmann, M. 2006, A&A, 442, 405 [NASA ADS] [CrossRef] [EDP Sciences] [Google Scholar]
- Puchwein, E., Sijacki, D., & Springel, V. 2008, ApJ, 687, L53 [NASA ADS] [CrossRef] [Google Scholar]
- Quillen, A., Zufelt, N., Park, J., et al. 2008, ApJS, 176, 39 [NASA ADS] [CrossRef] [Google Scholar]
- Reese, E. D., Carlstrom, J. E., Joy, M., et al. 2002, ApJ, 581, 53 [NASA ADS] [CrossRef] [Google Scholar]
- Reiprich, T. H., & Böhringer, H. 2002, ApJ, 567, 716 [NASA ADS] [CrossRef] [Google Scholar]
- Reiprich, T. H., Hudson, D., Zhang, Y.-Y., et al. 2009, A&A, 501, 899 [NASA ADS] [CrossRef] [EDP Sciences] [Google Scholar]
- Reichardt, C., Zahn, O., Basu, K., et al. 2009, ApJ, 701, 1958 [NASA ADS] [CrossRef] [Google Scholar]
- Rudd, D., & Nagai, D. 2009, ApJ, 701, L16 [NASA ADS] [CrossRef] [Google Scholar]
- Sanders, J., Fabian, A., & Taylor, G. 2009, MNRAS, 393, 71 [NASA ADS] [CrossRef] [Google Scholar]
- Sarazin, C. L. 1988, X-ray Emission from Clusters of Galaxies (Cambridge University Press) [Google Scholar]
- Silk, J., & White, S. D. M. 1978, ApJ, 226L, 103 [Google Scholar]
- Snowden, S., Mushotzky, R., Kuntz, K., & Davis, D. 2008, A&A, 478, 615 [NASA ADS] [CrossRef] [EDP Sciences] [Google Scholar]
- Solovyeva, L., Anokhin, S., Sauvageot, J., et al. 2007, A&A, 476, 63 [NASA ADS] [CrossRef] [EDP Sciences] [Google Scholar]
- Staniszewski, Z., Ade, P. A. R., Aird, K., et al. 2009, ApJ, 701, 32 [CrossRef] [Google Scholar]
- Sunyaev, R. A., Zel'dovich, Y. B. 1970, Ap&SS, 7, 3 [NASA ADS] [Google Scholar]
- Tozzi, P., & Norman, C. 2001, ApJ, 546, 63 [NASA ADS] [CrossRef] [Google Scholar]
- Vikhlinin, A., Markevitch, M., Murray, S. S., et al. 2005, ApJ, 628, 655 [NASA ADS] [CrossRef] [Google Scholar]
- Vikhlinin, A., Kravtsov, A., Forman, W., et al. 2006, ApJ, 640, 691 [NASA ADS] [CrossRef] [Google Scholar]
- Voit, G. M., Kay, S., & Bryan, G. 2005, MNRAS, 364, 909 [NASA ADS] [CrossRef] [Google Scholar]
- Yoshikawa, K., & Suto, Y. 1999, ApJ, 513, 549 [NASA ADS] [CrossRef] [Google Scholar]
- Yuan, Q., Zhang, T.-Z., & Wang, B.-Q. 2008, ChJAA, 8, 671 [NASA ADS] [Google Scholar]
- Zaroubi, S., Squires, G., de Gasperis, G., et al. 2001, ApJ, 561, 600 [NASA ADS] [CrossRef] [Google Scholar]
- Zhang, T.-J., & Wu, X.-P. 2000, ApJ, 545, 141 [NASA ADS] [CrossRef] [Google Scholar]
- Zhang, Y.-Y., Finoguenov, A., et al. 2008, A&A, 482, 521 (ZF08) [Google Scholar]
- Zhang, Y.-Y., Reiprich, T., Finoguenov, A., et al. 2009, ApJ, 699, 1178 [NASA ADS] [CrossRef] [Google Scholar]
- Zhang, Y.-Y., Okabe, N., Finoguenov, A., et al. 2010, ApJ, 711, 1033 [NASA ADS] [CrossRef] [Google Scholar]
All Tables
Table 1: The input X-ray surface brightness and SZE temperature decrement values at each radial bin, and the different de-projected quantities derived from these two observables.
All Figures
|
|
Figure 1:
|
| Open with DEXTER | |
In the text
|
|
Figure 2: X-ray surface brightness profile from the XMM-Newton map in black squares, converted to physical units. The profile has been convolved and re-binned to match the APEX-SZ resolution. The errors include the systematic uncertainties due to background modeling and are incorporated in the de-projection analysis. Over-plotted in green are the surface brightness values prior to re-binning. |
| Open with DEXTER | |
| In the text | |
|
|
Figure 3:
|
| Open with DEXTER | |
| In the text | |
|
|
Figure 4:
Radial profile of the SZE temperature decrement at 150 GHz.
The profile obtained from the raw reduction is shown by the blue
diamonds, and the mean deconvolved profile by the red squares. The
errors on the deconvolved profile represent the |
| Open with DEXTER | |
| In the text | |
|
|
Figure 5:
Top panel: the de-projected electron density
with corresponding
errors. The dashed line is the density profile from ZF08, obtained from
fitting a double |
| Open with DEXTER | |
| In the text | |
|
|
Figure 6: The
APEX-SZ measurement
of the outer temperature profile in the cluster A2204, as compared to
simulations and X-ray spectral measurements. The two data points
represent the SZE-derived temperature values with |
| Open with DEXTER | |
| In the text | |
|
|
Figure 7: Comparison
of the
projected gas temperature profile in A2204 deduced from APEX-SZ data
(blue, solid boundaries) with X-ray spectral measurements from Chandra
data (red, dashed boundaries). The Chandra spectral
analysis has been re-performed taking the latest calibration update
into account. The hatched regions show the |
| Open with DEXTER | |
| In the text | |
|
|
Figure 8:
Comparison of the de-projected pressure profile with commonly used
parametric models. The data points with errors show the result of
direct inversion of the SZE temperature decrement map using Abel's
integral. The red (solid) line is the best fit isothermal |
| Open with DEXTER | |
| In the text | |
|
|
Figure 9: Cumulative gas mass and total mass profiles in Abell 2204 from the SZE/X-ray joint analysis. The black data points (boxes) show the result using the de-projected temperature and density profiles, assuming hydrostatic equilibrium condition. The green data points (triangles) show the results from XMM-Newton analysis by ZF08 under the same assumption. The blue solid line is the best fit NFW model from weak lensing analysis by Corless et al. (2009), the hatched region at r200 indicates their quoted errors in M200. The lower red dashed line shows the gas mass profile computed directly from the de-projected electron density. |
| Open with DEXTER | |
| In the text | |
|
|
Figure 10: Ratio of the total cluster mass derived from the hydrostatic equilibrium assumption, to the best fit NFW model obtained from the optical data. The cumulative total mass derived from APEX-SZ temperature measurements are consistent with the NFW model by Corless et al. (2009) under a spherical prior. For comparison, three data points from the stacking analysis for X-ray ( XMM-Newton) to weak lensing (Subaru) mass ratio in 5 low redshift relaxed clusters are shown (Zhang et al. 2010). |
| Open with DEXTER | |
| In the text | |
|
|
Figure 11:
The gas mass fraction obtained from the SZE-X/ray joint non-parametric
analysis (red squares). The hatched region is the measurement from
Afshordi et al. (2007)
from the stacking analysis of 193 massive clusters in the WMAP 3-year
data. The solid line is the prediction from the isothermal |
| Open with DEXTER | |
| In the text | |
|
|
Figure 12:
Comparison of entropy profile in A2204 from the SZE-X-ray joint
analysis, and Chandra X-ray analysis by Sanders
et al. (2008). The red triangles are from the Chandra
data, shown without errors. The dotted line is the best fit entropy
profile of the form |
| Open with DEXTER | |
| In the text | |
|
|
Figure 13: Comparison between entropy profiles for A2204 (black, diamonds) and A2163 (blue, squares). The increased entropy value in the central region of A2163 supports the merging nature of this cluster, whereas the continually decreasing entropy towards the center in A2204 shows its dynamically relaxed state. |
| Open with DEXTER | |
| In the text | |
Current usage metrics show cumulative count of Article Views (full-text article views including HTML views, PDF and ePub downloads, according to the available data) and Abstracts Views on Vision4Press platform.
Data correspond to usage on the plateform after 2015. The current usage metrics is available 48-96 hours after online publication and is updated daily on week days.
Initial download of the metrics may take a while.