| Issue |
A&A
Volume 511, February 2010
|
|
|---|---|---|
| Article Number | A25 | |
| Number of page(s) | 11 | |
| Section | Galactic structure, stellar clusters, and populations | |
| DOI | https://doi.org/10.1051/0004-6361/200912780 | |
| Published online | 26 February 2010 | |
A photometric and spectroscopic
investigation of star formation in the very young open cluster
NGC 6383![[*]](/icons/foot_motif.png) ,
,
G. Rauw1,![]() - J. Manfroid1,
- J. Manfroid1,![]() - M. De Becker1,
- M. De Becker1,![]()
GAPHE, Institut d'Astrophysique et de Géophysique, Université de Liège, Allée du 6 Août 17, Bât. B5c, 4000 Liège, Belgium
Received 29 June 2009 / Accepted 26 November 2009
Abstract
Context. The very young open cluster
NGC 6383 centered on the O-star binary HD 159176 is
an interesting place for studying the impact of early-type stars with
strong radiation fields and powerful winds on the formation processes
of low-mass stars.
Aims. To investigate this process, it is necessary
to determine the characteristics (age, presence, or absence of
circumstellar material) of the population of low-mass pre-main-sequence
(PMS) stars in the cluster.
Methods. We obtained deep UBV
![]() photometric data of the entire cluster as well as medium-resolution
optical spectroscopy of a subsample of X-ray selected objects.
photometric data of the entire cluster as well as medium-resolution
optical spectroscopy of a subsample of X-ray selected objects.
Results. Our spectroscopic data reveal only very
weak H![]() emission lines in a few X-ray selected PMS candidates. We
photometrically identify a number of H
emission lines in a few X-ray selected PMS candidates. We
photometrically identify a number of H![]() emission candidates but their cluster membership is uncertain. We find
that the fainter objects in the field of view have a wide range of
extinction (up to AV
= 20), one X-ray selected OB star having
emission candidates but their cluster membership is uncertain. We find
that the fainter objects in the field of view have a wide range of
extinction (up to AV
= 20), one X-ray selected OB star having ![]() .
.
Conclusions. Our investigation uncovers a population
of PMS stars in NGC 6383 that are probably coeval with
HD 159176. In addition, we detect a population of reddened
objects that are probably located at different depths within the natal
molecular cloud of the cluster. Finally, we identify a rather complex
spatial distribution of H![]() emitters, which is probably indicative of a severe contamination by
foreground and background stars.
emitters, which is probably indicative of a severe contamination by
foreground and background stars.
Key words: stars: pre-main sequence - X-rays: stars - open clusters and associations: individual: NGC 6383
1 Introduction
Substantial efforts have been dedicated to the investigation of the low-mass star formation process in very young open clusters harbouring a population of early-type stars. Many of these studies were inspired by X-ray observations of these open clusters (with either Chandra or XMM-Newton) that found a wealth of moderately bright X-ray sources associated with low-mass pre-main-sequence (PMS) stars (e.g., Prisinzano et al. 2005; Sana et al. 2007). A strong and often variable X-ray emission is frequently observed for PMS stars in the classical and the weak-line T Tauri (hereafter cTTs and wTTs respectively) stage. However, enhanced X-ray emission is only one characteristic of PMS stars; in addition to a Li overabundance, position in a colour-magnitude diagram, photometric variability, HIn this paper, we consider the case of the very young cluster
NGC 6383. The cluster distance was consistently determined to
be ![]() kpc, while the
reddening towards the brighter cluster members corresponds to
kpc, while the
reddening towards the brighter cluster members corresponds to ![]() (for a review of the cluster properties, see Rauw & DeBecker 2008, and
references therein). NGC 6383 is centered on the massive
O7((f)) V + O7((f)) V binary HD 159176
(Linder et al. 2007)
and an XMM-Newton observation detected 76 X-ray
sources (Rauw et al. 2003)
in addition to HD 159176 (De Becker et al. 2004). Most of these
secondary sources were considered to be PMS stars or at least PMS
candidates (Rauw et al. 2003,
hereafter Paper I). To ascertain the status of these objects, we
obtained optical spectroscopy of a subsample of the X-ray selected
objects as well as multi-band photometry of the cluster as a whole. The
present paper reports the analysis of these data.
(for a review of the cluster properties, see Rauw & DeBecker 2008, and
references therein). NGC 6383 is centered on the massive
O7((f)) V + O7((f)) V binary HD 159176
(Linder et al. 2007)
and an XMM-Newton observation detected 76 X-ray
sources (Rauw et al. 2003)
in addition to HD 159176 (De Becker et al. 2004). Most of these
secondary sources were considered to be PMS stars or at least PMS
candidates (Rauw et al. 2003,
hereafter Paper I). To ascertain the status of these objects, we
obtained optical spectroscopy of a subsample of the X-ray selected
objects as well as multi-band photometry of the cluster as a whole. The
present paper reports the analysis of these data.
2 Observations
Low-resolution spectra of a set of X-ray selected stars in NGC 6383, taken from Paper I, were obtained on the night of June 22-23, 2004 with the EMMI instrument mounted on ESO's 3.5 m New Technology Telescope (NTT) at La Silla. The EMMI instrument was used in the Red Imaging and Low Dispersion Spectroscopy (RILD) mode with grism # 5 (600 grooves mm-1), providing a wavelength coverage from about 3800 to 7020 Å. This instrumental configuration yields a spectral resolution of 5.0 Å (FWHM of the He-Ar lines in the wavelength calibration exposures). The targets selected for spectroscopy were the brightest X-ray sources found to have a single optical counterpart within the 8 arcsec correlation radius used in Paper I. Their V magnitudes range from about 11.3 to 17.9. The exposure times were between 5 and 40 min depending on the magnitude of the targets. The data were reduced in the standard way using the long context of the MIDAS package. The observing conditions were photometric over most parts of the night and we thus performed a relative flux calibration of our spectra against an observation of the spectrophotometric standard star LTT 9239 (Hamuy et al. 1992).Photometric observations of the cluster were obtained with the Wide
Field Imager (WFI) instrument at the ESO/MPG 2.2 m telescope
at La Silla during two observing runs in September 2003 (service mode)
and June 2004 (visitor mode). The WFI instrument has a field of view of
about ![]() covered by a mosaic of
covered by a mosaic of ![]() CCD chips with a pixel size of 0.238 arcsec/pixel. The frames
were taken through a set of UBV
CCD chips with a pixel size of 0.238 arcsec/pixel. The frames
were taken through a set of UBV
![]() filters (see Table 1)
with various exposure times (from 1 second to about 10 min, depending
on the filter) to allow measurements of both faint and moderately
bright objects. Our photometric data are complete to magnitudes of
about 20.5, 22.5, 22.0, 21.5, 20.5, and 20.5 for the U,
B, V,
filters (see Table 1)
with various exposure times (from 1 second to about 10 min, depending
on the filter) to allow measurements of both faint and moderately
bright objects. Our photometric data are complete to magnitudes of
about 20.5, 22.5, 22.0, 21.5, 20.5, and 20.5 for the U,
B, V, ![]() ,
,
![]() ,
and H
,
and H![]() filters, respectively.
filters, respectively.
The data were bias subtracted and flat fielded using the IRAF package. The raw images consist of dithered observations performed to fill the gaps between the WFI CCDs. The photometry in the natural system was obtained with the DAOPHOT software in two steps: a first pass on stacked, registered images in all filters allowed us to produce a deep catalogue of sources. In a second pass, the photometry of these sources was obtained for the individual CCDs with apertures of 4, 5, 8, and 11 pixel diameter (i.e., 0.95, 1.2, 1.9, and 2.6 arcsec). The larger aperture data were used to perform all-sky photometry. After a number of iterations, satisfactory zeropoints and extinction coefficients were obtained. To determine the latter, seven Stetson (BVRI) and Landolt (BVRI) standard fields were observed during the same nights. In addition, UBVRI data for 8 stars in NGC 6383 were obtained from FitzGerald et al. (1978), Thé et al. (1985) and Zwintz et al. (2005). The data of the individual frames were then homogenized using bright isolated stars as secondary standards with values determined from the all-sky photometry. The astrometry was established by matching the instrumental coordinates with the 2MASS point source catalogue. The 1.2 arcsec aperture is well suited to our analysis in terms of both accuracy and sensitivity to crowding in the field. In the following, we use the photometry corresponding to this aperture, except when stated otherwise.
Table 1: The filters used in the photometric campaigns with the WFI.
|
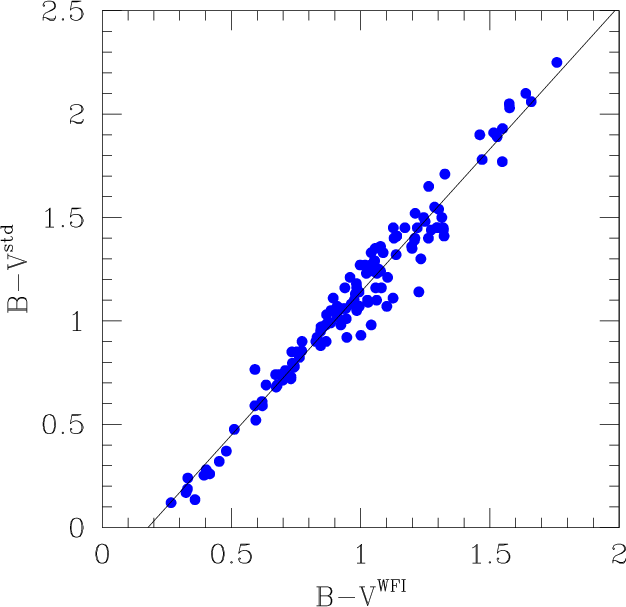
Figure 1: Comparison between the B-V colour index in the WFI system and the standard system for 156 stars selected as the best observed among those in common with Paunzen et al. (2007). The solid line yields our best-fit colour transformation. |
| Open with DEXTER | |
The passbands of the WFI filters, and in particular that of the B
filter, are rather non-standard. Unfortunately, the limited number of
observed standard stars did not cover a sufficient range of spectral
types to establish precise colour transformations from these standards.
Therefore, we compared our WFI photometric data in the natural system
with published Johnson-Cousins photometry of stars in common in
NGC 6383. In this context, we established a colour
transformation (Fig. 1)
based on the comparison between our ![]() magnitudes and
magnitudes and ![]() colours and the standard BV photometry for 156
stars in common with the (online) Table 1 of Paunzen
et al. (2007).
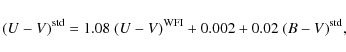
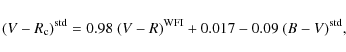
The resulting relations are
colours and the standard BV photometry for 156
stars in common with the (online) Table 1 of Paunzen
et al. (2007).
The resulting relations are![]()
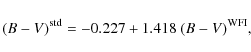
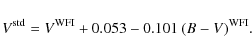
The coefficients of the colour terms of these relations are in reasonable agreement with those proposed by ESO on the WFI instrument website
In the following, we applied these transformations to all of our data. Unless stated otherwise, all colours given in this paper refer to the transformed colours
|
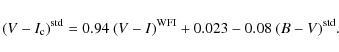
Figure 2:
Left and middle panel: flux-calibrated
spectra of the F-K type stars in our spectroscopic sample of
NGC 6383. The fluxes were arbitrarily normalized to unity at
the wavelength of 6820 Å and the spectra were shifted
vertically by 0.4 units for clarity. The spectral types become
progressively later from left to right and from top to bottom.
The rightmost panel shows a zoom on the spectral region
around the H |
| Open with DEXTER | |
Because of its special passband definition and a lack of suitable
standard fields, the H![]() filter in use at the WFI cannot be directly tied to any existing
standard photometric system. In the natural system, the
filter in use at the WFI cannot be directly tied to any existing
standard photometric system. In the natural system, the ![]() zeropoint was at first fixed arbitrarily to zero for the standard
stars. In a second step, we re-calibrated the zeropoint by comparing
the observed
zeropoint was at first fixed arbitrarily to zero for the standard
stars. In a second step, we re-calibrated the zeropoint by comparing
the observed ![]() and dereddened
and dereddened ![]() indices of 9 stars whose spectra do not exhibit H
indices of 9 stars whose spectra do not exhibit H![]() emission with the
emission with the ![]() versus
versus ![]() relation of emission-free main-sequence stars in NGC 2264 as
determined by Sung et al. (1997).
To express the
relation of emission-free main-sequence stars in NGC 2264 as
determined by Sung et al. (1997).
To express the ![]() indices in the system of Sung et al. (1997), we need to
subtract
indices in the system of Sung et al. (1997), we need to
subtract ![]() from the observed indices. All values of the
from the observed indices. All values of the ![]() index quoted in this paper and all plots involving this index refer to
the Sung et al. (1997)
system.
index quoted in this paper and all plots involving this index refer to
the Sung et al. (1997)
system.
3 Spectroscopy
To establish the MK spectral types of the targets in NGC 6383,
we used the digital spectral classification atlas compiled by R.O. Gray
available on the web![]() .
The details of the classification are given for each star in
Appendix A.
The results are summarized in Table 3.
.
The details of the classification are given for each star in
Appendix A.
The results are summarized in Table 3.
The majority of the spectroscopically studied objects are
late-type (F-K) main-sequence or slightly more luminous stars (see
Fig. 2
and Table 3).
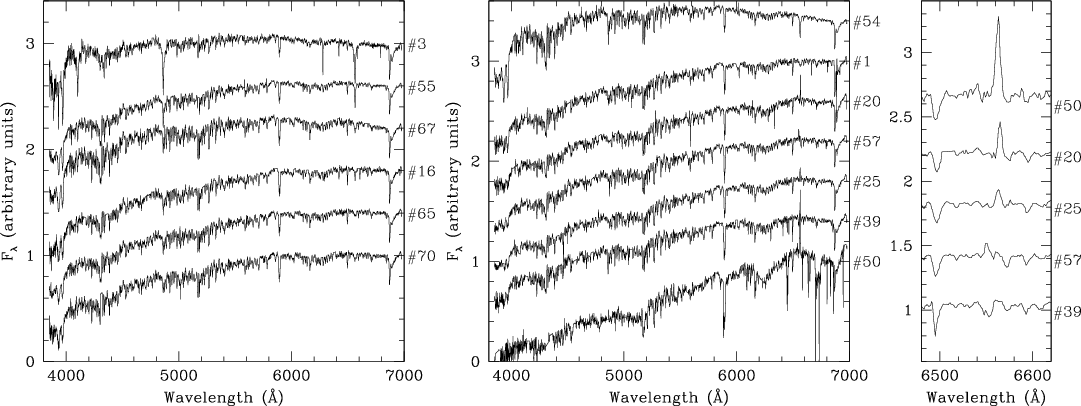
The exceptions are the mid B-type star![]() #56 and the early-type B star #76 (see Fig. 3).
#56 and the early-type B star #76 (see Fig. 3).
3.1 Late-type stars
For most stars of our spectroscopic sample, HAll spectroscopically observed objects with H![]() emission in their spectrum are of spectral type K (see Fig. 2), while all stars
of earlier spectral type display the H
emission in their spectrum are of spectral type K (see Fig. 2), while all stars
of earlier spectral type display the H![]() line in absorption. We also note that the equivalent widths (EWs)
of these emission lines are rather modest. For instance, they are much
weaker than the 10 Å equivalent width conventionally adopted
as the limit between the objects of the wTTS and cTTs categories (e.g.,
Preibisch et al. 2001).
Therefore, these objects are candidate wTTs.
line in absorption. We also note that the equivalent widths (EWs)
of these emission lines are rather modest. For instance, they are much
weaker than the 10 Å equivalent width conventionally adopted
as the limit between the objects of the wTTS and cTTs categories (e.g.,
Preibisch et al. 2001).
Therefore, these objects are candidate wTTs.
Although the spectral resolution of our data is insufficient
to resolve the possible Li I ![]() 6708
line from the neighbouring Fe I
lines, we note that the spectra of the majority of the targets later
than spectral type F (especially stars #1, 16, 25, 39, 55, 57, 65, 67,
and 70) display a rather strong absorption feature at the wavelength of
the Li I line. The unresolved
blend with the Fe I lines
probably accounts for the asymmetric shape of the observed profiles.
The possible detection of Li in the spectra of the late-type stars of
our sample is compatible with a PMS status. We note that all spectra
(except #56 and #76) display a significant absorption feature at about
6104 Å. This feature is unlikely to be associated with the Li
line observed in Population II stars, whose intensity should be very
weak (see e.g., Ford et al. 2002).
This absorption could instead be caused by a blend of Ca I
6708
line from the neighbouring Fe I
lines, we note that the spectra of the majority of the targets later
than spectral type F (especially stars #1, 16, 25, 39, 55, 57, 65, 67,
and 70) display a rather strong absorption feature at the wavelength of
the Li I line. The unresolved
blend with the Fe I lines
probably accounts for the asymmetric shape of the observed profiles.
The possible detection of Li in the spectra of the late-type stars of
our sample is compatible with a PMS status. We note that all spectra
(except #56 and #76) display a significant absorption feature at about
6104 Å. This feature is unlikely to be associated with the Li
line observed in Population II stars, whose intensity should be very
weak (see e.g., Ford et al. 2002).
This absorption could instead be caused by a blend of Ca I
![]() 6103
with Fe I.
6103
with Fe I.
Finally, we emphasize that star #55 (=FJL 23) was previously suggested to be a foreground object (Thé et al. 1985; Rauw et al. 2003), but this conclusion is not confirmed by our present analysis. The photometric and spectroscopic properties of this star are indeed consistent with it being a member of NGC 6383.
3.2 Early-type stars
The OB star #76 appears heavily absorbed and must therefore belong to a population of stars located behind NGC 6383. Our photometric measurements indeed yield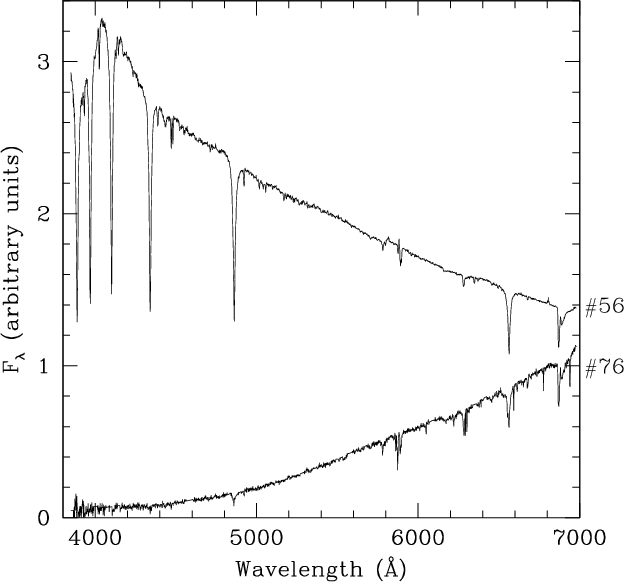
|
Figure 3: Flux-calibrated spectra of the two early-type stars in our spectroscopic sample of NGC 6383. Star #76 probably has an earlier spectral type than #56, but is much more absorbed. The fluxes are presented in the same way as in Fig. 2. |
| Open with DEXTER | |
The case of star #56 (=FJL 24, FitzGerald et al. 1978) is also quite
interesting. Mid to late-type B stars are usually not strong X-ray
emitters. Using the bolometric correction for a B5-7 V star
and the X-ray flux from Paper I, we derive a ![]() value of
value of ![]() for this star. To evaluate the X-ray luminosity, we converted the
EPIC-pn count rate given in Paper I into an unabsorbed flux of
for this star. To evaluate the X-ray luminosity, we converted the
EPIC-pn count rate given in Paper I into an unabsorbed flux of ![]() erg cm-2 s-1
in the 0.5-10 keV band, assuming a thermal plasma at a
temperature of kT = 0.5 keV and an
absorption by an interstellar neutral hydrogen column of
erg cm-2 s-1
in the 0.5-10 keV band, assuming a thermal plasma at a
temperature of kT = 0.5 keV and an
absorption by an interstellar neutral hydrogen column of ![]() cm-2.
We note that our estimate of the X-ray flux would change by less than
20% regardless of the temperature of the emitting plasma in the range
0.3-2 keV. Assuming a distance of 1.3 kpc, the
resulting X-ray luminosity amounts to
cm-2.
We note that our estimate of the X-ray flux would change by less than
20% regardless of the temperature of the emitting plasma in the range
0.3-2 keV. Assuming a distance of 1.3 kpc, the
resulting X-ray luminosity amounts to ![]() erg s-1,
which places this object clearly among the X-ray bright late B-type
stars (see e.g., Berghöfer et al. 1997; Sana
et al. 2006b;
and Nazé 2009). We
note that this value of the X-ray luminosity would also be rather high
if the emission was originating in an unresolved PMS companion.
erg s-1,
which places this object clearly among the X-ray bright late B-type
stars (see e.g., Berghöfer et al. 1997; Sana
et al. 2006b;
and Nazé 2009). We
note that this value of the X-ray luminosity would also be rather high
if the emission was originating in an unresolved PMS companion.
Table 2: Summary of the properties of the targets of our spectroscopic sample.
4 Photometry
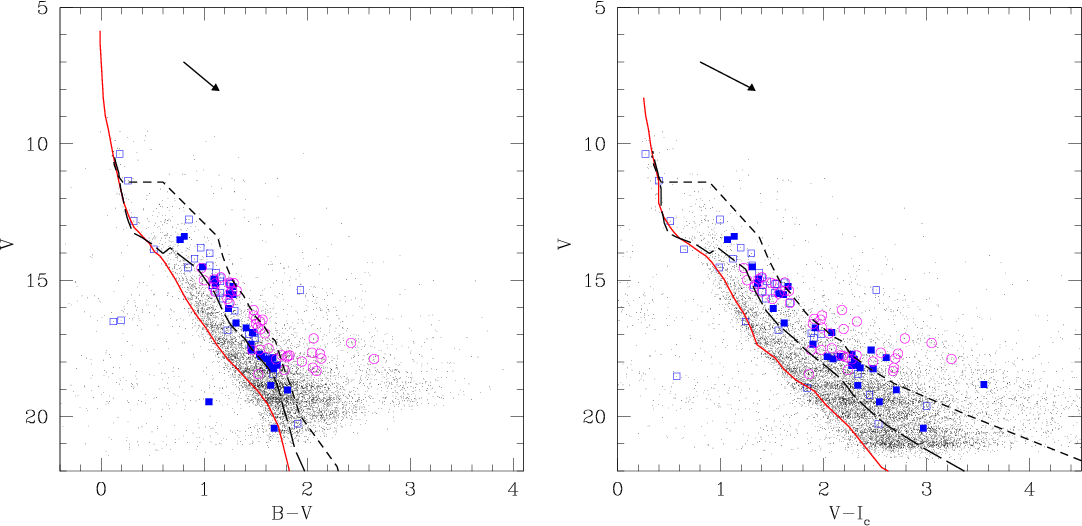
Photometric data for a total of about 80 000 sources were extracted. We have cross-correlated these data with the 2MASS near-IR catalogue (Skrutskie et al. 2006) and found about 18 000 matches within 0.5 arcsec, 7000 of which have good quality near-IR photometry. Among the latter, 2639 objects have reliable WFI photometry in all filters including the HCluster members fainter than ![]() are expected to be pre-main-sequence objects. Unfortunately, these
objects populate a region of the colour-magnitude diagrams that is
potentially highly contaminated by field stars unrelated to
NGC 6383 (see Fig. 4).
Since the cluster is probably located in front of a dust cloud, we
expect the background objects to appear redder than the true cluster
members.
are expected to be pre-main-sequence objects. Unfortunately, these
objects populate a region of the colour-magnitude diagrams that is
potentially highly contaminated by field stars unrelated to
NGC 6383 (see Fig. 4).
Since the cluster is probably located in front of a dust cloud, we
expect the background objects to appear redder than the true cluster
members.
|
Figure 4: Colour-magnitude diagrams of the WFI photometric data with errors of less than 0.15 on V and less than 0.21 in the relevant colour. Single and multiple counterparts of the X-ray sources from Paper I are shown as filled and open squares, respectively, while the PMS candidates from Paunzen et al. (2007) are shown as open circles. The main-sequence relation was shifted to account for a distance modulus of 10.57 and a reddening of E(B - V) = 0.32. The reddening vectors are shown for each diagram and the short and long-dashed lines yield the 1.5 and 10 Myr isochrones, respectively, from Siess et al. (2000). |
| Open with DEXTER | |
4.1 Cross-correlation with the X-ray catalogue
We cross-correlated the catalogue of X-ray sources from Paper I with the list of sources detected in our photometric data. To derive the optimal correlation radius, we applied the technique of Jeffries et al. (1997). In this approach, the distribution of the cumulative number of catalogued sources as a function of the cross-correlation radius![\begin{eqnarray*}\Phi(d \leq r_{\rm X}) & = & A~\left[1 - \exp{\left(\frac{-r_{\...
...ght] \\
& &+ (N - A)~\left[1 - \exp(-\pi~B~r_{\rm X}^2)\right],
\end{eqnarray*}](/articles/aa/full_html/2010/03/aa12780-09/img38.png)
where N, A,
The optimal correlation radius that includes the majority of the true correlations whilst simultaneously limiting contamination by spurious coincidences to about 15%, is found to be about 5 arcsec. The following X-ray sources have no optical counterpart in our photometric data: #4, 5, 18, 19, 21, 26, 28, 40, 71, and #72. Some of the sources (e.g. #14 and #36) which had no counterpart in the USNO catalogue (see Paper I), now have a faint optical counterpart in our data. We note that HD 159176 (X-ray source #44) is too bright to be reliably measured in our photometric data and was thus not included in the correlation process.
The colour-magnitude diagrams shown in Fig. 4 indeed confirm that the bulk of the X-ray sources with an optical counterpart populate a locus where PMS stars are expected. We note that these diagrams also include the 44 PMS candidates identified by Paunzen et al. (2007) on the grounds of photometric criteria.
|
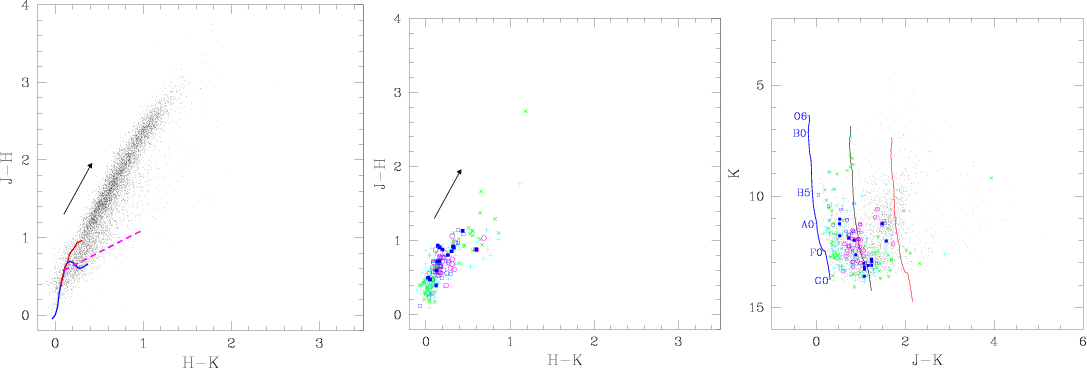
Figure 5:
Left panel: colour-colour diagram of the
2MASS counterparts of the WFI objects. Only those sources with reliable
near-IR photometry are shown. The solid lines yield the locus of the
main-sequence and of the giant branch according to Bessell &
Brett (1988), while
the dashed straight line indicates the locus of the unreddened cTTs
following Meyer et al. (1997).
The reddening vector is shown for |
| Open with DEXTER | |
4.2 Near infrared photometry
Based on the cross-correlation with the 2MASS data, we can compile a
near-IR colour-colour diagram. For this purpose, we applied the colour
transformations of Carpenter (2001,
updated in 2003![]() )
to convert the 2MASS colours into the homogenized JHK
photometric system of Bessell & Brett (1988). The results are
illustrated in Fig. 5.
In the left panel of this figure, we show the JHK
colour-colour diagram. The heavy solid lines yield the intrinsic
colours of main-sequence stars and giants according to Bessell
& Brett (1988),
while the dashed straight line yields the locus of dereddened colours
of classical T Tauri stars according to Meyer et al. (1997).
)
to convert the 2MASS colours into the homogenized JHK
photometric system of Bessell & Brett (1988). The results are
illustrated in Fig. 5.
In the left panel of this figure, we show the JHK
colour-colour diagram. The heavy solid lines yield the intrinsic
colours of main-sequence stars and giants according to Bessell
& Brett (1988),
while the dashed straight line yields the locus of dereddened colours
of classical T Tauri stars according to Meyer et al. (1997).
With ![]() and
and ![]() ,
the NGC 6383 field lies just outside the area investigated by
Nishiyama et al. (2009)
in their study of the extinction law towards the Galactic centre.
Nevertheless, we assume here that their results also apply to our
targets. In doing so, we find that the apparent reddening of the
objects in the field of NGC 6383 spans a very wide range:
about 2.4 in
,
the NGC 6383 field lies just outside the area investigated by
Nishiyama et al. (2009)
in their study of the extinction law towards the Galactic centre.
Nevertheless, we assume here that their results also apply to our
targets. In doing so, we find that the apparent reddening of the
objects in the field of NGC 6383 spans a very wide range:
about 2.4 in ![]() ,
which corresponds roughly to 20 mag in AV.
It is most interesting that there appears to be a continuous
distribution of reddening values. We already pointed out that the
cluster is likely located at the front side of a large molecular cloud.
The results in Fig. 5
imply that we observe a population of sources from different depths
inside this molecular cloud. This situation compromises any attempt to
define a straightforward cluster membership criterion based on the
reddening.
,
which corresponds roughly to 20 mag in AV.
It is most interesting that there appears to be a continuous
distribution of reddening values. We already pointed out that the
cluster is likely located at the front side of a large molecular cloud.
The results in Fig. 5
imply that we observe a population of sources from different depths
inside this molecular cloud. This situation compromises any attempt to
define a straightforward cluster membership criterion based on the
reddening.
In the middle panel of Fig. 5, we have also
plotted the near-IR counterparts of those stars that are either
selected as X-ray sources, PMS candidates from Paunzen
et al. (2007),
or H![]() emitters (see next subsection). This figure shows that the vast
majority of the X-ray sources are subject to a rather moderate
reddening. At the same time, we find no obvious correlation between H
emitters (see next subsection). This figure shows that the vast
majority of the X-ray sources are subject to a rather moderate
reddening. At the same time, we find no obvious correlation between H![]() emission and the existence of a near-IR emission: the majority of the
possible H
emission and the existence of a near-IR emission: the majority of the
possible H![]() emitters (see Sect. 4.3)
have rather normal near-IR colours.
emitters (see Sect. 4.3)
have rather normal near-IR colours.
Finally, the rightmost panel of Fig. 5 displays the
colour-magnitude diagram, where the main-sequence relation has been
shifted for a distance modulus of 10.57. Again, the existence of a
wide, continuous range of interstellar reddening is quite obvious. We
note that the reddening of the bright cluster members (
E(B
- V) = 0.32) corresponds roughly to ![]() .
.
4.3 H emission candidates identified from photometry
According to our current understanding of classical T Tauri
stars, these objects are surrounded by a circumstellar disk that is
truncated at its inner edge by the stellar magnetosphere. Most of the
time, cTTs accrete at a rate well below 10-6 ![]() yr-1
and their H
yr-1
and their H![]() emission originates in accretion streams that are controlled by the
magnetic field (see e.g., Schulz 2005).
emission originates in accretion streams that are controlled by the
magnetic field (see e.g., Schulz 2005).
We used the ![]() index, calibrated against the Sung et al. (1997)
index, calibrated against the Sung et al. (1997) ![]() versus
versus ![]() main-sequence relation (see Sect. 2), to identify
potential H
main-sequence relation (see Sect. 2), to identify
potential H![]() emitters. The relevance of the Sung et al. (1997) relation for our
dataset was checked using synthetic photometry, obtained by numerical
integration of the spectrophotometric data of main-sequence stars from
Jacoby et al. (1984)
through the WFI V and
emitters. The relevance of the Sung et al. (1997) relation for our
dataset was checked using synthetic photometry, obtained by numerical
integration of the spectrophotometric data of main-sequence stars from
Jacoby et al. (1984)
through the WFI V and ![]() filter passbands. The operation was performed for stars of spectral
types from B4 V to M5 V. Our synthetic photometry is
in excellent agreement with the Sung et al. main-sequence
relation. We then repeated the integration by adding an H
filter passbands. The operation was performed for stars of spectral
types from B4 V to M5 V. Our synthetic photometry is
in excellent agreement with the Sung et al. main-sequence
relation. We then repeated the integration by adding an H![]() emission line of increasing equivalent width to the Jacoby
et al. (1984)
spectra. In this way, we found that an H
emission line of increasing equivalent width to the Jacoby
et al. (1984)
spectra. In this way, we found that an H![]() equivalent width of 10 Å, which is usually adopted as the
threshold for cTTs, corresponds to an
equivalent width of 10 Å, which is usually adopted as the
threshold for cTTs, corresponds to an ![]() index
index ![]() above the main-sequence relation.
above the main-sequence relation.
We therefore consider a star as an H![]() emission candidate if its
emission candidate if its ![]() colour index is between 0.12 and 0.24 above the main-sequence relation
(corresponding roughly to an EW between 6 and
10 Å) and as an H
colour index is between 0.12 and 0.24 above the main-sequence relation
(corresponding roughly to an EW between 6 and
10 Å) and as an H![]() emitter if the corresponding colour index is more than 0.24 above the
main-sequence relation. In this way, we arrive at a list of 924 H
emitter if the corresponding colour index is more than 0.24 above the
main-sequence relation. In this way, we arrive at a list of 924 H![]() candidates and 592 emitters. If we restrict ourselves to stars with
photometric errors of less than 0.15 mag in V
and less than 0.21 in
candidates and 592 emitters. If we restrict ourselves to stars with
photometric errors of less than 0.15 mag in V
and less than 0.21 in ![]() ,
these numbers become 475 and 189 for the H
,
these numbers become 475 and 189 for the H![]() candidates and emitters, respectively. The 0.06 mag
uncertainty in the zeropoint of the
candidates and emitters, respectively. The 0.06 mag
uncertainty in the zeropoint of the ![]() index translates into an uncertainty of a factor 1.8 in the numbers of
emitters and candidates.
index translates into an uncertainty of a factor 1.8 in the numbers of
emitters and candidates.
Since the objects in our data appear to have a range of
extinction values, we checked that our selection criterion for H![]() emission is not biased by false detections which could be caused by a
heavy reddening that produces an artificially high
emission is not biased by false detections which could be caused by a
heavy reddening that produces an artificially high ![]() index. To do so, we evaluated the
index. To do so, we evaluated the ![]() colour index, which has a different sensitivity to reddening than our
colour index, which has a different sensitivity to reddening than our ![]() criterion. The vast majority of objects selected with the Sung
et al. (1997)
criterion are also identified as candidates or emitters according to
the
criterion. The vast majority of objects selected with the Sung
et al. (1997)
criterion are also identified as candidates or emitters according to
the ![]() colour.
colour.
|
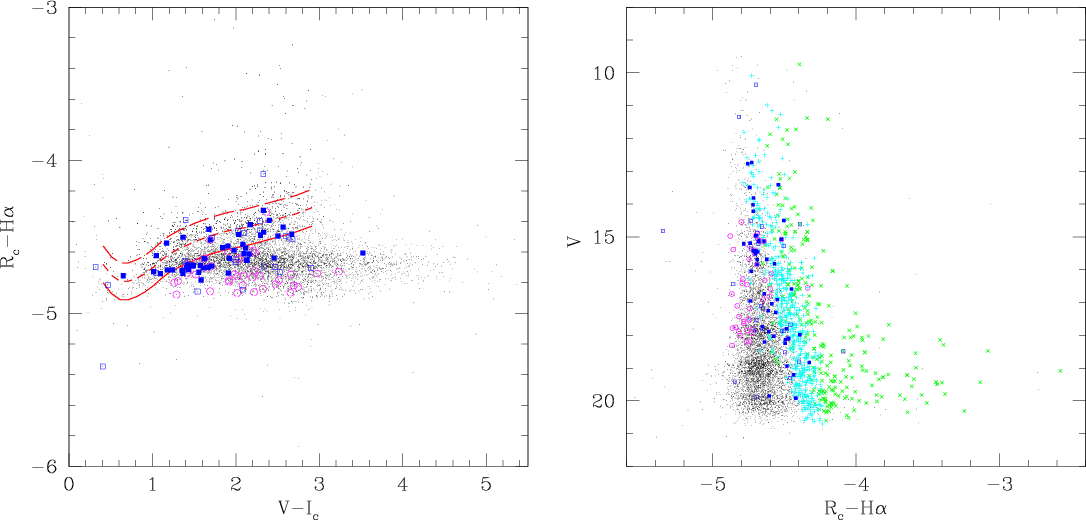
Figure 6:
Left: the |
| Open with DEXTER | |
From Fig. 6,
we see that neither the Paunzen et al. (2007) PMS
candidates nor the X-ray sources display strong H![]() emission: there are only half a dozen X-ray sources in the H
emission: there are only half a dozen X-ray sources in the H![]() emitter region. We note that those objects for which our spectroscopy
revealed (rather weak) H
emitter region. We note that those objects for which our spectroscopy
revealed (rather weak) H![]() emission are not identified as emitters in our photometric data. This
suggests that wTTs will be difficult to identify with narrow-band
photometry (see also Dahm & Simon 2005, for a comparison
of the efficiency of narrow-band photometry and slitless grism
spectroscopy to identify weak H
emission are not identified as emitters in our photometric data. This
suggests that wTTs will be difficult to identify with narrow-band
photometry (see also Dahm & Simon 2005, for a comparison
of the efficiency of narrow-band photometry and slitless grism
spectroscopy to identify weak H![]() emitters).
emitters).
Whilst many emission candidates and emitters are rather faint
objects, we see that H![]() emission is apparently not restricted to only the faintest (and hence
least massive) stars. A few objects as bright as
emission is apparently not restricted to only the faintest (and hence
least massive) stars. A few objects as bright as ![]() -11 are
identified as H
-11 are
identified as H![]() emitters. The brightest is the Be star HDE 317861
(B3-5 Vne, Lloyd Evans 1978)
with V = 9.76 and
emitters. The brightest is the Be star HDE 317861
(B3-5 Vne, Lloyd Evans 1978)
with V = 9.76 and ![]() .
Whilst the Herbig Ae star FJL 4 (=V 486 Sco,
A5 IIIp, Thé et al. 1985)
is classified as a candidate H
.
Whilst the Herbig Ae star FJL 4 (=V 486 Sco,
A5 IIIp, Thé et al. 1985)
is classified as a candidate H![]() emitter with our criteria, indications of emission are found in neither
our photometric nor spectroscopic data of FJL 24 (=X-ray
source #56, B5-7). We note that the latter object was classified as
B8 Vne by FitzGerald et al. (1978), since one
observation out of six analysed by these authors displayed H
emitter with our criteria, indications of emission are found in neither
our photometric nor spectroscopic data of FJL 24 (=X-ray
source #56, B5-7). We note that the latter object was classified as
B8 Vne by FitzGerald et al. (1978), since one
observation out of six analysed by these authors displayed H![]() emission. Our spectrum of this star exhibits strong Balmer absorption
lines (see Fig. 3).
emission. Our spectrum of this star exhibits strong Balmer absorption
lines (see Fig. 3).
The presence of H![]() emission does not automatically imply that a star is a member of the
cluster. For instance, our sample of H
emission does not automatically imply that a star is a member of the
cluster. For instance, our sample of H![]() emitters and candidates may contain foreground, magnetically active,
dMe stars, unrelated to the cluster. The incidence of dMe stars (with
an H
emitters and candidates may contain foreground, magnetically active,
dMe stars, unrelated to the cluster. The incidence of dMe stars (with
an H
![]() 1 Å) increases towards lower masses and hence later spectral
types (see Hawley et al. 1996,
and references therein): the observed frequency is about 10% at
spectral types earlier than M2, but increases towards about 60% around
spectral type M5. Furthermore, the dMe stars of the earlier spectral
types appear on average 0.5 mag brighter in MV
and MK
than their dM counterparts (Hawley et al. 1996). An estimate
of the number of foreground dMe stars can be obtained by following the
same approach as Dahm & Simon (2005),
based on the stellar luminosity function of Jahreiß & Wielen (1997) and the dMe
incidence of Hawley et al. (1996).
In this way, we arrive at an estimated number of 151 foreground dMe
stars. We note that this number is an upper limit, since the reddening
due to interstellar material along the line of sight towards
NGC 6383 was not taken into account in this evaluation.
1 Å) increases towards lower masses and hence later spectral
types (see Hawley et al. 1996,
and references therein): the observed frequency is about 10% at
spectral types earlier than M2, but increases towards about 60% around
spectral type M5. Furthermore, the dMe stars of the earlier spectral
types appear on average 0.5 mag brighter in MV
and MK
than their dM counterparts (Hawley et al. 1996). An estimate
of the number of foreground dMe stars can be obtained by following the
same approach as Dahm & Simon (2005),
based on the stellar luminosity function of Jahreiß & Wielen (1997) and the dMe
incidence of Hawley et al. (1996).
In this way, we arrive at an estimated number of 151 foreground dMe
stars. We note that this number is an upper limit, since the reddening
due to interstellar material along the line of sight towards
NGC 6383 was not taken into account in this evaluation.
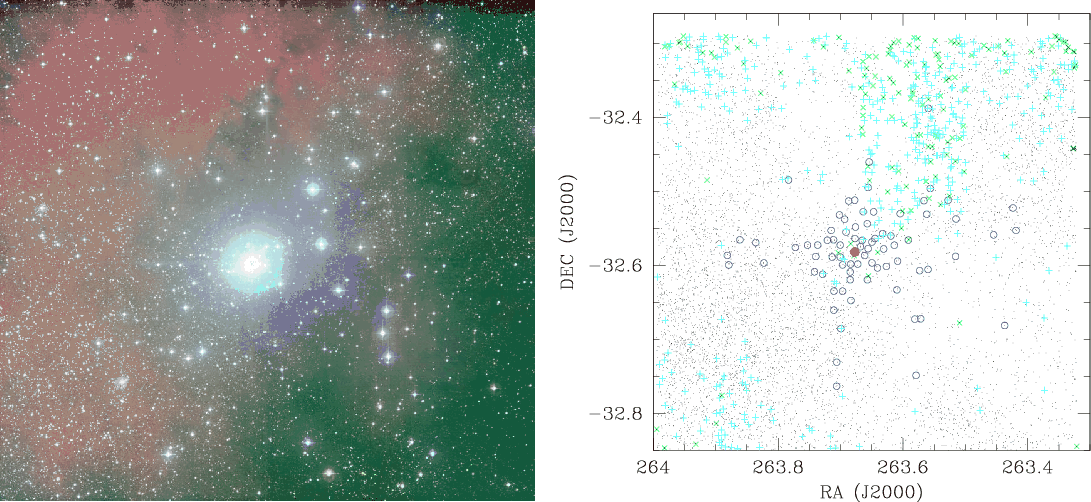
A strong contamination by foreground dMe objects is a priori
expected to produce a rather uniform spatial distribution of H![]() selected stars across the field of view. However, the spatial
distribution of the H
selected stars across the field of view. However, the spatial
distribution of the H![]() emitters and candidates is far from uniform (see Fig. 7). Indeed, the
density of emitters is higher towards the north of the field of view
and especially in the north-western part, while there is a paucity of H
emitters and candidates is far from uniform (see Fig. 7). Indeed, the
density of emitters is higher towards the north of the field of view
and especially in the north-western part, while there is a paucity of H![]() emitters in the south-west and to the east of HD 159176. This
can be quantified for instance by comparing the north-west and
south-east quadrants: the former contains a total of 1951 objects with
good photometric data, 18% of which are either emitters or candidates,
whereas the latter contains 3056 good quality objects only 3% of which
are selected as H
emitters in the south-west and to the east of HD 159176. This
can be quantified for instance by comparing the north-west and
south-east quadrants: the former contains a total of 1951 objects with
good photometric data, 18% of which are either emitters or candidates,
whereas the latter contains 3056 good quality objects only 3% of which
are selected as H![]() emitters or candidates. The lack of H
emitters or candidates. The lack of H![]() emitters and candidates in the south-east is particularly surprising
because this region has the highest density of stars. Therefore, the
paucity of emitters cannot be attributed to the effect of interstellar
absorption. Although projection effects could play a role, we note that
unlike our findings for X-ray emitters (see Paper I), there is no clear
concentration of H
emitters and candidates in the south-east is particularly surprising
because this region has the highest density of stars. Therefore, the
paucity of emitters cannot be attributed to the effect of interstellar
absorption. Although projection effects could play a role, we note that
unlike our findings for X-ray emitters (see Paper I), there is no clear
concentration of H![]() selected stars in the cluster core
selected stars in the cluster core![]() .
Outside the core, the mean spatial density of H
.
Outside the core, the mean spatial density of H![]() emitters and candidates are 0.08 and 0.26 arcmin-2,
respectively. Taken together, these numbers are higher than expected
from the predicted maximum number of foreground dMe stars
(0.13 arcmin-2), indicating that the
distribution of H
emitters and candidates are 0.08 and 0.26 arcmin-2,
respectively. Taken together, these numbers are higher than expected
from the predicted maximum number of foreground dMe stars
(0.13 arcmin-2), indicating that the
distribution of H![]() emitters and candidates must be related to the properties of the
cluster or its background.
emitters and candidates must be related to the properties of the
cluster or its background.
|
Figure 7:
Left: three-colour image of the
NGC 6383 cluster compiled from our WFI photometry.
Right: spatial distribution of the H |
| Open with DEXTER | |
What is the reason for the lack of accreting PMS stars in the
south-western and eastern parts of the halo of NGC 6383, as
inferred from the position of H![]() emitters and candidates? One possibility is photoevaporation of the
protoplanetary disks by either the extreme-UV (EUV) and far-UV (FUV)
irradiation from the O-type binary HD 159176 or the EUV, FUV
and X-rays of the central PMS star itself. The former effect was
predicted theoretically, and evaporating disks with cometary tails were
observed with Spitzer in three cases at distances
between 0.1 and 0.35 pc from an O-star (Balog et al. 2006, 2008, and references
therein). However, in NGC 6383, several H
emitters and candidates? One possibility is photoevaporation of the
protoplanetary disks by either the extreme-UV (EUV) and far-UV (FUV)
irradiation from the O-type binary HD 159176 or the EUV, FUV
and X-rays of the central PMS star itself. The former effect was
predicted theoretically, and evaporating disks with cometary tails were
observed with Spitzer in three cases at distances
between 0.1 and 0.35 pc from an O-star (Balog et al. 2006, 2008, and references
therein). However, in NGC 6383, several H![]() emitters are relatively close to the O-star binary. We found 8 H
emitters are relatively close to the O-star binary. We found 8 H![]() emitters and 19 candidates within 5 armin of
HD 159176, which corresponds to a linear radius of
1.9 pc at the distance of 1.3 kpc. Therefore, we
would have to assume that the photoevaporation occurs preferentially
along certain directions and affects the cluster halo more efficiently
than the core, which is rather unlikely. Concerning the second effect,
Gorti & Hollenbach (2009)
predict photoevaporation of the accretion disk by irradiation of the
PMS star within a rather short timescale of about 1 Myr. If
the emission measure of the X-ray emitting plasma correlates with the
EUV emission measure of the PMS star, this second scenario could, at
least qualitatively, explain why the most prominent X-ray emission is
observed from wTTs. This photoevaporation caused by irradiation by the
central star itself should however affect PMS stars irrespective of
their position in the cluster. This scenario alone is therefore
insufficient to explain the complex distribution of H
emitters and 19 candidates within 5 armin of
HD 159176, which corresponds to a linear radius of
1.9 pc at the distance of 1.3 kpc. Therefore, we
would have to assume that the photoevaporation occurs preferentially
along certain directions and affects the cluster halo more efficiently
than the core, which is rather unlikely. Concerning the second effect,
Gorti & Hollenbach (2009)
predict photoevaporation of the accretion disk by irradiation of the
PMS star within a rather short timescale of about 1 Myr. If
the emission measure of the X-ray emitting plasma correlates with the
EUV emission measure of the PMS star, this second scenario could, at
least qualitatively, explain why the most prominent X-ray emission is
observed from wTTs. This photoevaporation caused by irradiation by the
central star itself should however affect PMS stars irrespective of
their position in the cluster. This scenario alone is therefore
insufficient to explain the complex distribution of H![]() emitters.
emitters.
An alternative could be that our sample is heavily contaminated by background objects. For instance, we could be observing the edge of another star-forming region to the north of HD 159176. We tested this possibility by considering the spatial distribution of objects with high J - K indices ( J - K > 2.5) that hence are potentially highly reddened background stars. This distribution reveals a lack of objects in the south-west, but is otherwise rather uniform. Therefore, while it is likely that our sample is highly contaminated by a population of background stars, we see no peculiar pattern in the spatial distribution of highly reddened stars.
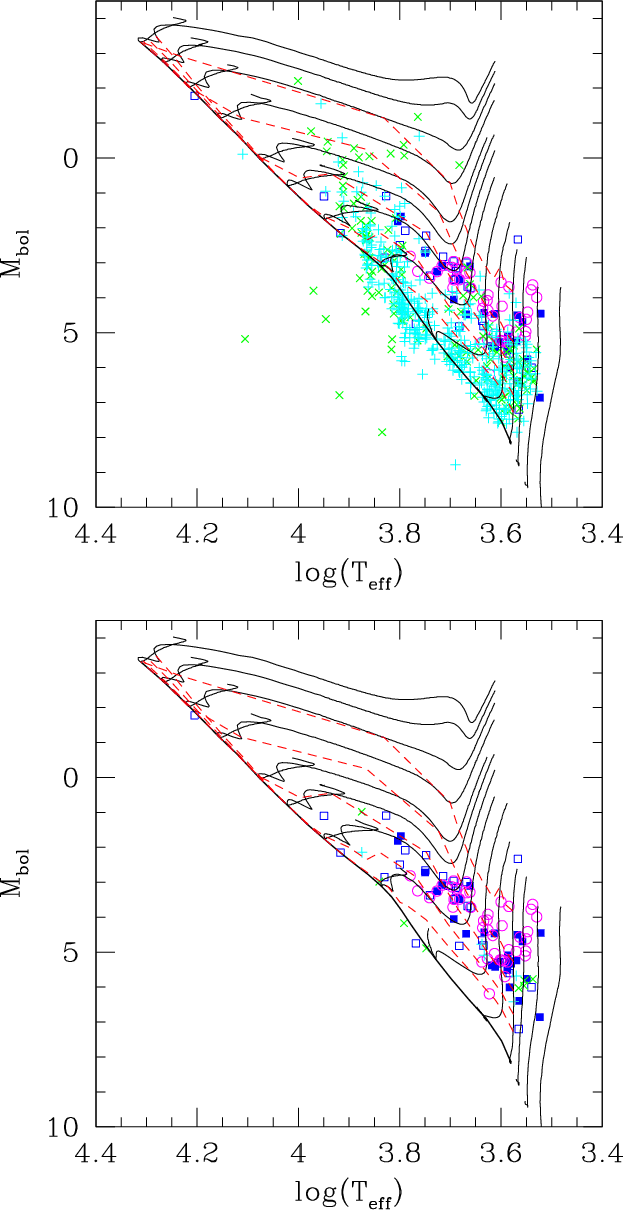
5 The Hertzsprung-Russell diagram
From the various colour-magnitude diagrams presented in the previous section, we find that the X-ray sources and the Paunzen et al. (2007) PMS candidates (hereafter the PNZ objects) are the best candidate cluster members, whereas the HAssuming a distance modulus of 10.57 and a reddening E(B
- V) = 0.32 for the cluster members (see Rauw
& De Becker 2008,
and Sect. 1),
we built the Hertzsprung-Russell diagram of the X-ray sources, the PNZ
objects, and the H![]() selected stars. To do so, we evaluated the effective temperatures and
bolometric corrections by means of a linear interpolation of the Kenyon
& Hartmann (1995)
tables as a function of
selected stars. To do so, we evaluated the effective temperatures and
bolometric corrections by means of a linear interpolation of the Kenyon
& Hartmann (1995)
tables as a function of ![]() .
The results are shown in Fig. 8.
Whilst some of the H
.
The results are shown in Fig. 8.
Whilst some of the H![]() selected objects form a continuation of the locus of the X-ray and PNZ
objects, the majority of the H
selected objects form a continuation of the locus of the X-ray and PNZ
objects, the majority of the H![]() emitters are located below this locus. This result must be caused by
the contamination of our H
emitters are located below this locus. This result must be caused by
the contamination of our H![]() sample by foreground dMe stars or background objects located inside or
behind the molecular cloud. Since our attempts to establish an
efficient and self-consistent membership criterion failed, we instead
applied a rough selection based upon the J - K
colour and the position with respect to the cluster core. By selecting
only stars with J
- K < 1.5, which is roughly equivalent to AK
< 0.54, and within the 5 arcmin radius of the cluster
core, we obtain a cleaner Hertzsprung-Russell diagram where the H
sample by foreground dMe stars or background objects located inside or
behind the molecular cloud. Since our attempts to establish an
efficient and self-consistent membership criterion failed, we instead
applied a rough selection based upon the J - K
colour and the position with respect to the cluster core. By selecting
only stars with J
- K < 1.5, which is roughly equivalent to AK
< 0.54, and within the 5 arcmin radius of the cluster
core, we obtain a cleaner Hertzsprung-Russell diagram where the H![]() emitters are now mainly in a lower mass continuation of the locus of
PNZ and X-ray selected PMS stars.
emitters are now mainly in a lower mass continuation of the locus of
PNZ and X-ray selected PMS stars.
|
Figure 8:
Top: Hertzsprung-Russell diagram of the X-ray
sources, PNZ objects, H |
| Open with DEXTER | |
There are a number of available theoretical PMS tracks that we can
compare with our data. The various evolutionary codes differ in many
respects and the most important differences concern the opacities, the
equation of state, the treatment of the stellar atmosphere, and most
importantly the treatment of convection (see the discussions in Siess
et al. 2000).
Here, we chose to compare our data with the results of four different
models: the 1997 version of the tracks of D'Antona & Mazzitelli
(1997, hereafter
DM97), the Siess et al. (2000,
hereafter SDF00) calculations, and both the standard and rotating,
models of Landin et al. (2009,
hereafter LMV09). Whilst the DM97 computations use the full spectrum of
turbulence (FTS) approach to treat convection, the other calculations
considered here rely instead on the mixing length theory (MLT). These
different treatments obviously lead to quantitative differences in the
PMS tracks, and one expects conflicting results when empirically
determining the ages of observed PMS stars. For instance, D'Antona
& Mazitelli (1997)
argue that the FTS approach generally yields a lower age spread than
the MLT. With these limitations in mind, we compiled the histograms of
the ages of the PMS candidates by comparing with the isochrones of the
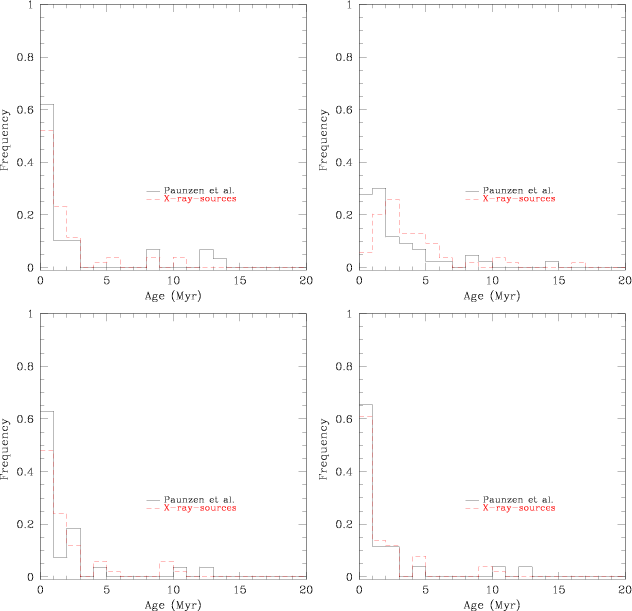
various models (see the results in Fig. 9 and Table 4). We emphasize
that the age distribution of the H![]() selected stars would actually be meaningless because, as stated above,
this selection criterion probably fails to properly identify cluster
members.
selected stars would actually be meaningless because, as stated above,
this selection criterion probably fails to properly identify cluster
members.
|
Figure 9: Distribution of ages as inferred from the comparison with PMS isochrones. The evolutionary models are from D'Antona & Mazzitelli (1997, top left), Siess et al. (2000, top right), and Landin et al. (2009) without rotation ( lower left) and with rotation ( lower right). |
| Open with DEXTER | |
Table 3: Mean ages and standard age deviations (in Myr) for the various samples of PMS candidates in NGC 6383.
Figure 9 shows that the DM97 isochrones indeed yield a strongly peaked age distribution (especially for the PNZ objects). We note that this information is not obvious from the standard deviations listed in Table 4, since the few outliers at ages of 10 Myr and older have a strong impact on these parameters. Although the quantitative picture depends upon the evolutionary models in use, we note that the X-ray sources and the PNZ objects have essentially identical age distributions which are strongly peaked below 5 Myr and the likely PMS stars have a mean age between 2 and 3 Myr. From the observational point of view, the combined uncertainty in cluster distance and reddening (as inferred for the brighter cluster members) amounts to 0.18 mag, which introduces an uncertainty of about 0.4 Myr in the cluster age. The latter number is well within the dispersion of the ages implied from the comparison with the different evolutionary models.
Our results are in reasonable agreement with the upper age
limit of 4 Myr inferred by Paunzen et al. (2007). We note that
FitzGerald et al. (1978)
derived a younger cluster age of ![]() Myr.
The difference may originate from the use of different PMS isochrones
or the work of FitzGerald et al. (1978) being restricted
to the brighter cluster members only.
Myr.
The difference may originate from the use of different PMS isochrones
or the work of FitzGerald et al. (1978) being restricted
to the brighter cluster members only.
Finally, we estimated the age of the central early-type binary
HD 159176 from the effective temperature and bolometric
luminosity determined by the spectral analysis of Linder
et al. (2007).
The bolometric luminosities were computed by assuming that AV
= 0.96 and DM
= 10.57, while the effective temperatures were adapted from Martins
et al. (2005)
following the spectral types derived by Linder et al. (2007). Since
HD 159176 is probably a detached binary system, binary
evolution effects are unlikely to have played a major role in the
evolution of the system to date. Therefore, we compared the position of
the stars in the Hertzsprung-Russell diagram with the single-star
evolutionary tracks of Meynet & Maeder (2003). Depending on
whether we use the evolutionary tracks with an initial equatorial
rotational velocity of 0 or 300 km s-1,
we estimate the age of the system to be in the range
2.3-2.7 Myr, in good agreement with the ![]() Myr
estimated by FitzGerald et al. (1978). As a result, we
find that the age of the massive binary and the mean age of the PMS
stars are reasonably consistent with a single star-formation event
about 2-3 Myr ago.
Myr
estimated by FitzGerald et al. (1978). As a result, we
find that the age of the massive binary and the mean age of the PMS
stars are reasonably consistent with a single star-formation event
about 2-3 Myr ago.
We emphasize that many objects meet more than one PMS
criterion simultaneously. This is the case for the X-ray sources #16,
20, 25, 39, 42, 47, 51, 57, and 63 that appear in the list of PMS
candidates of Paunzen et al. (2007). Five of
these objects were observed spectroscopically and were found to exhibit
a significant absorption probably caused by Li I
![]() 6708.
For three of them, we also found weak H
6708.
For three of them, we also found weak H![]() emission (#20, 25 and 57) in the spectra. Finally, we note that our
X-ray source #51 is identical with WEBDA object 382, which is
understood to be a rapidly rotating PMS star (Paunzen et al. 2007; Zwintz
et al. 2005,
their object 71).
emission (#20, 25 and 57) in the spectra. Finally, we note that our
X-ray source #51 is identical with WEBDA object 382, which is
understood to be a rapidly rotating PMS star (Paunzen et al. 2007; Zwintz
et al. 2005,
their object 71).
6 Conclusions
Our photometric and spectroscopic investigation of NGC 6383 has detected a significant population of reddened objects with extinctions spanning a continuous range up toWe have found that the best PMS candidates display little or
no H![]() emission in their spectrum. The mean age of the most likely low-mass
PMS candidates in NGC 6383 is found by comparing with various
PMS evolutionary tracks, to be 2-3 Myr, in reasonable
agreement with the estimated age of HD 159176 at the centre of
the cluster. It therefore appears that the low-mass stars and the
O-type binary were born in the same star-formation event.
emission in their spectrum. The mean age of the most likely low-mass
PMS candidates in NGC 6383 is found by comparing with various
PMS evolutionary tracks, to be 2-3 Myr, in reasonable
agreement with the estimated age of HD 159176 at the centre of
the cluster. It therefore appears that the low-mass stars and the
O-type binary were born in the same star-formation event.
We acknowledge support from the Fonds de Recherche Scientifique (FRS/FNRS), through the XMM/INTEGRAL PRODEX contract as well as by the Communauté Française de Belgique - Action de recherche concertée - Académie Wallonie - Europe. This research made use of data products from the Two Micron All Sky Survey, which is a joint project of the University of Massachusetts and the Infrared Processing and Analysis Center/California Institute of Technology, funded by NASA and NSF.
Appendix A: Notes on individual stars
Star #1: the strength of the G-band and the ratio Fe IStar #3: the strength of the H8 line compared to the
Ca II H and K lines, the strength
of the (weak) G-band, and the relative importance of metallic line
spectrum indicate an F5 spectral-type. The weakness of the Sr
II ![]() 4077 line indicates
a main-sequence or subgiant luminosity class. We thus classify this
star as F5 V with an uncertainty of two spectral subtypes.
4077 line indicates
a main-sequence or subgiant luminosity class. We thus classify this
star as F5 V with an uncertainty of two spectral subtypes.
Star #16: the strength of the G-band and the Ca I
![]() 4227
line as well as the ratio Fe I
4227
line as well as the ratio Fe I ![]() 4325/H
4325/H![]() suggest an early G (G0-5) spectral type. The strength of Sr II
suggest an early G (G0-5) spectral type. The strength of Sr II
![]() 4077
suggests either a subgiant or giant luminosity class. The strength of
Y II
4077
suggests either a subgiant or giant luminosity class. The strength of
Y II ![]() 4376 relative to
Fe I
4376 relative to
Fe I ![]() 4383 is instead
indicative of a main-sequence luminosity class. We thus adopt a
G0-5 V-IV spectral type.
4383 is instead
indicative of a main-sequence luminosity class. We thus adopt a
G0-5 V-IV spectral type.
Star #20: the strength of the G-band and the ratio
Fe I ![]() 4325/H
4325/H![]() yield a spectral type of about K0. The strength of Sr II
yield a spectral type of about K0. The strength of Sr II
![]() 4077
compared to the nearby Fe I lines
suggests a main-sequence or slightly brighter luminosity class. We thus
classify this star as K0 V with two subclasses of uncertainty.
The star exhibits a rather strong H
4077
compared to the nearby Fe I lines
suggests a main-sequence or slightly brighter luminosity class. We thus
classify this star as K0 V with two subclasses of uncertainty.
The star exhibits a rather strong H![]() emission above the continuum with an equivalent width of about
-1.0 Å.
emission above the continuum with an equivalent width of about
-1.0 Å.
Star #25: the same criteria as for star #20 yield an early to
mid K spectral type. The strength of Sr II
![]() 4077
compared to the nearby Fe I lines
suggests a main-sequence luminosity class. This is also in agreement
with the strength of Y II
4077
compared to the nearby Fe I lines
suggests a main-sequence luminosity class. This is also in agreement
with the strength of Y II ![]() 4376
relative to Fe I
4376
relative to Fe I ![]() 4383.
We thus adopt a K2 V spectral type with an uncertainty of
about two spectral subtypes. The H
4383.
We thus adopt a K2 V spectral type with an uncertainty of
about two spectral subtypes. The H![]() line is seen in emission above the continuum with an EW
of -0.5 Å.
line is seen in emission above the continuum with an EW
of -0.5 Å.
Star #39: the strength of the G-band indicates that this star
must be earlier than K5, whilst the weakness of the Balmer lines and
the ratio of Fe I ![]() 4325/H
4325/H![]() suggest a spectral type later than K0. Considering also the general
appearance of the spectrum, we favour a spectral type K2-4. The same
criteria as for star #25 indicate a main-sequence luminosity class. We
thus adopt a K2-4 V spectral type. While no H
suggest a spectral type later than K0. Considering also the general
appearance of the spectrum, we favour a spectral type K2-4. The same
criteria as for star #25 indicate a main-sequence luminosity class. We
thus adopt a K2-4 V spectral type. While no H![]() emission is seen above the continuum, there is also no absorption at
the wavelength of H
emission is seen above the continuum, there is also no absorption at
the wavelength of H![]() .
There is an absorption towards the blue, suggesting a kind of P-Cygni
profile.
.
There is an absorption towards the blue, suggesting a kind of P-Cygni
profile.
Star #50: the strength of the Ca I
![]() 4227
line and the MgH feature at 4780 Å suggest a late-K
main-sequence type, whilst the lack of visible TiO bands indicates that
the star must be earlier than M0. We adopt a K7 V spectral
type with an uncertainty of at least two subtypes. A strong (EW
= -3.0 Å) H
4227
line and the MgH feature at 4780 Å suggest a late-K
main-sequence type, whilst the lack of visible TiO bands indicates that
the star must be earlier than M0. We adopt a K7 V spectral
type with an uncertainty of at least two subtypes. A strong (EW
= -3.0 Å) H![]() emission is detected.
emission is detected.
Star #54: the strength of the G-band and the Ca I
![]() 4277
line as well as the ratio Fe I
4277
line as well as the ratio Fe I ![]() 4325/H
4325/H![]() suggest a late G spectral type. The strength of Sr II
suggest a late G spectral type. The strength of Sr II
![]() 4077
as well as the strength of Y II
4077
as well as the strength of Y II ![]() 4376
compared to Fe I
4376
compared to Fe I ![]() 4383
yield a main-sequence or giant luminosity class. We thus adopt a
G7 V spectral type with an uncertainty of two subtypes in
spectral type.
4383
yield a main-sequence or giant luminosity class. We thus adopt a
G7 V spectral type with an uncertainty of two subtypes in
spectral type.
Star #55: the same criteria as for star #54 yield an early-G
type, G0-5, but closer to G0. The strength of the Ti II,
Fe II ![]() 4172-78 blend, as well as of the Sr II
4172-78 blend, as well as of the Sr II
![]() 4077
line suggest a subgiant luminosity class. We classify this star
accordingly as G0-1 IV.
4077
line suggest a subgiant luminosity class. We classify this star
accordingly as G0-1 IV.
Star #56: as inferred by the presence of He I
lines, this object is a B-star. The intensity ratio He I
![]() 4471
versus Mg II
4471
versus Mg II ![]() 4481
as well as the strength of the Ca II
K line indicate a spectral type B5-7. The rather broad Balmer lines
suggest a main-sequence luminosity class. We thus classify this star as
B5-7 V. The spectrum also exhibits the diffuse interstellar
band (DIB) at 4430 Å.
4481
as well as the strength of the Ca II
K line indicate a spectral type B5-7. The rather broad Balmer lines
suggest a main-sequence luminosity class. We thus classify this star as
B5-7 V. The spectrum also exhibits the diffuse interstellar
band (DIB) at 4430 Å.
Star #57: the same criteria as for star #39 suggest a spectral
type K0-5. The strength of Sr II ![]() 4077
compared to the nearby Fe I lines
suggests a giant luminosity class, whilst the strength of Y II
4077
compared to the nearby Fe I lines
suggests a giant luminosity class, whilst the strength of Y II
![]() 4376
compared to Fe I
4376
compared to Fe I ![]() 4383
could be consistent with either a main-sequence or giant
classification. Considering also the general appearance of the
spectrum, we adopt a K0-5 III classification. Our spectrum
displays a blue-shifted H
4383
could be consistent with either a main-sequence or giant
classification. Considering also the general appearance of the
spectrum, we adopt a K0-5 III classification. Our spectrum
displays a blue-shifted H![]() emission above the continuum with an equivalent width of about
-0.3 Å.
emission above the continuum with an equivalent width of about
-0.3 Å.
Star #65: the same criteria as for star #16 indicate a G5
spectral type. The strength of the Sr II
![]() 4077
line suggests that the star is a subgiant or giant. We thus classify
this star as G5 IV-III.
4077
line suggests that the star is a subgiant or giant. We thus classify
this star as G5 IV-III.
Star #67: the same criteria as for stars #16 and #25 yield a G5-K0 V spectral type.
Star #70: the same criteria as for star #16 indicate a late G
spectral type. The strength of Sr II
![]() 4077
compared to the nearby Fe I lines
and the strength of Y II
4077
compared to the nearby Fe I lines
and the strength of Y II ![]() 4376
relative to Fe I
4376
relative to Fe I ![]() 4383
suggest a subgiant or giant luminosity class. We thus classify the star
as G5-K0 IV-III.
4383
suggest a subgiant or giant luminosity class. We thus classify the star
as G5-K0 IV-III.
Star #76: the spectrum of this source is very red with almost
no flux below ![]() 4300 Å.
However, this must be a rather hot object, since in addition to some
Balmer absorption lines, we also see several He I
absorption lines (
4300 Å.
However, this must be a rather hot object, since in addition to some
Balmer absorption lines, we also see several He I
absorption lines (
![]() 4471, 4922, 5876, 6678). The Mg II
4471, 4922, 5876, 6678). The Mg II
![]() 4481
line is weaker than He I
4481
line is weaker than He I ![]() 4471.
The spectrum also exhibits a number of strong diffuse interstellar
bands. This star must therefore be a heavily extinguished object of
spectral type O9-B5.
4471.
The spectrum also exhibits a number of strong diffuse interstellar
bands. This star must therefore be a heavily extinguished object of
spectral type O9-B5.
References
- Balog, Z., Rieke, G. H., Su, K. Y. L., Muzerolle, J., & Young, E. T. 2006, ApJ, 650, L83 [NASA ADS] [CrossRef] [Google Scholar]
- Balog, Z., Rieke, G. H., Muzerolle, J., et al. 2008, ApJ, 688, 408 [NASA ADS] [CrossRef] [Google Scholar]
- Berghöfer, T. W., Schmitt, J. H. M. M., Danner, R., & Cassinelli, J. P. 1997, A&A, 322, 167 [NASA ADS] [Google Scholar]
- Bessell, M. S., & Brett, J. M. 1988, PASP, 100, 1134 [NASA ADS] [CrossRef] [Google Scholar]
- Carpenter, J. M. 2001, AJ, 121, 2851 [NASA ADS] [CrossRef] [Google Scholar]
- D'Antona, F., & Mazzitelli, I. 1997, in Cool Stars in Clusters and Associations, ed. R. Pallavicini, & G. Micela, Mem. S. A. It., 68, 807 [Google Scholar]
- De Becker, M., Rauw, G., Pittard, J. M., et al. 2004, A&A, 416, 221 [NASA ADS] [CrossRef] [EDP Sciences] [Google Scholar]
- Dahm, S. E., & Simon, T. 2005, AJ, 129, 829 [NASA ADS] [CrossRef] [Google Scholar]
- FitzGerald, M. P., Jackson, P. D., Luiken, M., Grayzeck, E. J., & Moffat, A. F. J. 1978, MNRAS, 182, 607 [NASA ADS] [CrossRef] [Google Scholar]
- Ford, A., Jeffries, R. D., Smalley, B., et al. 2002, A&A, 393, 617 [NASA ADS] [CrossRef] [EDP Sciences] [Google Scholar]
- Gorti, U., & Hollenbach, D. 2009, ApJ, 690, 1539 [Google Scholar]
- Hamuy, M., Walker, A. R., Suntzeff, N. B., et al. 1992, PASP, 104, 533 [NASA ADS] [CrossRef] [Google Scholar]
- Hawley, S. L., Gizis, J. E., & Reid, I. N. 1996, AJ, 112, 2799 [NASA ADS] [CrossRef] [Google Scholar]
- Jacoby, G. H., Hunter, D. A., & Christian, C. A. 1984, ApJS, 56, 257 [NASA ADS] [CrossRef] [Google Scholar]
- Jahreiß, H., & Wielen, R. 1997, in Hipparcos'97, ESA SP-402, ed. B. Battrick, M. A. C. Perryman, & P. L. Bernacca, 675 [Google Scholar]
- Jeffries, R. D., Thurston, M. R., & Pye, J. P. 1997, MNRAS, 287, 350 [NASA ADS] [CrossRef] [Google Scholar]
- Kenyon, S. J., & Hartmann, L. 1995, ApJS, 101, 117 [NASA ADS] [CrossRef] [Google Scholar]
- Kharchenko, N. V., Piskunov, A. E., Röser, S., Schilbach, E., & Scholz, R. D. 2005, A&A, 438, 1163 [NASA ADS] [CrossRef] [EDP Sciences] [MathSciNet] [Google Scholar]
- Landin, N. R., Mendes, L. T. S., & Vaz, L. P. R. 2009, A&A, 494, 209 [NASA ADS] [CrossRef] [EDP Sciences] [Google Scholar]
- Linder, N., Rauw, G., Sana, H., De Becker, M., & Gosset, E. 2007, A&A, 474, 193 [NASA ADS] [CrossRef] [EDP Sciences] [Google Scholar]
- Lloyd Evans, T. 1978, MNRAS, 184, 661 [NASA ADS] [CrossRef] [Google Scholar]
- Martins, F., Schaerer, D., & Hillier, D. J. 2005, A&A, 436, 1049 [NASA ADS] [CrossRef] [EDP Sciences] [Google Scholar]
- Meyer, M. R., Calvet, N., & Hillenbrand, L. A. 1997, AJ, 114, 288 [NASA ADS] [CrossRef] [Google Scholar]
- Meynet, G., & Maeder, A. 2003, A&A, 404, 975 [NASA ADS] [CrossRef] [EDP Sciences] [Google Scholar]
- Nazé, Y. 2009, A&A, 506, 1055 [NASA ADS] [CrossRef] [EDP Sciences] [Google Scholar]
- Nishiyama, S., Tamura, M., Hatano, H., et al. 2009, ApJ, 696, 1407 [NASA ADS] [CrossRef] [Google Scholar]
- Paunzen, E., Netopil, M., & Zwintz, K. 2007, A&A, 462, 157 [NASA ADS] [CrossRef] [EDP Sciences] [Google Scholar]
- Piskunov, A. E., Schilbach, E., Kharchenko, N. V., Röser, S., & Scholz, R. D. 2008, A&A, 477, 165 [NASA ADS] [CrossRef] [EDP Sciences] [Google Scholar]
- Preibisch, T., Guenther, E., & Zinnecker, H. 2001, AJ, 121, 1040 [NASA ADS] [CrossRef] [Google Scholar]
- Prisinzano, L., Damiani, F., Micela, G., & Sciortino, S. 2005, A&A, 430, 941 [NASA ADS] [CrossRef] [EDP Sciences] [Google Scholar]
- Rauw, G., & De Becker, M. 2008, in Handbook of Star Forming Regions, Vol. II: The Southern Sky, ed. B. Reipurth, ASP Monograph Publ., 5, 497 [Google Scholar]
- Rauw, G., De Becker, M., Gosset, E., Pittard, J. M., & Stevens, I. R. 2003, A&A, 407, 925 [NASA ADS] [CrossRef] [EDP Sciences] [Google Scholar]
- Sana, H., Rauw, G., Nazé, Y., Gosset, E., & Vreux, J.-M. 2006, MNRAS, 372, 661 [NASA ADS] [CrossRef] [Google Scholar]
- Sana, H., Rauw, G., Sung, H., Gosset, E., & Vreux, J.-M. 2007, MNRAS, 377, 945 [NASA ADS] [CrossRef] [Google Scholar]
- Schulz, N. S. 2005, From Dust to Stars (Chichester, UK: Springer & Praxis Publishing Ltd.) [Google Scholar]
- Siess, L., Dufour, E., & Forestini, M. 2000, A&A, 358, 593 [NASA ADS] [Google Scholar]
- Skrutskie, M. F., Cutri, R. M., Stiening, R., et al. 2006, AJ, 131, 1163 [NASA ADS] [CrossRef] [Google Scholar]
- Sung, H., Bessell, M. S., & Lee, S.-W. 1997, AJ, 114, 2644 [NASA ADS] [CrossRef] [Google Scholar]
- Thé, P. S., Hageman, T., Westerlund, B. E., & Tjin A Djie, H. R. E. 1985, A&A, 151, 391 [NASA ADS] [Google Scholar]
- Zwintz, K., Marconi, M., Reegen, P., & Weiss, W. W. 2005, MNRAS, 357, 345 [NASA ADS] [CrossRef] [Google Scholar]
Footnotes
- ... NGC 6383
- Based on observations collected at the European Southern Observatory (ESO, La Silla, Chile).
- ...
- Table 2 is only available in electronic form at the CDS via anonymous ftp to cdsarc.u-strasbg.fr (130.79.128.5) or via http://cdsweb.u-strasbg.fr/cgi-bin/gcat?J/A+A/511/A25
- ...
- Research Associate FRS-FNRS (Belgium).
- ...
- Research Director FRS-FNRS (Belgium).
- ...
- Postdoctoral Researcher FRS-FNRS (Belgium).
- ... are
- The zeropoints in these relations only apply to our reduction of this specific data set and cannot be compared to other reductions of other WFI data.
- ... website
- http://www.eso.org/sci/facilities/lasilla//instruments/wfi/inst/zeropoints/ColorEquations
- ... colours
- Table 2 with the standard photometric data of those sources that are detected in all filters is available at the CDS.
- ... web
- http://nedwww.ipac.caltech.edu/level/Gray/frames.html
- ... star
- Throughout this paper, we shall use the numbering convention introduced in Paper I to designate the X-ray sources in the cluster, except when stated otherwise.
- ... 2003
- http://www.ipac.caltech.edu/2mass/index.html
- ... core
- Kharchenko et al. (2005) estimate a core radius of 4.8 arcmin and a corona radius of 15 arcmin for NGC 6383, while Piskunov et al. (2008) evaluate a tidal radius of at least 30 arcmin.
All Tables
Table 1: The filters used in the photometric campaigns with the WFI.
Table 2: Summary of the properties of the targets of our spectroscopic sample.
Table 3: Mean ages and standard age deviations (in Myr) for the various samples of PMS candidates in NGC 6383.
All Figures
|
|
Figure 1: Comparison between the B-V colour index in the WFI system and the standard system for 156 stars selected as the best observed among those in common with Paunzen et al. (2007). The solid line yields our best-fit colour transformation. |
| Open with DEXTER | |
| In the text | |
|
|
Figure 2:
Left and middle panel: flux-calibrated
spectra of the F-K type stars in our spectroscopic sample of
NGC 6383. The fluxes were arbitrarily normalized to unity at
the wavelength of 6820 Å and the spectra were shifted
vertically by 0.4 units for clarity. The spectral types become
progressively later from left to right and from top to bottom.
The rightmost panel shows a zoom on the spectral region
around the H |
| Open with DEXTER | |
| In the text | |
|
|
Figure 3: Flux-calibrated spectra of the two early-type stars in our spectroscopic sample of NGC 6383. Star #76 probably has an earlier spectral type than #56, but is much more absorbed. The fluxes are presented in the same way as in Fig. 2. |
| Open with DEXTER | |
| In the text | |
|
|
Figure 4: Colour-magnitude diagrams of the WFI photometric data with errors of less than 0.15 on V and less than 0.21 in the relevant colour. Single and multiple counterparts of the X-ray sources from Paper I are shown as filled and open squares, respectively, while the PMS candidates from Paunzen et al. (2007) are shown as open circles. The main-sequence relation was shifted to account for a distance modulus of 10.57 and a reddening of E(B - V) = 0.32. The reddening vectors are shown for each diagram and the short and long-dashed lines yield the 1.5 and 10 Myr isochrones, respectively, from Siess et al. (2000). |
| Open with DEXTER | |
| In the text | |
|
|
Figure 5:
Left panel: colour-colour diagram of the
2MASS counterparts of the WFI objects. Only those sources with reliable
near-IR photometry are shown. The solid lines yield the locus of the
main-sequence and of the giant branch according to Bessell &
Brett (1988), while
the dashed straight line indicates the locus of the unreddened cTTs
following Meyer et al. (1997).
The reddening vector is shown for |
| Open with DEXTER | |
| In the text | |
|
|
Figure 6:
Left: the |
| Open with DEXTER | |
| In the text | |
|
|
Figure 7:
Left: three-colour image of the
NGC 6383 cluster compiled from our WFI photometry.
Right: spatial distribution of the H |
| Open with DEXTER | |
| In the text | |
|
|
Figure 8:
Top: Hertzsprung-Russell diagram of the X-ray
sources, PNZ objects, H |
| Open with DEXTER | |
| In the text | |
|
|
Figure 9: Distribution of ages as inferred from the comparison with PMS isochrones. The evolutionary models are from D'Antona & Mazzitelli (1997, top left), Siess et al. (2000, top right), and Landin et al. (2009) without rotation ( lower left) and with rotation ( lower right). |
| Open with DEXTER | |
| In the text | |
Copyright ESO 2010
Current usage metrics show cumulative count of Article Views (full-text article views including HTML views, PDF and ePub downloads, according to the available data) and Abstracts Views on Vision4Press platform.
Data correspond to usage on the plateform after 2015. The current usage metrics is available 48-96 hours after online publication and is updated daily on week days.
Initial download of the metrics may take a while.