| Issue |
A&A
Volume 506, Number 3, November II 2009
|
|
|---|---|---|
| Page(s) | 1199 - 1213 | |
| Section | Interstellar and circumstellar matter | |
| DOI | https://doi.org/10.1051/0004-6361/200912068 | |
| Published online | 18 August 2009 | |
A&A 506, 1199-1213 (2009)
The inner rim structures of protoplanetary discs
M. Kama1 - M. Min1,2 - C. Dominik1,3
1 - Anton Pannekoek Astronomical Institute, University of Amsterdam, PO Box 94249, 1090 GE Amsterdam, The Netherlands
2 -
Utrecht Astronomical Institute, University of Utrecht, PO Box 80000, 3508 TA Utrecht, The Netherlands
3 -
Department of Astrophysics, Radboud University Nijmegen, Postbus 9010, 6500 GL Nijmegen, The Netherlands
Received 13 March 2009 / Accepted 27 July 2009
Abstract
The inner boundary of protoplanetary discs is structured by the
dramatic opacity changes at the transition from the dust-containing to
a dust-free zone. This paper explores the variety and limits of inner
rim structures in passively heated dusty discs. For this study, we
implemented detailed sublimation physics in a fast Monte Carlo
radiative transfer code. We show that the inner rim in dusty discs is
not an infinitely sharp wall but a diffuse region which may be narrow
or wide. Furthermore, high surface densities and large silicate grains
as well as iron and corundum grains decrease the rim radius, from a
2.2 AU radius for small silicates around a
![]() Herbig Ae star typically to 0.4 AU and as close as 0.2 AU. A
passive disc with grain growth and a diverse dust composition must thus
have a small inner rim radius. Finally, an analytical expression is
presented for the rim location as a function of dust, disc and stellar
properties.
Herbig Ae star typically to 0.4 AU and as close as 0.2 AU. A
passive disc with grain growth and a diverse dust composition must thus
have a small inner rim radius. Finally, an analytical expression is
presented for the rim location as a function of dust, disc and stellar
properties.
Key words: stars: circumstellar matter - stars: planetary systems: protoplanetary disks
1 Introduction
The inner regions of protoplanetary discs are the birthplaces of terrestrial planets. Understanding their nature and diversity is key to our picture of the formation of planetary systems.
This paper uses Monte Carlo radiative transfer modelling and detailed sublimation physics to explore the inner rim structures of passive dust discs, and their merits in reconciling theory with observation.
T Tauri and Herbig Ae/Be stars have prominent infrared excesses in their spectral energy distributions (SEDs), due to the presence of protoplanetary discs. The existence of such discs is known observationally through statistics of photometric colours (Lada & Adams 1992; Calvet et al. 1992; Adams et al. 1987; Rydgren & Zak 1987), spectral fitting (Kenyon & Hartmann 1987), imaging (McCaughrean & O'dell 1996; Burrows et al. 1996), interferometry (Mannings & Sargent 1997), and is inferred from studies of the Solar System and exoplanets. Based on broadband SEDs, discs are classified as either self-shadowed or flaring (Kenyon & Hartmann 1987; Dullemond & Dominik 2004; Meeus et al. 2001) and their temperature structure can be approximated with two layers to explain solid-state silicate emission bands (Chiang & Goldreich 1997). In the inner regions of discs, dust sublimates. The location where starlight reaches an optical depth of unity in the dust is referred to as the inner rim. The dust sublimation temperature is around 1500 K, so the inner rim radiates in the near-infrared.
In this paper, we use a new Monte Carlo radiative transfer code to study the effects of various physical parameters on the inner rim structure of protoplanetary discs. Our motivation is outlined in Sect. 2. Dust sublimation, backwarming and other theoretical aspects are introduced in Sect. 3 and the results are presented in Sect. 4. A discussion and conclusions follow in Sects. 5 and 6.
2 Observational and physical motivation
Herbig Ae/Be stars typically show excess near-infrared (NIR,
![]() )
emission, corresponding to temperatures of
)
emission, corresponding to temperatures of ![]() 1500 K. Most fractional NIR excesses,
1500 K. Most fractional NIR excesses,
![]() ,
form a rising histogram from
,
form a rising histogram from
![]() to 0.22 and are well reproduced by models including dust sublimation in a hydrostatic disc (Dullemond et al. 2001; Isella & Natta 2005, hereafter DDN01 and IN05). Larger excesses, e.g.
to 0.22 and are well reproduced by models including dust sublimation in a hydrostatic disc (Dullemond et al. 2001; Isella & Natta 2005, hereafter DDN01 and IN05). Larger excesses, e.g.
![]() and 0.25 for AB Aur and WW Vul (Natta et al. 2001), and
and 0.25 for AB Aur and WW Vul (Natta et al. 2001), and
![]() for HD 142527 (Dominik et al. 2003),
have proven impossible to reproduce with existing models without
introducing unrealistic assumptions about the rim scaleheight or dust
sublimation temperature.
for HD 142527 (Dominik et al. 2003),
have proven impossible to reproduce with existing models without
introducing unrealistic assumptions about the rim scaleheight or dust
sublimation temperature.
Herbig Ae/Be and T Tauri stars have been shown to follow a
![]() law for inner rim radii measured in the NIR regime (Millan-Gabet et al. 2007; Monnier et al. 2005),
thought to coincide with the dust rim. Most Herbig Ae/Be rims in this
sample have been shown to be scattered within expected limits (Monnier et al. 2005) for a radius determined by dust sublimation, consistent with an optically thin inner hole. Some Herbig Be stars, with
law for inner rim radii measured in the NIR regime (Millan-Gabet et al. 2007; Monnier et al. 2005),
thought to coincide with the dust rim. Most Herbig Ae/Be rims in this
sample have been shown to be scattered within expected limits (Monnier et al. 2005) for a radius determined by dust sublimation, consistent with an optically thin inner hole. Some Herbig Be stars, with
![]() ,
conform to models where the inner hole is optically thick in the
midplane and the rim radii are consequently smaller. Gas undergoing
accretion onto the star has been assumed as the inner hole opacity
source in these cases.
,
conform to models where the inner hole is optically thick in the
midplane and the rim radii are consequently smaller. Gas undergoing
accretion onto the star has been assumed as the inner hole opacity
source in these cases.
The presence of a smooth, extended hot emission component interior to the dust sublimation radius has been deduced for several systems from interferometric observations (Isella et al. 2008; Tannirkulam et al. 2008a; Eisner et al. 2007; Tannirkulam et al. 2008b; Kraus et al. 2008). A hot emission component in the inner hole has recently gained further support from spatially resolved spectroscopy (Najita et al. 2009; Eisner et al. 2009).
Meanwhile, the physico-chemical parameter space of dust rim models has been little explored in terms of variations in global inner disc properties (surface density profile, composition) and dust type (astronomical silicate has been the standard opacity and homogeneous spheres the particle shape). The complex geometry and high optical depth of protoplanetary discs can now be studied with fast Monte Carlo radiative transfer codes (Min et al. 2009), providing further incentive to incorporate more detailed physics to clarify the limits of dusty rim models.
3 Methods
We consider models of passive discs, with temperature structures dominated by irradiation from the central star, and no accretional heating. (For a broader review of disc models, we refer the reader to Dullemond et al. 2007.) The modern paradigm in passive disc models was developed by Chiang & Goldreich (1997, hereafter CG97). In this approach, the disc consists of a cool midplane and a hot surface layer. Such models are highly successful in reproducing the general form and solid state bands of young star SEDs, but not the NIR excess, as emission from the dust sublimation region is not considered.
Any realistic dust species will sublimate at or below a temperature of
![]() K, corresponding to an emission maximum around
K, corresponding to an emission maximum around
![]() .
In a disc, this implies a radius inside which no dust can exist.
Terminating the CG97 density distribution at such a radius results in a
dust wall that is exposed to direct starlight, becomes hot and ``puffs
up'' (Natta et al. 2001;
and DDN01). Backwarming, explained later, pushes the sublimation
location to larger radii. The DDN01 models explain the NIR excess, but
the emission is very inclination dependent, an effect contradicted by
observations.
.
In a disc, this implies a radius inside which no dust can exist.
Terminating the CG97 density distribution at such a radius results in a
dust wall that is exposed to direct starlight, becomes hot and ``puffs
up'' (Natta et al. 2001;
and DDN01). Backwarming, explained later, pushes the sublimation
location to larger radii. The DDN01 models explain the NIR excess, but
the emission is very inclination dependent, an effect contradicted by
observations.
A semi-analytical treatment including a gas density dependent
sublimation temperature was applied successfully in explaining observed
SEDs and deriving important properties such as characteristic grain
sizes (IN05 and Isella et al. 2006).
The rim surface was shown to be curved rather than wall-like, due to
the dependence of the sublimation temperature on gas density (IN05). Isella et al. (2006)
successfully fitted the SEDs and interferometric rim radii of four out
of five Herbig Ae stars with IN05 models. In most cases, the best fits
required astronomical silicate grains of ![]()
![]() m size. However, the modelled rim radii were larger than those obtained by Eisner et al. (2004) by up to a factor of three, and simultaneously fitting the SED and rim radius of AB Aur was unsuccessful.
m size. However, the modelled rim radii were larger than those obtained by Eisner et al. (2004) by up to a factor of three, and simultaneously fitting the SED and rim radius of AB Aur was unsuccessful.
In a passive disc, the structure of the inner rim is determined by the stellar parameters, the surface density, cooling efficiencies and sublimation temperatures of the dust species, and by backwarming. Because the dust temperature and hydrostatic structure are also intimately coupled in a non-trivial geometry, finding static, stable solutions in terms of dust temperature structure is a difficult task, for which Monte Carlo radiative transfer is well suited.
Monte Carlo radiative transfer has been used to extend the IN05 models to two grain sizes in thermal contact (Tannirkulam et al. 2007). It was shown that grain growth, specifically the presence of grains of different sizes and settling of large grains, strongly curves the inner rim. A comparison with these results is made in Sect. 5.
Table 1: A summary of the dust properties.
3.1 The bulk gas and vapour densities
The total amount of gas in a disc is referred to as the bulk gas in this paper. The bulk gas density determines the amount of dust present if a fixed gas to dust mass ratio, e.g.
![]() ,
is assumed. Dust grains always contribute some particles to the gas
phase. These do not appreciably change the gas mass but do maintain the
gas-grain equilibrium, with gas phase particles of the dust species
sticking onto a grain and balancing its evaporation. If all of a given
dust species must be in the gas phase to maintain this equilibrium, we
call its density the vapour density.
In reality, many gas-phase species may combine to maintain the
gas-grain equilibrium of any solid species. As at most a few species
exist simultaneously in our models, we generally neglect this fact,
with some exceptions (see Sect. 5.2).
,
is assumed. Dust grains always contribute some particles to the gas
phase. These do not appreciably change the gas mass but do maintain the
gas-grain equilibrium, with gas phase particles of the dust species
sticking onto a grain and balancing its evaporation. If all of a given
dust species must be in the gas phase to maintain this equilibrium, we
call its density the vapour density.
In reality, many gas-phase species may combine to maintain the
gas-grain equilibrium of any solid species. As at most a few species
exist simultaneously in our models, we generally neglect this fact,
with some exceptions (see Sect. 5.2).
3.2 Dust sublimation
The temperature of a dust grain is determined by its
wavelength-dependent opacity, and by the intensity and spectrum of the
radiation field responsible for the heating. The cooling efficiency,
given by
![]() ,
is a ratio between the Planck mean opacity of the dust species at its
own temperature to that at the stellar temperature, or for a single
grain the ratio of absorption cross sections. In an identical stellar
radiation field, a grain with a large
,
is a ratio between the Planck mean opacity of the dust species at its
own temperature to that at the stellar temperature, or for a single
grain the ratio of absorption cross sections. In an identical stellar
radiation field, a grain with a large ![]() will achieve radiative equilibrium at a lower temperature than a grain with a small
will achieve radiative equilibrium at a lower temperature than a grain with a small ![]() ,
and generally epsilon increases with grain size.
,
and generally epsilon increases with grain size.
For a grain to be stable, the particle flux excaping from its
surface must be balanced by the flux coming onto it from the gas phase.
If the temperature gets too high, the grain will sublimate. The first
rim models assumed that this would occur at
![]() ,
e.g. DDN01 used 1500 K. Generally, the sublimation temperature of
a dust species is a function of the partial pressure of its gas phase
component,
,
e.g. DDN01 used 1500 K. Generally, the sublimation temperature of
a dust species is a function of the partial pressure of its gas phase
component,
![]() .
The ideal gas equation of state can be used to replace the partial pressure P of the species with a function of its temperature and its vapour density,
.
The ideal gas equation of state can be used to replace the partial pressure P of the species with a function of its temperature and its vapour density,
![]() .
Loosely following Zemansky (1968), the vapour density at saturation pressure is given by the Clausius-Clapeyron equation:
.
Loosely following Zemansky (1968), the vapour density at saturation pressure is given by the Clausius-Clapeyron equation:
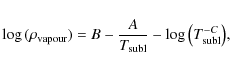
where A, B and C are thermodynamical quantities that can be fitted using laboratory measurements
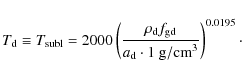
We take C=-1 and obtain A and B from a published table of evaporation temperatures with corresponding bulk gas densities and abundances (Pollack et al. 1994, P94). The resulting parameters for Eq. (1), alongside those obtained from other sources, are summarized in Table 1.
In fitting the P94 data, the partial pressure of each species was
expressed through its abundance and molecular mass, and the bulk gas
density. Parameters from other sources were converted (see Eq. (2)
of Lamy 1974; and Eq. (10) of Cameron & Fegley 1982). The table also gives
![]() at
at
![]() and references for each species, with asterisks denoting the species used in this study.
and references for each species, with asterisks denoting the species used in this study.
Sublimation curves of the main species used in this work are shown in Fig. 2. At vapour densities of
![]() ,
olivine sublimates at around 1300 K, iron at 1400 K and corundum at 1500 K. Corundum must have an abundance <
,
olivine sublimates at around 1300 K, iron at 1400 K and corundum at 1500 K. Corundum must have an abundance <![]() of the total dust mass and thus will necessarily have a much lower partial density than olivine or iron.
of the total dust mass and thus will necessarily have a much lower partial density than olivine or iron.
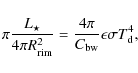
3.3 Backwarming
If a dust grain cannot cool into empty space in every direction, its
temperature increases due to backwarming. Geometrically, the
backwarming factor
![]() can be defined as the ratio of a full
can be defined as the ratio of a full ![]() solid angle to the solid angle subtended by the empty sky seen by the
grain. For each photon emitted into the sky area obscured by nearby
matter, a similar photon returns, hence the term ``backwarming''. An
estimate of the temperature of a dust grain on the rim surface is
obtained from the equation
solid angle to the solid angle subtended by the empty sky seen by the
grain. For each photon emitted into the sky area obscured by nearby
matter, a similar photon returns, hence the term ``backwarming''. An
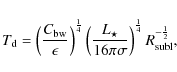
estimate of the temperature of a dust grain on the rim surface is
obtained from the equation
where the energy absorbed by a grain at a distance
![]() yields the temperature of a grain in an optically thin environment, and when
yields the temperature of a grain in an optically thin environment, and when
![]() is considered it gives the smallest possible distance from the star a
passive grain may orbit for longer than its sublimation timescale. This
limit has been used by e.g. Tuthill (2001) and Monnier &
Millan-Gabet (2002) to obtain lower limits on disc inner radii. It must
be kept in mind that such limits are derived under assumptions
regarding grain opacities, sublimation temperatures and geometry. In
assuming the rim was an instantaneously optically thick vertical wall,
DDN2001 adopted
is considered it gives the smallest possible distance from the star a
passive grain may orbit for longer than its sublimation timescale. This
limit has been used by e.g. Tuthill (2001) and Monnier &
Millan-Gabet (2002) to obtain lower limits on disc inner radii. It must
be kept in mind that such limits are derived under assumptions
regarding grain opacities, sublimation temperatures and geometry. In
assuming the rim was an instantaneously optically thick vertical wall,
DDN2001 adopted
![]() .
This illustrates how far backwarming can move the rim. As Monnier
et al. (2005) pointed out, the rim is actually between the two
limits, depending on over what distance the dust becomes optically
thick. The concept of such an optically thin region in front of the rim
is illustrated by Figs. 1 and 3.
.
This illustrates how far backwarming can move the rim. As Monnier
et al. (2005) pointed out, the rim is actually between the two
limits, depending on over what distance the dust becomes optically
thick. The concept of such an optically thin region in front of the rim
is illustrated by Figs. 1 and 3.
![\begin{figure}
\par\includegraphics[width=9cm]{12068fg1.eps}
\end{figure}](/articles/aa/full_html/2009/42/aa12068-09/img58.png)
|
Figure 1:
A schematic of the inner few AU of a disc. The colour map indicates the temperature, from <300 K (dark) to >2000 K (white). At the optically thin radius,
|
| Open with DEXTER | |
![\begin{figure}
\par\includegraphics[angle=90, clip=, width=9cm]{12068fg2}
\end{figure}](/articles/aa/full_html/2009/42/aa12068-09/img59.png)
|
Figure 2: Sublimation curves
of the species used in this work. The vapour density of the species is
used. At low vapour densities, corundum is the most refractory, whereas
at higher values iron is relatively more refractory. At least one of
the two species is always relatively more refractory than olivine. The
expression for the curves is given in Eq. (1), and the fitting parameters in Table 1. The IN05 fitting formula has been abundance-corrected for this plot, otherwise it would lie |
| Open with DEXTER | |
![\begin{figure}
\par\includegraphics[clip=, width=9cm]{12068fg3}
\end{figure}](/articles/aa/full_html/2009/42/aa12068-09/img60.png)
|
Figure 3: A schematic midplane dust temperature profile of an efficiently backwarmed rim. In front of the rim, the optically thin equilibrium temperature of the dust grains is plotted. Once this drops below the sublimation temperature, dust can condense. Generally, the sublimation temperature decreases with radius because of the increasing scaleheight and decreasing surface density. Between the dust destruction and classical rim radii, there is a region in which dust may condense but need not be optically thick. Dust in this region is warm, but not close to the sublimation temperature. The dust temperature peaks locally at the optically thick rim location, and then falls rapidly to a low value inside the disc. See also Fig. 1. |
| Open with DEXTER | |
On the rim,
![]() may
also be true for special locations. One can imagine this for a dust
grain sitting at the far end of a tunnel which extends into the rim
(see also Appendix C).
may
also be true for special locations. One can imagine this for a dust
grain sitting at the far end of a tunnel which extends into the rim
(see also Appendix C).
3.4 Monte Carlo radiative transfer with MCMax
Radiative transfer through the complex dust geometries we wish to consider requires a flexible method in terms of density structures and dust composition. In addition, the coupled nature of the dust temperature and the hydrostatic structure also calls for an iterative solution. The required flexibility and speed can be obtained by using Monte Carlo radiative transfer.
We use here the Monte Carlo radiative transfer code MCMax (Min et al. 2009). Because of an efficient implementation of the diffusion approximation for regions with high optical depth, this code is especially suited for fast computations of geometries involving high optical depths.
The radiative transfer is based on the Monte Carlo scheme of continuous reemission developed by Bjorkman & Wood (2001) and optically thin regions are treated with the method of Lucy (1999).
To model the inner rim, dust sublimation was implemented into MCMax according to Eq. (1).
The density structure of the dust is solved for by iterating the
radiative transfer, dust sublimation and recondensation, and vertical
hydrostatic equilibrium. After each iteration, the spatial grid is
rebuilt in order to properly sample the new density structure. This
ensures that in each iteration the radial resolution around
![]() is sufficient for
is sufficient for
![]() through any cell to be less than a fraction of unity.
through any cell to be less than a fraction of unity.
Condensation, if it can occur, must be treated carefully. An upper
limit is to transfer all the gas phase dust into grains, but if done
too quickly this may overheat the cell, forcing sublimation and thus a
loop. In the rim region, between
![]() and 4, the change in solid dust mass in any cell is weighted so that the change is smaller the closer the cell is to the local
and 4, the change in solid dust mass in any cell is weighted so that the change is smaller the closer the cell is to the local
![]() .
The gas fraction of any dust species is constrained to be radially and
vertically monotonous in this region. Furthermore, the optical depth
added radially in front of the
.
The gas fraction of any dust species is constrained to be radially and
vertically monotonous in this region. Furthermore, the optical depth
added radially in front of the ![]() surface cannot exceed 0.1. Some physical solutions might be suppressed
by our constraints, but we expect a proper treatment of these to
require time-dependent modelling. For a detailed discussion of the
numerical aspects of implementing the sublimation physics we refer the
reader to Appendix C.
surface cannot exceed 0.1. Some physical solutions might be suppressed
by our constraints, but we expect a proper treatment of these to
require time-dependent modelling. For a detailed discussion of the
numerical aspects of implementing the sublimation physics we refer the
reader to Appendix C.
In reality, the sublimation of grains will cause the grains to lose mass, and thereby decrease in size. For practical considerations, and because we want to systematically study the effects of varying the grain size, we keep the size of the grains independent of the sublimation state, but increase or decrease their number density.
3.5 Disc parameters
3.5.1 General properties
The disc model is parametrized as follows: a radial dust surface density distribution ![]() is described by two joined power laws,
R-p1 and
R-p2, extending from an inner radius
is described by two joined power laws,
R-p1 and
R-p2, extending from an inner radius
![]() out to
out to
![]() .
The power laws are joined at the location
.
The power laws are joined at the location ![]() .
The total dust mass,
.
The total dust mass,
![]() ,
gas to dust ratio, and a dust composition are specified.
,
gas to dust ratio, and a dust composition are specified.
In general, we assume
![]() AU,
AU,
![]() AU, p1=0.0, p2=1.5 and
AU, p1=0.0, p2=1.5 and
![]() AU.
A flat inner disc surface density makes the interpretation of our
results more straightforward, especially for the optically thin zones.
AU.
A flat inner disc surface density makes the interpretation of our
results more straightforward, especially for the optically thin zones.
Most of our models assume a dust mass of
![]() .
For a parameter study of the inner disc surface density, this is varied from
.
For a parameter study of the inner disc surface density, this is varied from
![]() to
to
![]() (
(
![]() to
to
![]() ).
).
The gas to dust ratio is 100 everywhere, and the gas and dust
scaleheights are coupled. All our models use the star previously
employed by IN05, with
![]() K,
K,
![]() ,
and
,
and
![]() .
.
The IN05 comparison discs are parametrized as
![]() AU,
AU,
![]() AU and p1=p2=1.5, with homogeneous spheres (HS) of astronomical silicate as the opacity model.
AU and p1=p2=1.5, with homogeneous spheres (HS) of astronomical silicate as the opacity model.
3.5.2 Dust types
The opacities of the dust grains are sensitive to their size and shape. For modelling the effects of the grain shape on the opacities, we use the statistical approach (Bohren & Huffman 1983; Min et al. 2003). This allows to take the grain shape effects into account properly using computationally favorable grain geometries. We apply the distribution of hollow spheres (DHS; see Min et al. 2005).
For the composition of the grains previous studies have frequently used the so-called astronomical silicate (Draine & Lee 1984). This species is most likely a composite of different materials with different sublimation laws. Its composition is unknown and we are thus unable to derive a proper sublimation law for astronomical silicate. Therefore, in this paper we focus mainly on well characterized materials which have been measured in the laboratory and are known to exist in meteorites.
We begin by exploring discs with various grain sizes and surface densities of amorphous olivine. Then, models with two olivine grain sizes, and with dust types of different transparency, refractivity and cooling effiency are presented.
The presence of small, ![]()
![]() m
grains in discs is revealed by fitting observed solid state emission
bands. We use a model with such grains as a reference point. Large,
m
grains in discs is revealed by fitting observed solid state emission
bands. We use a model with such grains as a reference point. Large, ![]()
![]() m
grains have a higher cooling efficiency than small grains, and as grain
growth is known to occur in discs, they are also of great interest in
modelling. To study the effects of large grains on the inner disc
structure, we present models with 10 or
m
grains have a higher cooling efficiency than small grains, and as grain
growth is known to occur in discs, they are also of great interest in
modelling. To study the effects of large grains on the inner disc
structure, we present models with 10 or
![]() olivine grains added to
olivine grains added to
![]() particles. Discs of 1, 10, 100 and
particles. Discs of 1, 10, 100 and
![]() olivine are presented in Sects. 4 and 5.
olivine are presented in Sects. 4 and 5.
Surface density influences the inner rim in several ways: it sets
the sublimation temperature, influences the backwarming efficiency and
determines over what radial distance any given optical depth is
reached. We vary the dust surface density in the inner disc from
![]() to
to
![]() as a parameter study.
as a parameter study.
In modelling two grain types, we assume they are not in thermal contact, unless the contrary is explicitly stated. This is to allow more efficiently cooling or refractory species to exist independently of less efficiently cooling or more volatile species. Thermal coupling will arise from the Monte Carlo radiative transfer in sufficiently dense regions, where all species will be in radiative thermal equilibrium. Unless stated otherwise, abundance ratios of 9999/1, 90/10 and 10/90 are used in studying grain mixtures.
Above ![]() 1000 K,
amorphous silicates anneal to form crystalline silicates. The amorphous
component is represented by olivine in our models. It has been found
that the annealed silicates are often iron-poor and magnesium-rich,
e.g. forsterite and enstatite. Observations (van Boekel et al. 2004) and the short timescale of crystallization (Lenzuni et al. 1995) suggest that the crystalline silicate fraction on the inner rim surface approaches unity.
1000 K,
amorphous silicates anneal to form crystalline silicates. The amorphous
component is represented by olivine in our models. It has been found
that the annealed silicates are often iron-poor and magnesium-rich,
e.g. forsterite and enstatite. Observations (van Boekel et al. 2004) and the short timescale of crystallization (Lenzuni et al. 1995) suggest that the crystalline silicate fraction on the inner rim surface approaches unity.
We only present ![]() m
forsterite grains in this paper. Given the expected high abundance of
crystalline particles in the inner disc, we also perform full
scattering computations for our olivine and forsterite mixtures. Using
a
m
forsterite grains in this paper. Given the expected high abundance of
crystalline particles in the inner disc, we also perform full
scattering computations for our olivine and forsterite mixtures. Using
a ![]() ,
,
![]() or
or ![]() forsterite abundance allows to follow the transition from an amorphous-
to crystalline-dominated rim, assuming the former is represented by
olivine and the latter by forsterite.
forsterite abundance allows to follow the transition from an amorphous-
to crystalline-dominated rim, assuming the former is represented by
olivine and the latter by forsterite.
Iron grains, plausibly a sink of iron left over from forsterite formation, is another component we explore. Small iron grains cool more efficiently than small olivine grains, furthermore iron is significantly more refractory in the high vapour density regime, as seen in Fig. 2. Abundance ratios of 9999/1 and 90/10 are used in our olivine and iron disc models.
Corundum has been suggested to exist in discs (e.g. Lenzuni et al. 1995).
It is very refractory in the low vapour density regime, and forms a
``highly refractory envelope'' around olivine together with iron in
![]() -
-
![]() parameter space, as seen in Fig. 2.
We use a trace olivine/corundum mass abundance of 9999/1 and compare it
with a model where this ratio is 99/1. The latter is a convenient
limit, approaching one obtained by taking a mixture with cosmic
abundances and putting all aluminium into corundum.
parameter space, as seen in Fig. 2.
We use a trace olivine/corundum mass abundance of 9999/1 and compare it
with a model where this ratio is 99/1. The latter is a convenient
limit, approaching one obtained by taking a mixture with cosmic
abundances and putting all aluminium into corundum.
Materials such as olivine do not exist in single molecule form and decompose during sublimation (Duschl et al. 1996). Thus, particles transferred to the gas phase from one grain species may contribute to upholding the gas-grain equilibrium of another species (Dominik et al. 1993). We have attempted to take this into account by using the summed partial pressures of amorphous olivine and crystalline forsterite to uphold the gas-grain equilibrium of both. Any pure iron released by the sublimation of olivine is not considered as a separate dust species in these models.
For comparison with previous studies we also present several models using astronomical silicate, in these cases the olivine sublimation law is applied.
4 Results
The results of our disc modelling are presented in this section. We first put forward single grain type models with realistic opacities. Then, dependencies on grain size and surface density are discussed. Finally, the effects of adding various amounts of different grain sizes or types are shown. A detailed comparison with the results of IN05 and Tannirkulam et al. (2007) may be found in Appendix B.
The optical depths are computed using the dust Planck mean opacity at the stellar temperature of 10 000 K.
![\begin{figure}
\par\includegraphics[angle=90, clip=, width=8.8cm]{12068fg4}
\end{figure}](/articles/aa/full_html/2009/42/aa12068-09/img92.png)
|
Figure 4:
Distances along the midplane, in AU, where
|
| Open with DEXTER | |
4.1 Olivine grains of various sizes
For the main batch of models, we used opacities of iron-containing olivines, with sublimation properties from P94.
![\begin{figure}
\par\includegraphics[clip=, width=18cm]{12068fg5}
\end{figure}](/articles/aa/full_html/2009/42/aa12068-09/img97.png)
|
Figure 5:
|
| Open with DEXTER | |
4.1.1 The developing rim
The first important result is that the inclusion of detailed condensation and sublimation physics leads to a rim location which is not entirely stable. This is demonstrated in Fig. 4, where we show the location and sharpness of the rim as a function of the computational iteration number.
We begin the computation by placing the rim at the
![]() location (iteration 0), followed by two backwarming iterations where the location is dictated by an upper limit on
location (iteration 0), followed by two backwarming iterations where the location is dictated by an upper limit on
![]() .
The radiative transfer (temperature determination across the disc),
vertical structure of the disc, and dust sublimation and condensation
are iterated on 50 to 200 times. For each iteration, we plot a
horizontal bar in Fig. 4, showing the radii where the optical depth radially along the midplane ranges from 0.1 to 10, with a mark on the
.
The radiative transfer (temperature determination across the disc),
vertical structure of the disc, and dust sublimation and condensation
are iterated on 50 to 200 times. For each iteration, we plot a
horizontal bar in Fig. 4, showing the radii where the optical depth radially along the midplane ranges from 0.1 to 10, with a mark on the ![]() location.
Thus a short, point-like extent of the bar indicates a sharp rim that
jumps from low to high optical depth very fast, i.e. the classical
structure as proposed by DDN01.
location.
Thus a short, point-like extent of the bar indicates a sharp rim that
jumps from low to high optical depth very fast, i.e. the classical
structure as proposed by DDN01.
Over 1000 iterations, we see that both the rim location as well as
its inward motion are unstable. Around iteration 150, the sublimation
temperature is exceeded in a small region in the rim, which becomes
very sharp, with the
![]() and 10 locations moving close together. The backwarming efficiency
increases and the rim recedes. Around iteration 250, a new cycle begins
with optically thin zone formation.
and 10 locations moving close together. The backwarming efficiency
increases and the rim recedes. Around iteration 250, a new cycle begins
with optically thin zone formation.
Similar variability in the rim location is evident in models with
multiple grain types. The variability in rim structure which we have
demonstrated can, in some cases, considerably affect the fractional NIR
excess,
![]() ,
making it difficult to associate illustrative values with a particular model. We are working on clarifying the issue.
,
making it difficult to associate illustrative values with a particular model. We are working on clarifying the issue.
It must be emphasized that while we have just described the changes in rim structure as if time-dependent, our modelling has no physical time dependence. Rather, our results seem to indicate that there is no unique, static solution for the dust distribution in the rim, at least when a single grain type is used, and variations should be expected in a proper time-dependent treatment.
![\begin{figure}
\par\includegraphics[bb=1.25cm 1.75cm 19cm 25.5cm, angle=90, clip=, width=17cm]{12068fg6}
\end{figure}](/articles/aa/full_html/2009/42/aa12068-09/img102.png)
|
Figure 6: Temperature (main)
and density (insets) maps of disc inner regions for various olivine
mixtures. The axes show radial distance from the star along the
midplane and vertical height from it. The colour levels represent the
dust temperature in steps of 100 K, for reference we give solid
lines at 500 K and 1300 K. Also shown are the radial (dashed)
and vertical (dotted) |
| Open with DEXTER | |
4.1.2 Grain size and surface density
As we saw in Sect. 3, both the grain size as well as the surface density influence the rim location. This is demonstrated in the first three panels of the summary diagram in Fig. 5, which show the rim location and sharpness for models with three different grain sizes and a range of surface densities. For a given total (solid and vapour) dust surface density of 1 g/cm2 (models 0-2), the rim of 0.1Another feature of the single grain type models is the relative
sharpness of the rims. It seems that if enough condensible material is
available, the rim will take a sharp form, as assumed in the classical
rim models. The low surface density computation in model 3 reveals
the situation in discs with low amounts of condensible material
available. In model 3, the
![]() to 10 region extends from 0.67 to 1.88 AU because the opacity
is too small for the optical depth to rise quickly with radius even if
all condensible material is put in the solid phase. A similar effect is
seen in models 9-13, where the same parameter study as with
models 3-8 is carried out with 100
to 10 region extends from 0.67 to 1.88 AU because the opacity
is too small for the optical depth to rise quickly with radius even if
all condensible material is put in the solid phase. A similar effect is
seen in models 9-13, where the same parameter study as with
models 3-8 is carried out with 100 ![]() m grains.
m grains.
While in these models, the low surface density or very large grain size might seem artifical, effects similar to those seen here also emerge in multi-grain models with trace species that might be present in the very hot inner regions of discs. We will now turn our attention to these models.
![\begin{figure}
\par\includegraphics[bb=1.25cm 1.75cm 19cm 25.5cm, angle=90, clip=, width=17cm]{12068fg7}
\end{figure}](/articles/aa/full_html/2009/42/aa12068-09/img104.png)
|
Figure 7:
Temperature (main) and density (insets) maps of disc inner regions for various grain mixtures. See Fig. 6 for a detailed legend. Top row: a disc with an olivine to corundum mass abundance ratio of 9999/1. Shown are the temperatures of the
|
| Open with DEXTER | |
4.2 Two sizes of olivine grains
Increasing the grain size generally allows cooling to gain in efficiency compared to heating. We will now present the effects of this in models where small and large grains are mixed.
Models 14-17 of Fig. 5 contain two different grain sizes of the same material, in this case olivine. How the optically thin region is cooled by the large olivine grains, and then filled up as the abundance is increased, is demonstrated sequentially as temperature maps in Fig. 6.
In the upper row of Fig. 6, the
![]() grains (left panel) have a rim at 2.22 AU, the
grains (left panel) have a rim at 2.22 AU, the
![]() particles (right panel) at 0.43 AU. Differences in dust temperature throughout the inner disc are evident.
particles (right panel) at 0.43 AU. Differences in dust temperature throughout the inner disc are evident.
Model 14, seen in the middle row, is a disc with a
![]() to
to
![]() grain
mass ratio of 9999/1. The trace abundance of efficiently cooling large
grains is sufficient to give rise to an extended, cool region of low
optical depth, which shifts the condensation location of
grain
mass ratio of 9999/1. The trace abundance of efficiently cooling large
grains is sufficient to give rise to an extended, cool region of low
optical depth, which shifts the condensation location of
![]() grains from 2.22 AU (model 0) to 1.68 AU. The
grains from 2.22 AU (model 0) to 1.68 AU. The
![]() location coincides closely with this point, indicating that a large amount of
location coincides closely with this point, indicating that a large amount of
![]() grains exists, pushing up the opacity. An optical depth of
grains exists, pushing up the opacity. An optical depth of
![]() is reached at 0.81 AU, indicating the optically thin region covers
is reached at 0.81 AU, indicating the optically thin region covers ![]() of the rim radius and around
of the rim radius and around ![]() of the surface inside that radius.
of the surface inside that radius.
The effect of pulling in the rim is more pronounced in model 15, seen in the bottom row of Fig. 6, where ![]() of the dust mass is in
of the dust mass is in
![]() olivine grains and the rest in
olivine grains and the rest in
![]() grains.
The inner rim is now at 0.45 AU. The large grains dominate the
structure, which is close to that of the disc with only large grains
(model 1). The smaller,
grains.
The inner rim is now at 0.45 AU. The large grains dominate the
structure, which is close to that of the disc with only large grains
(model 1). The smaller,
![]() grains exist all the way to the new rim location, in a region where
they could never condense without the presence of the larger particles.
grains exist all the way to the new rim location, in a region where
they could never condense without the presence of the larger particles.
Model 16 shows that a fractional mass abundance of 10-4 of
![]() grains
has very little effect on the small grain rim, for their low abundance
is insufficient to contribute to the optical depth. Model 17
demonstrates that a
grains
has very little effect on the small grain rim, for their low abundance
is insufficient to contribute to the optical depth. Model 17
demonstrates that a ![]() abundance of
abundance of
![]() grains is sufficient for them to dominate the rim location at a total dust surface density of
grains is sufficient for them to dominate the rim location at a total dust surface density of
![]() .
.
4.3 Olivine and forsterite
Forsterite is expected to be very abundant in the inner rim region.
We now present modelled disc structures obtained with no scattering
(our usual assumption) and with isotropic scattering for mixtures of
![]() olivine and forsterite.
olivine and forsterite.
Since relative to olivine, forsterite grains are highly transparent
to stellar radiation, one might imagine them to exist very close to the
star. In addition to having a low heating efficiency in the stellar
radiation field, however, forsterite grains cool very inefficiently at
temperatures of 1300![]() 1500 K.
This causes them to sublimate at approximately the same radius as the
iron-rich silicates, leading to no difference between the rim structure
of model 1 and models 18 to 20 in the case with no
scattering, as seen in Fig. 5.
Including isotropic scattering (lower, dark gray lines of
models 18 to 20) slightly increases the rim radius because of
the increased backwarming efficiency. Note that at temperatures of a
few hundred kelvin, the forsterite grains will cool much more
efficiently and be much cooler than the iron-containing silicate
grains.
1500 K.
This causes them to sublimate at approximately the same radius as the
iron-rich silicates, leading to no difference between the rim structure
of model 1 and models 18 to 20 in the case with no
scattering, as seen in Fig. 5.
Including isotropic scattering (lower, dark gray lines of
models 18 to 20) slightly increases the rim radius because of
the increased backwarming efficiency. Note that at temperatures of a
few hundred kelvin, the forsterite grains will cool much more
efficiently and be much cooler than the iron-containing silicate
grains.
4.4 Small amounts of effienctly cooling or ultra-refractory material
Small,
![]() grains
of iron and corundum are more efficiently cooling than olivine of the
same size, and may exist significantly closer to the star. The high
refractivity of corundum and iron provides another mechanism that
allows grains to survive near the star.
grains
of iron and corundum are more efficiently cooling than olivine of the
same size, and may exist significantly closer to the star. The high
refractivity of corundum and iron provides another mechanism that
allows grains to survive near the star.
A mass abundance of 0.0001 in
![]() iron
grains pulls the rim of similarly sized olivine from 2.22 AU to
1.63 AU and gives rise to an optically thin zone covering
iron
grains pulls the rim of similarly sized olivine from 2.22 AU to
1.63 AU and gives rise to an optically thin zone covering ![]()
![]() of the rim radius (model 21). While
of the rim radius (model 21). While
![]() iron is cooler than olivine, it does not cool the inner disc as efficiently as corundum does (see below and Fig. 7). A
iron is cooler than olivine, it does not cool the inner disc as efficiently as corundum does (see below and Fig. 7). A ![]() abundance of small iron pulls the rim to 0.71 AU, but now the rim
is very sharp (model 22), and the structure resembles that
obtained with a 90/10 mass ratio of small and large olivine grains
(model 15, see Fig. 6)
abundance of small iron pulls the rim to 0.71 AU, but now the rim
is very sharp (model 22), and the structure resembles that
obtained with a 90/10 mass ratio of small and large olivine grains
(model 15, see Fig. 6)
Adding an abundance as large as ![]() of either 0.1 or
of either 0.1 or
![]() iron particles to
iron particles to
![]() olivine
(models 23 and 24) has little effect on the rim location
(model 1), as the cooling efficiency of larger olivine grains is
similar to that of iron.
olivine
(models 23 and 24) has little effect on the rim location
(model 1), as the cooling efficiency of larger olivine grains is
similar to that of iron.
Model 25 shows the effects of a mass abundance of 0.0001 of
![]() corundum
grains in a disc of olivine of the same size. The corundum is
significantly cooler than the olivine, as seen in Fig. 7. The rim has moved from 2.22 AU (the
corundum
grains in a disc of olivine of the same size. The corundum is
significantly cooler than the olivine, as seen in Fig. 7. The rim has moved from 2.22 AU (the
![]() olivine rim in model 0) to 1.57 AU, with an optically thin zone beginning already at 0.84 AU, i.e. covering
olivine rim in model 0) to 1.57 AU, with an optically thin zone beginning already at 0.84 AU, i.e. covering ![]()
![]() of the radial distance and
of the radial distance and ![]() of the surface area inside the
of the surface area inside the ![]() radius.
radius.
Allocating corundum a mass fraction of 0.01 (model 26), a rough
upper limit based on the assumption that the cosmic abundance of
aluminium is all in corundum, demonstrates that this species can draw
the rim in considerably. Small,
![]() corundum grains draw the rim in more efficiently than iron of the same
size, both because they are relatively more refractory at the low
densities they have in these models (as low as
corundum grains draw the rim in more efficiently than iron of the same
size, both because they are relatively more refractory at the low
densities they have in these models (as low as
![]() ,
see Fig. 2), and because they cool more efficiently at temperatures typical of dust sublimation.
,
see Fig. 2), and because they cool more efficiently at temperatures typical of dust sublimation.
A comparison of how small abundances of
![]() corundum
and iron in a disc of identically sized olivine cool the inner disc,
and how their refractivity allows them to exist closer to the star, is
presented as temperature maps of models 25, 21 and 22 in
Fig. 7.
Corundum (top row) cools more efficiently than iron (e.g. middle row),
and with a further contribution from its high refractivity, it moves
the rim to 1.57 AU, closer to the star than an identical mass
abundance of iron, which is at 1.63 AU. A
corundum
and iron in a disc of identically sized olivine cool the inner disc,
and how their refractivity allows them to exist closer to the star, is
presented as temperature maps of models 25, 21 and 22 in
Fig. 7.
Corundum (top row) cools more efficiently than iron (e.g. middle row),
and with a further contribution from its high refractivity, it moves
the rim to 1.57 AU, closer to the star than an identical mass
abundance of iron, which is at 1.63 AU. A ![]() mass abundance of small iron grains is sufficient for them to dominate
the rim structure and decrease the radius considerably, to
0.71 AU. Due to the similar cooling properties of
mass abundance of small iron grains is sufficient for them to dominate
the rim structure and decrease the radius considerably, to
0.71 AU. Due to the similar cooling properties of
![]() iron and
iron and
![]() olivine grains, models 15 and 22 are similar.
olivine grains, models 15 and 22 are similar.
5 Discussion
5.1 Modelling summary
We have successfully employed the Monte Carlo radiative transfer code MCMax (Min et al. 2009) in modelling the inner rim structures of dusty passive protoplanetary discs.
Results in Sect. 4 show that, especially for larger grains, a rigorous treatment of dust sublimation and condensation, together with other rim physics in MCMax, may not always lead to a stable solution for a solid dust density and temperature distribution in a passive, static disc framework.
5.2 Where is the rim?
The rims of MCMax disc models are generally between the optically thin destruction and the backwarmed wall radii (the
![]() and 4 radii, respectively). Grains can begin to attenuate the stellar radiation field from the
and 4 radii, respectively). Grains can begin to attenuate the stellar radiation field from the
![]() location
outward, allowing the rim to exist closer than a fully backwarmed
estimate. That the rim location could vary like this has been pointed
out earlier (e.g. Monnier et al. 2005), but we have explored the phenomenon in detail for the first time.
location
outward, allowing the rim to exist closer than a fully backwarmed
estimate. That the rim location could vary like this has been pointed
out earlier (e.g. Monnier et al. 2005), but we have explored the phenomenon in detail for the first time.
For a given dust species, larger grains will generally cool more
efficiently and thus will set the rim location, but only if they are
present in sufficient abundance, as shown in Figs. 5 and 6. Large grains of olivine can exist much closer to the star than small grains. A small, 0.0001 abundance of
![]() grains is enough to create an extended, cool optically thin region in front of the rim, which is still determined by
grains is enough to create an extended, cool optically thin region in front of the rim, which is still determined by
![]() grains. Allocating a fraction 0.1 of the mass to large grains is sufficient for them to determine the rim location.
grains. Allocating a fraction 0.1 of the mass to large grains is sufficient for them to determine the rim location.
It was noted by IN05 that the most refractory species would determine the rim location, if it was also able to build up enough optical depth. They also pointed out that for one species, the largest grains would position the rim under the same assumption. We add the generalization that refractivity and cooling efficiency combine to determine the species which sets the rim radius. A very high cooling efficiency may allow a species which does not have the highest sublimation temperature to determine the rim location.
For a given cooling efficiency, the species with the highest
sublimation temperature will determine the rim location, again assuming
a sufficient abundance of it is present. Corundum has been considered
an ultra-refractory condensate in discs, which it is if one assumes
that all species have equal partial pressures. However, if the dust
vapour densities are taken equal, as in vertical slices in Fig. 2, corundum is more refractory at vapour densities
![]() ,
but at
,
but at
![]() ,
the sublimation temperature of iron is higher and increases rapidly.
Hence, iron is the most likely dust species to be responsible for rim
temperatures above 1500 K
,
the sublimation temperature of iron is higher and increases rapidly.
Hence, iron is the most likely dust species to be responsible for rim
temperatures above 1500 K![]() .
.
The above points to the fact that if grain growth proceeds steadily
and the dust has a complex composition featuring efficiently cooling
and refractory metal oxides such as iron or corundum, the rim will
exist close to the star, at 0.4 AU or closer for a
![]() Herbig star if
Herbig star if
![]() (see Figs. 5 and 8). Evidence for grain growth is presented in e.g. van Boekel et al. (2004) and Herbst et al. (2008). Relatively large rim radii, for a star of the type used here
(see Figs. 5 and 8). Evidence for grain growth is presented in e.g. van Boekel et al. (2004) and Herbst et al. (2008). Relatively large rim radii, for a star of the type used here
![]() AU, are likely to arise as the inner disc is cleared of gas by the magneto-rotational instability (Chiang & Murray-Clay 2007) or a planet, lowering the sublimation temperature. Dust may also be dynamically cleared.
AU, are likely to arise as the inner disc is cleared of gas by the magneto-rotational instability (Chiang & Murray-Clay 2007) or a planet, lowering the sublimation temperature. Dust may also be dynamically cleared.
![\begin{figure}
\par\includegraphics[angle=90, clip=, width=9cm]{12068fg8}
\end{figure}](/articles/aa/full_html/2009/42/aa12068-09/img119.png)
|
Figure 8:
Midplane rim locations and dust surface densities for various sizes of olivine. Boxes represent the final computed MCMax iteration, usually between 50 and 200. The left solid line connects models with
|
| Open with DEXTER | |
Surface density controls the rim location for a given grain size. This is described by a
![]() power law in the sublimation-controlled regime and is illustrated in Fig. 8. The low density ends of lines in Fig. 8 branch off from the power law as there is insufficient mass to reach
power law in the sublimation-controlled regime and is illustrated in Fig. 8. The low density ends of lines in Fig. 8 branch off from the power law as there is insufficient mass to reach ![]() at
the dust evaporation location. An analytical description of the rim
location as a function of surface density for both the
sublimation-controlled and optical depth controlled regimes is given in
Eq. (3). It is a curve which branches from the power law and asymptotically becomes parallel to the x-axis.
at
the dust evaporation location. An analytical description of the rim
location as a function of surface density for both the
sublimation-controlled and optical depth controlled regimes is given in
Eq. (3). It is a curve which branches from the power law and asymptotically becomes parallel to the x-axis.
![$\displaystyle R_{\rm rim} = \left[ C_{1}^{-p} \left(22.09\Sigma_{\rm subl}^{0.0...
...lon}\right)^{\frac{1+8.080{p}}{8}}\right)\right]^{-\frac{4}{1+4{p}}}[{\rm cm}].$](/articles/aa/full_html/2009/42/aa12068-09/img121.png)
This equation, derived in Appendix A, yields the curves seen in Fig. 8.
The good correspondence of the analytical curves described by the above equation with our numerical results shows that Eq. (3) captures the processes that are thought to dominate the rim location in dusty discs, and we propose it as an aid in interpreting more sophisticated numerical models, but also observations.
The sublimation properties of olivine were used in the above
derivation. To use the presented formalism for any dust species, a
power law fit to Pollack et al. (1994) data should be obtained (
![]() ,
see also IN05 and compare with Eq. (1)).
,
see also IN05 and compare with Eq. (1)).
Omittances in the above analytical approach include the temperature dependence of the cooling efficiency,
![]() ,
and the fact that partial condensation of dust occurs in front of the
,
and the fact that partial condensation of dust occurs in front of the ![]() location,
i.e. the rim is always somewhat diffuse. These two effects are the main
culprits in the discrepancies between the numerical and analytical
curves seen in Fig. 8.
location,
i.e. the rim is always somewhat diffuse. These two effects are the main
culprits in the discrepancies between the numerical and analytical
curves seen in Fig. 8.
We use a flat dust surface density profile
![]() ,
where p=0, in the inner disc, however Eq. (3) is generic and allows to use the canonical
,
where p=0, in the inner disc, however Eq. (3) is generic and allows to use the canonical
![]() .
Furthermore, the sublimation location for a given surface density and
grain type is independent of the surface density power law.
.
Furthermore, the sublimation location for a given surface density and
grain type is independent of the surface density power law.
Used with observed rim radii, Eq. (3) may prove useful in estimating the surface density in the inner disc. For this, the equation should be solved numerically for
![]() ,
inserting the stellar properties and adopting constraints on the grain opacity and the surface density power law.
,
inserting the stellar properties and adopting constraints on the grain opacity and the surface density power law.
5.3 Is the rim diffuse or sharp?
The optically thin inner disc region is an important concept. A
![]() region between
region between
![]() and 4
is supported by any of three conditions: 1) a low surface density, 2) a
high surface density but very low opacity, and 3) early stages of
dust condensation in a cool region.
and 4
is supported by any of three conditions: 1) a low surface density, 2) a
high surface density but very low opacity, and 3) early stages of
dust condensation in a cool region.
Condition 1 can be met by a low-abundance of a species which is more refractory than the bulk of the dust, such as corundum (see model 25 in Fig. 5), or which can cool relatively efficiently, such as large grains or iron (models 14 and 21 in Fig. 5).
Condition 2 could be met by a dust type which is very transparent in the optical, but cools efficiently in the NIR. If the scattering phase function of such a species is not strongly forward-peaked, a population of grains closer to the star than the rim (determined in this case by the sublimation of another, more opaque species) could further give rise to an extended hot radiation zone through scattering.
Condition 3 is met as a transient phenomenon in our models, which allow dust to slowly condense into an initially empty inner disc, creating and then filling in an optically thin region, as illustrated by Fig. 4. Transient heating events such as a powerful flares may destroy dust in an inner disc region, which will subsequently go through a similar cycle of a transient extended optically thin zone during dust re-condensation. It would be surprising to observe long-lived sharp rims composed of only large grains. However, our modelling also indicates that adding several types of dust to a model makes the rim structure much more stable.
5.4 Dust differentiation
Differentiation of dust types can occur in the optically thin region, where highly refractory or very efficiently cooling species can exist independently of more volatile or less efficiently cooling species. Maintaining such an extensive optically thin region in a disc with a diverse and broad distribution of grain sizes and compositions requires considerable fine-tuning, thus sublimation-based differentiation in a static disc is unlikely.
5.5 Observational implications
The smallest observed characteristic rim radii for
![]() stars are around 0.2 AU (Millan-Gabet et al. 2007).
These come from ring model fits to visibility curves. In the framework
of our models, such small radii require grains of around
stars are around 0.2 AU (Millan-Gabet et al. 2007).
These come from ring model fits to visibility curves. In the framework
of our models, such small radii require grains of around
![]() to be present at dust surface densities of
to be present at dust surface densities of
![]() (Fig. 5, in particular models 11 to 13).
(Fig. 5, in particular models 11 to 13).
It may be feasible to put a lower limit on the inner rim surface density
![]() of a system with Eq. (3), under the assumptions that a measured
of a system with Eq. (3), under the assumptions that a measured
![]() corresponds to
corresponds to
![]() ,
and that
,
and that
![]() is determined by the sublimation of grains with
is determined by the sublimation of grains with
![]() .
The former is suggested by comparison of the Monte Carlo and analytical results in Fig. 8,
and the latter reflects the assumption that large, efficiently cooling
grains will dominate the inner disc. One could then use a measured
.
The former is suggested by comparison of the Monte Carlo and analytical results in Fig. 8,
and the latter reflects the assumption that large, efficiently cooling
grains will dominate the inner disc. One could then use a measured
![]() with the stellar luminosity and mass to obtain a simple lower limit on the surface density.
with the stellar luminosity and mass to obtain a simple lower limit on the surface density.
Furthermore, it is interesting to assume that the largest grains
needed to satisfactorily fit the mid- to far-infrared SED of a system
provide a lower limit on the size of the grains setting the location of
the inner rim. Under this assumption, an upper limit for
![]() could be obtained by using the cooling efficiency
could be obtained by using the cooling efficiency
![]() of these grains in Eq. (3). If we further assume that these grains dominate the rim location instead of
of these grains in Eq. (3). If we further assume that these grains dominate the rim location instead of
![]() grains, we are again left with a lower limit on
grains, we are again left with a lower limit on
![]() .
.
Comparing these limits with observed disc masses and canonical
![]() power laws will constrain the difference between the inner and outer disc surface density profiles.
Our results hold if the optical depth of gas in the inner hole to stellar radiation is
power laws will constrain the difference between the inner and outer disc surface density profiles.
Our results hold if the optical depth of gas in the inner hole to stellar radiation is
![]() and, relatedly, if accretion can be neglected. If the gas continuum opacity in the inner hole is
and, relatedly, if accretion can be neglected. If the gas continuum opacity in the inner hole is
![]() ,
shielding will decrease the dust destruction radius by
,
shielding will decrease the dust destruction radius by
![]() ,
if the gas itself does not approach stellar temperatures. A hot gaseous
component may give rise to NIR emission observed inside the dust
destruction radius in some systems (Isella et al. 2008; Tannirkulam et al. 2008a; Eisner et al. 2007; Tannirkulam et al. 2008b; Kraus et al. 2008).
,
if the gas itself does not approach stellar temperatures. A hot gaseous
component may give rise to NIR emission observed inside the dust
destruction radius in some systems (Isella et al. 2008; Tannirkulam et al. 2008a; Eisner et al. 2007; Tannirkulam et al. 2008b; Kraus et al. 2008).
As Najita et al. (2009) have
pointed out, modelling indicates that gas in the inner hole of a Herbig
Ae/Be star should produce spectral features of CO and H2O,
but instead a continuum process was found necessary to explain the
compact NIR excess of MWC480. Potentially relevant opacity sources
inside the classical dust sublimation radius include H2O, ![]() ,
free-free emission and highly refractory or transparent dust species (e.g. Najita et al. 2009).
However, even the most refractory species hypothesized to exist in
discs, such as corundum, are not expected to have a significant solid
fraction inside the classical silicate dust sublimation radius.
,
free-free emission and highly refractory or transparent dust species (e.g. Najita et al. 2009).
However, even the most refractory species hypothesized to exist in
discs, such as corundum, are not expected to have a significant solid
fraction inside the classical silicate dust sublimation radius.
If a dust species is responsible for a extended hot emission component reaching from a few stellar radii to the optically thick dust rim, it is likely to have low absorption in the visible range and a high cooling efficiency in the NIR. Moreover, species with small absorption cross-sections and relatively isotropic scattering phase functions in the visible or NIR regimes may play a role in creating an extended radiating zone in the inner disc by scattering stellar or rim emission.
Forsterite meets some of the above requirements, however it is not able to cool efficiently in the NIR and thus differs little from olivine in terms of rim structure, as seen in Fig. 5.
5.6 Looking ahead
To make full use of our work, observed SEDs and interferometric visibilities (as opposed to rim radii derived from them under various assumptions) need to be fitted simultaneously with MCMax or a similarly capable code. A paper focussing on the observational applications of our models is in preparation. We are performing a study of the extreme values of observables that can be obtained with static dust models, as well as simultaneously fitting the SEDs and visibilities of specific objects.
We are actively exploring whether the fractional NIR excesses of our
models provide a source of additional information about the inner disc
surface density and/or grain type. As
![]() varies with iteration as well as grain, disc and stellar properties, a
better handle on the variability of the rim is needed before this
fraction is useful.
varies with iteration as well as grain, disc and stellar properties, a
better handle on the variability of the rim is needed before this
fraction is useful.
Rim temperatures obtained from NIR SED-fitting and limits on inner disc gas densities would increase the usefulness of Eq. (3) in constraining the amount and type of dust in the rim region.
We support the conclusion, overlapping in part with Monnier et al. (2005), that detailed modelling of multi-species condensation and sublimation processes, as well as simultaneous treatment of radiative transfer in the gas and dust components, is needed to make further progress on the numerical side, and encourage gas and dust modellers to join efforts.
6 Conclusions
We have demonstrated a wide range of possible inner rim structures in a parameter study of grain size, composition and dust surface density, as well as multiple grain type models. To do this, we implemented dust sublimation and condensation physics into a fast Monte Carlo radiative transfer code. Here, we outline our main conclusions:
-
- 1.
- The inner rim in dusty discs is not an infinitely sharp wall.
Backwarming effects combine with sublimation and condensation in
leading to a diffuse region that can extend over a significant fraction
of the rim radius. In our treatment, dust generally begins to condense
near the
 location and the
  surface is closer to the star than in previous models.
- 2.
- The inner disc surface density of a given species is an important
parameter, because it determines the highest possible temperature where
the species can be stable. High surface densities move the rim closer
to the star.
- 3.
- The dust component (species or size) which determines the rim
location by building up an optical depth of unity closest to the star
need not have the highest sublimation temperature, it may instead cool
very efficiently.
- 4.
- If large particles are abundant enough to produce optical depth,
then the rim location will be dominated by silicates. If large
particles are not abundant enough, corundum and iron grains will likely
set the rim location. In either case, for our standard star, the rim
location is typically around 0.4 AU, much smaller than models for
 silicate grains would predict.
- 5.
- For any given grain material and size, the rim location can be
analytically expressed as a function of stellar properties and of
surface density. We give this expression in full form for a
silicate-dominated rim.
- 6.
- The optically thin region can cover
 of
the surface inside the rim radius in cases where a very efficiently
cooling or highly refractory species is present in low abundance
compared to the less efficiently cooling or more volatile bulk of the
dust.
of
the surface inside the rim radius in cases where a very efficiently
cooling or highly refractory species is present in low abundance
compared to the less efficiently cooling or more volatile bulk of the
dust.
- 7.
- In the case of very low surface densities, the build-up of optical depth will be slow, and the rim region will be very diffuse.
The authors thank the anonymous referee for providing constructive comments, which significantly helped to improve the paper. M. Kama gratefully acknowledges support from the Netherlands Organisation for Scientific Research (NWO) grant number 021.002.081 and from an HSP Huygens Scholarship. M. Min acknowledges financial support from NWO through a Veni grant.
Appendix A: Analytical relation between rim radius and surface density
The rim location for a given grain type is a function of surface density at the rim location, as seen in Fig. 8.
At high surface densities, this dependence is a power law. This power
law relation is a limiting case of a more general relation describing
the ![]() location as a function of surface density. At low surface densities,
the rim location moves away from the dust sublimation radius as not
enough dust is available there to reach an optical depth of unity.
location as a function of surface density. At low surface densities,
the rim location moves away from the dust sublimation radius as not
enough dust is available there to reach an optical depth of unity.
The calculations that follow use the cgs system of units. This is important to keep in mind when using the final expressions, where everything is implicit except the relevant characteristics of the dust, the disc and the star.
A.1 Sublimation-controlled regime
We assume initially that the rim is at the dust destruction location,
![]() ,
and wish to describe this radius as a function of dust surface density,
,
and wish to describe this radius as a function of dust surface density,
![]() ,
where
,
where
![]() is the gas to dust ratio. Assuming the minimal rim radius is at the dust sublimation location, with
is the gas to dust ratio. Assuming the minimal rim radius is at the dust sublimation location, with
![]() ,
we first express the temperature of a grain at the rim radius from Eq. (2):
,
we first express the temperature of a grain at the rim radius from Eq. (2):
where
Further assuming that the gas and dust are in thermal equilibrium,
their scaleheights will be the same and we can relate the midplane dust
density
![]() to the dust surface density via
to the dust surface density via
where z is the vertical distance from the midplane and h is the scaleheight,
Using the IN05 power law fit to the sublimation law of olivine, we can write
Here, the bulk gas density, used by IN05 in fitting, has been broken into the dust density
![\begin{displaymath}R_{\rm subl} = C_{1}\frac{L_{\star}^{0.53}}{\Sigma_{\rm d}^{0...
...} \left(\frac{C_{\rm bw}}{\epsilon} \right)^{0.53} [{\rm cm}].
\end{displaymath}](/articles/aa/full_html/2009/42/aa12068-09/img160.png)
This power law, where
A.2 Optical depth controlled regime
The inner rim is defined as the radial ![]() location for a stellar photon at
location for a stellar photon at
![]() .
For high surface densities and under the assumptions of full condensation and
.
For high surface densities and under the assumptions of full condensation and
![]() ,
this corresponds closely to the dust destruction radius. However, the
lower the surface density, the longer the distance along the midplane
that photons have to travel to reach an optical depth of unity. Thus,
at relatively low surface densities, one predicts (and our numerical
results show) a turn-off from the power law of Eq. (A.4).
,
this corresponds closely to the dust destruction radius. However, the
lower the surface density, the longer the distance along the midplane
that photons have to travel to reach an optical depth of unity. Thus,
at relatively low surface densities, one predicts (and our numerical
results show) a turn-off from the power law of Eq. (A.4).
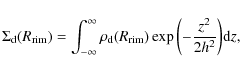
We begin by integrating the optical depth through dust radially along the midplane:
Here,
Employing Eq. (A.4) for
![]() and inserting physical constants, we are left with the following description of the rim location:
and inserting physical constants, we are left with the following description of the rim location:
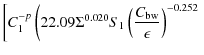
![$\displaystyle \left.\left. -C_{2}\frac{1+4p}{\kappa^{\prime}}\Sigma^{-1-0.078p}...
...silon}\right)^{\frac{1+8.080{p}}{8}}\right)\right]^{-\frac{4}{1+4p}}[{\rm cm}].$](/articles/aa/full_html/2009/42/aa12068-09/img169.png)
This equation yields the curves seen in Fig. 8. P relates to the surface density power law as P=(1+4p)/4 and the properties of the central star are hidden in
Appendix B: Differences from IN05 and Tannirkulam et al. (2007)
In modelling discs parametrized identically with those of Isella & Natta (2005, IN05), we find systematically smaller rim radii. The main reasons are that the IN05 formalism yields a higher optically thin dust temperature and a lower sublimation temperature than the treatment used in this work, as discussed below. A similar study by Tannirkulam et al. (2007, T07), which we also comment on, found results different from both this work and IN05.
We find rim radii smaller than those of both IN05 and T07 and for all modelled grains, i.e. 0.1, 0.5 and
![]() astronomical silicate. As seen in Fig. B.1, the relative difference increases with grain size, from
astronomical silicate. As seen in Fig. B.1, the relative difference increases with grain size, from
![]() for
for
![]() grains to
grains to
![]() for
for
![]() .
.
![\begin{figure}
\par\includegraphics[angle=90,width=9cm,clip]{12068fgA}
\end{figure}](/articles/aa/full_html/2009/42/aa12068-09/img174.png)
|
Figure B.1:
Radial |
| Open with DEXTER | |
The IN05 disc model uses the radiative transfer equation given by Calvet et al. (1991)
for a semi-infinite slab to get a radial temperature structure inside
the rim, and then calculates the vertical structure as in CG97 and
DDN01. A gas to dust ratio of 100 is used, and the total disc mass
is distributed according to a
![]() surface density power law extending from
surface density power law extending from
![]() AU to
AU to
![]() AU.
The dust opacity determines the temperature and vertical structures,
and the gas density is used to compute the dust sublimation temperature
and thus governs dust sublimation.
AU.
The dust opacity determines the temperature and vertical structures,
and the gas density is used to compute the dust sublimation temperature
and thus governs dust sublimation.
To obtain a law for the dependence of the dust sublimation temperature on gas density, IN05 fitted Eq. (A.3) to data from P94. The fitted points were
![]() of
olivine (olivine is used interchangeably with astronomical silicate in
this appendix, as the two are assumed to differ in optical, and not in
sublimation properties) and
of
olivine (olivine is used interchangeably with astronomical silicate in
this appendix, as the two are assumed to differ in optical, and not in
sublimation properties) and
![]() ,
the bulk gas density. Because the grain-gas equilibrium is maintained
by the partial pressure of olivine, this approach yields a
,
the bulk gas density. Because the grain-gas equilibrium is maintained
by the partial pressure of olivine, this approach yields a
![]() law which is applicable only to gas of the same composition as that of
P94. By applying this law to a disc with a purely olivine dust
composition, IN05 obtained lower sublimation temperatures than us, as
discussed next.
law which is applicable only to gas of the same composition as that of
P94. By applying this law to a disc with a purely olivine dust
composition, IN05 obtained lower sublimation temperatures than us, as
discussed next.
P94 supplied the fractional mass abundances of the species in their gas. For olivine, it is 0.00264, i.e.
![]() of the dust mass, assuming a gas to dust ratio of 100. Thus, in the IN05 approach, olivine contributes
of the dust mass, assuming a gas to dust ratio of 100. Thus, in the IN05 approach, olivine contributes ![]() of
the dust mass, but the sublimation temperature is computed from the
bulk gas density under the assumption that there is 100/26.4 times less
olivine present, leading to a correspondingly lower
of
the dust mass, but the sublimation temperature is computed from the
bulk gas density under the assumption that there is 100/26.4 times less
olivine present, leading to a correspondingly lower
![]() .
This underlies our choice to reduce the sublimation law to a dependence of
.
This underlies our choice to reduce the sublimation law to a dependence of
![]() on the vapour density of the species,
on the vapour density of the species,
![]() ,
and not the bulk gas - by doing so, we may use the law for all nebular compositions
,
and not the bulk gas - by doing so, we may use the law for all nebular compositions![]() .
.
Fitting the P94 data for the olivine gas density removed its abundance from our
![]() law,
allowing us to compute the olivine sublimation temperature for any mass
abundance. In an identical disc with pure olivine dust and
law,
allowing us to compute the olivine sublimation temperature for any mass
abundance. In an identical disc with pure olivine dust and
![]() ,
we obtain higher sublimation temperatures than IN05, because for the
same bulk gas density, pure olivine can maintain equilibrium at a
higher temperature than that given by the law IN05 used.
,
we obtain higher sublimation temperatures than IN05, because for the
same bulk gas density, pure olivine can maintain equilibrium at a
higher temperature than that given by the law IN05 used.
The above is illustrated by Fig. B.2, which gives various temperatures in the rim region of an IN05 comparison disc with
![]() grains,
modelled with MCMax. The dash-dotted line is the sublimation
temperature computed and used in MCMax, according to our fit to P94
data. The dotted line, seen to lie
grains,
modelled with MCMax. The dash-dotted line is the sublimation
temperature computed and used in MCMax, according to our fit to P94
data. The dotted line, seen to lie ![]() 50 K below the previous, shows
50 K below the previous, shows
![]() calculated from the same density structure using the IN05 sublimation law.
calculated from the same density structure using the IN05 sublimation law.
To use the IN05 law generally, a ``dummy'' bulk gas density can be
calculated from an olivine density using both the P94 olivine abundance
of 0.00264 and
![]() .
This density can be used in Eq. (A.3) to obtain
.
This density can be used in Eq. (A.3) to obtain
![]() .
We do this when using Eq. (A.3) in Appendix A, obtaining results which match our numerical models very well.
.
We do this when using Eq. (A.3) in Appendix A, obtaining results which match our numerical models very well.
![\begin{figure}
\par\includegraphics[angle=90, clip=, width=9cm]{12068fgB}
\end{figure}](/articles/aa/full_html/2009/42/aa12068-09/img180.png)
|
Figure B.2:
Midplane dust temperature structures for an MCMax model of the IN05 disc with
|
| Open with DEXTER | |
For radiative transfer, IN05 adopted the approach of Calvet et al. (1991). The disc is assumed to be an irradiated semi-infinite slab. A temperature structure derived from this overestimates the disc temperature, because a semi-infinite slab can only cool in one direction, but a disc has a finite height. Two dust temperature profiles are given in Fig. B.2, one from MCMax (solid line) and the other computed for the same density structure using Eq. (1) of IN05 (dashed line). The IN05 approach overestimates the temperature inside the rim compared to a Monte Carlo computation. The backwarming factor as defined in Sect. 3.3 is useful in understanding this, as we will now discuss.
The expression derived by IN05 (their Eq. (6)) from C91 for the optically thin dust temperature is
where T0 is the dust and
Comparing Eqs. (B.1) to (2), taking
![]() ,
we see that a backwarming factor of
,
we see that a backwarming factor of
![]() is implicit in the IN05 calculation. Because
is implicit in the IN05 calculation. Because
![]() ,
the IN05 sublimation locations can be further than our estimates by up to a factor
,
the IN05 sublimation locations can be further than our estimates by up to a factor
![]() for any given grain type (to relate this to rim radii derived from interferometry, see Eqs. (5) and (6) of Isella et al. 2006). Using
for any given grain type (to relate this to rim radii derived from interferometry, see Eqs. (5) and (6) of Isella et al. 2006). Using
![]() in Eq. (A.6) decreases differences with IN05 considerably (from
in Eq. (A.6) decreases differences with IN05 considerably (from ![]() to
to ![]() of
of
![]() for
for
![]() grains). However, as the comparison of results from such a
grains). However, as the comparison of results from such a
![]() and
our Monte Carlo calculations has shown, this assumption generally
overestimates the backwarming factor at the sublimation location.
and
our Monte Carlo calculations has shown, this assumption generally
overestimates the backwarming factor at the sublimation location.
Midplane temperatures of a disc parametrized like an IN05 model with
![]() astronomical silicate are presented in Fig. B.2.
Extrapolating the optically thin dust temperature curves (solid and
dashed lines) to an intersection with the IN05 sublimation temperature
curve for the same density structure (dotted line), and taking into
account the overestimated backwarming at the sublimation location, one
sees how in MCMax, the inner rim is situated at 1.04 AU and how it
would be close to 1.16 AU under the radiative transfer and dust
sublimation assumptions of IN05.
astronomical silicate are presented in Fig. B.2.
Extrapolating the optically thin dust temperature curves (solid and
dashed lines) to an intersection with the IN05 sublimation temperature
curve for the same density structure (dotted line), and taking into
account the overestimated backwarming at the sublimation location, one
sees how in MCMax, the inner rim is situated at 1.04 AU and how it
would be close to 1.16 AU under the radiative transfer and dust
sublimation assumptions of IN05.
Monte Carlo radiative transfer was used by T07 to model discs
parametrized like those of IN05, obtaining rim radii larger than the
MCMax results in all cases, but smaller than IN05 for
![]() grains, and larger than IN05 for
grains, and larger than IN05 for
![]() .
The T07 shift from MCMax seems to be due mostly to their use of the IN05 dust sublimation law, i.e. a low
.
The T07 shift from MCMax seems to be due mostly to their use of the IN05 dust sublimation law, i.e. a low
![]() ,
and a more basic treatment of dust sublimation and the associated
numerical instabilities (A. Tannirkulam, personal communication; see
also Appendix C).
It is not clear whether the latter accounts for the changed order of
rim radii for small and large grains between IN05 and TORUS (used by
T07).
,
and a more basic treatment of dust sublimation and the associated
numerical instabilities (A. Tannirkulam, personal communication; see
also Appendix C).
It is not clear whether the latter accounts for the changed order of
rim radii for small and large grains between IN05 and TORUS (used by
T07).
In summary, compared to the treatment in the present work, the IN05 formalism leads to higher optically thin temperatures because of the assumptions implicit in the radiative transfer, and lower sublimation temperatures for pure olivine or astronomical silicate dust because of an inconsistent use of the dust density. These factors explain their comparatively larger inner rim radii. The work of T07 adopted the IN05 sublimation law with its implications for the rim radii, and the treatment of sublimation and condensation in TORUS is more basic than in MCMax, leading to further variations in rim location which we are presently unable to quantify.
Appendix C: Numerical implementation
In this appendix we discuss the numerical implementation of the sublimation physics described previously. We find that great care has to be taken in order to avoid instabilities or incorrect results. The iterative scheme described below is accompanied by a careful regridding of the spatial grid after each iteration to make sure that the optical depth through the disc is always sampled properly, allowing for accurate radiative transfer. Although the negative effects of a somewhat less optimized spatial grid are not always evident at first sight, we find that the influence on the temperature structure is significant and a proper spatial grid is of crucial importance for a proper implementation of the sublimation physics.
C.1 Iterative method
A straightforward iterative implementation of dust evaporation and recondensation does not always result in a stable solution for the dust density structure. This is because of the high optical depths through the disc and the highly nonlinear radiative transfer effects resulting from it. In addition, changing the dust density in one region of the disc affects the temperature structure at other places, making the problem highly non-local. For example, the condensation of a tiny fraction of the available dust material in the inner region can already make the region in which this material was condensed optically thick, enhancing the effects of backwarming and thereby lifting the temperature of the grains above the evaporation temperature again. At the same time, the region behind it is shielded and there dust can condense. This causes situations where the density flips between two configurations which are both not the equilibrium solution. Thus, care has to be taken not to condense too much material in a single iterative step. However, the other extreme, condensing only so much material such that the change in optical depth is smaller than unity, requires a massive number of iterations which is unfeasible given the computation time required per iteration.
Therefore, one must take care that the amount of material condensed or evaporated in a single iteration is not too small or too large. We have considered several different schemes for deciding how much dust to add or remove. The scheme we found to be the best tradeoff between stability and speed decides how much dust to condense or evaporate according to how close the temperature of the dust species is to its evaporation temperature. In this way, it is possible to take large steps when the solution is far from equilibrium, while the size of the steps is automatically decreased when the solution is locally approached. The method is outlined below.
The parameter we want to determine at every location in the disc is the gas fraction of each species i, ![]() .
The gas fraction is defined as the fraction of the total available material for forming dust grains of species i that is in the gas phase. Thus
.
The gas fraction is defined as the fraction of the total available material for forming dust grains of species i that is in the gas phase. Thus
![]() means dust species i is totally evaporated, while
means dust species i is totally evaporated, while
![]() means all the material is in the solid phase.
means all the material is in the solid phase.
In order to determine ![]() at
each location in the disc we first compute the temperature structure
for the initial guess of the dust density structure (see Sect. C.2
below). From this we compute using Eq. (1) the partial gas
pressure needed to counter the evaporation at each location in the
disc. This gives the equilibrium gas fraction at this temperature,
at
each location in the disc we first compute the temperature structure
for the initial guess of the dust density structure (see Sect. C.2
below). From this we compute using Eq. (1) the partial gas
pressure needed to counter the evaporation at each location in the
disc. This gives the equilibrium gas fraction at this temperature,
![]() .
We also compute the sublimation temperature at each location,
.
We also compute the sublimation temperature at each location,
![]() and the temperature of the grains in the optically thin approximation,
and the temperature of the grains in the optically thin approximation,
![]() .
The new gas fraction is then given by,
.
The new gas fraction is then given by,
| (C.1) |
where the weighting factor
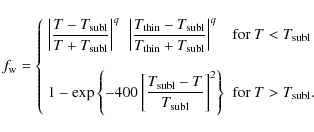
|
(C.2) |
The parameter q determines how fast the condensation of dust can take place and is adjusted such that the increase in optical depth up to the
Together with the sublimation and recondensation of dust in the disc, we also determine the vertical density profile of the disc from hydrostatic equilibrium.
C.2 Initial guess
The success of most iterative schemes depend heavily on the initial guess. This is also true for the iterative scheme described above. Especially the estimate for the location of the start of the inner rim as a function of height above the midplane is of crucial importance for the success of the computation. We compute the initial guess for the dust density structure using analytic consideration as described below.
First we take the temperature structure as obtained by Eq. (3) with an initial guess for
![]() (usually
unity), ignoring the thermal radiation and extinction of the stellar
radiation by other dust grains. This temperature structure can then be
used to compute the gas fraction at each location in the disc, and from
this we setup the first estimate for the density structure. We then do
a full radiative transfer run through this density structure obtaining
a temperature at each location. We use this to determine
(usually
unity), ignoring the thermal radiation and extinction of the stellar
radiation by other dust grains. This temperature structure can then be
used to compute the gas fraction at each location in the disc, and from
this we setup the first estimate for the density structure. We then do
a full radiative transfer run through this density structure obtaining
a temperature at each location. We use this to determine
![]() at the inner rim. Again we use Eq. (3) to determine the temperature at each location in the disc using the new value for
at the inner rim. Again we use Eq. (3) to determine the temperature at each location in the disc using the new value for
![]() .
This will result in a slightly different location of the inner rim. We
iterate this procedure several times to get a proper value for
.
This will result in a slightly different location of the inner rim. We
iterate this procedure several times to get a proper value for
![]() and thereby a good estimate for the location of the inner rim. After
this we proceed with the iterative scheme as described in the previous
section.
and thereby a good estimate for the location of the inner rim. After
this we proceed with the iterative scheme as described in the previous
section.
C.3 Restrictions on the gas fraction gradients
The location of the inner rim as a function of height in the disc is to a large extend determined by the local backwarming efficiency and the density of dust forming material. In the midplane of the disc the density is highest which causes the sublimation temperature to be highest and the rim radius to be small at this height. However, due to the heigh density the backwarming efficiency at the midplane is also highest, which causes the rim to retreat to larger radii. When this retreating effect of backwarming wins from the effect of a higher sublimation temperature, the rim radius at the midplane will be slightly larger than just above it causing a ``hole'' in the disc. Inside this hole the dust is irradiated from almost all sides, causing the effect of backwarming to increase even further and the rim to retreat even further. This is a runaway effect which, in the end, causes the entire disc to retreat to large radii. When this has happened, in front of this rim the temperatures are low and dust can start forming again. This cycle repeats and no stable solution is found.
The above instability might be a physical effect which can emerge in a time-dependend treatment of the problem. However, we do not pursue this in this paper. Therefore, we restrict the gas fraction gradient to avoid triggering this instability. We restrict the gas fraction to be monotonously increasing with increasing height above the midplane. In this way we avoid the formation of a hole in the disc.
Another problem which might arise from the iterative procedure explained above is that the destruction of dust proceeds faster in the region which is effectively backwarmed than in the optically thin region in front of it. This might cause the fraction of condensed material to decrease with increasing radius. This solution turns out to be unstable, and in addition we consider it to be an unlikely physical solution. Thus, to avoid this we restrict the gas fraction to be monotonously decreasing with increasing radius.
Note that by restricting the gas fraction in the ways described above we force the rim to have the curved shape we see in the paper. However, other structures we have found have in all cases turned out to be unstable, thus we consider the curved rim a robust solution.
References
- Adams, F. C., Lada, C. J., & Shu, F. H. 1987, ApJ, 312, 788 [NASA ADS] [CrossRef]
- Bjorkman, J. E., & Wood, K. 2001, ApJ, 554, 615 [NASA ADS] [CrossRef]
- Bohren, C. F., & Huffman, D. R. 1983, Absorption and scattering of light by small particles (New York: Wiley)
- Burrows, C. J., Stapelfeldt, K. R., Watson, A. M., et al. 1996, ApJ, 473, 437 [NASA ADS] [CrossRef]
- Calvet, N., Patino, A., Magris, G. C., & D'Alessio, P. 1991, ApJ, 380, 617 [NASA ADS] [CrossRef]
- Calvet, N., Magris, G. C., Patino, A., & D'Alessio, P. 1992, Rev. Mex. Astron. Astrofis., 24, 27 [NASA ADS]
- Cameron, A. G. W., & Fegley, M. B. 1982, Icarus, 52, 1 [NASA ADS] [CrossRef]
- Chiang, E., & Murray-Clay, R. 2007, Nature Physics, 3, 604 [NASA ADS] [CrossRef]
- Chiang, E. I., & Goldreich, P. 1997, ApJ, 490, 368 [NASA ADS] [CrossRef]
- Dominik, C., Sedlmayr, E., & Gail, H.-P. 1993, A&A, 277, 578 [NASA ADS]
- Dominik, C., Dullemond, C. P., Waters, L. B. F. M., & Walch, S. 2003, A&A, 398, 607 [NASA ADS] [CrossRef] [EDP Sciences]
- Dorschner, J., Begemann, B., Henning, T., Jaeger, C., & Mutschke, H. 1995, A&A, 300, 503 [NASA ADS]
- Draine, B. T., & Lee, H. M. 1984, ApJ, 285, 89 [NASA ADS] [CrossRef]
- Dullemond, C. P., & Dominik, C. 2004, A&A, 417, 159 [NASA ADS] [CrossRef] [EDP Sciences]
- Dullemond, C. P., Dominik, C., & Natta, A. 2001, ApJ, 560, 957 [NASA ADS] [CrossRef]
- Dullemond, C. P., Hollenbach, D., Kamp, I., & D'Alessio, P. 2007, in Protostars and Planets V, ed. B. Reipurth, D. Jewitt, & K. Keil, 555
- Duschl, W. J., Gail, H.-P., & Tscharnuter, W. M. 1996, A&A, 312, 624 [NASA ADS]
- Eisner, J. A., Lane, B. F., Hillenbrand, L. A., Akeson, R. L., & Sargent, A. I. 2004, ApJ, 613, 1049 [NASA ADS] [CrossRef]
- Eisner, J. A., Chiang, E. I., Lane, B. F., & Akeson, R. L. 2007, ApJ, 657, 347 [NASA ADS] [CrossRef]
- Eisner, J. A., Graham, J. R., Akeson, R. L., & Najita, J. 2009, ApJ, 692, 309 [NASA ADS] [CrossRef]
- Herbst, W., Hamilton, C. M., Leduc, K., et al. 2008, Nature, 452, 194 [NASA ADS] [CrossRef]
- Isella, A., & Natta, A. 2005, A&A, 438, 899 [NASA ADS] [CrossRef] [EDP Sciences]
- Isella, A., Testi, L., & Natta, A. 2006, A&A, 451, 951 [NASA ADS] [CrossRef] [EDP Sciences]
- Isella, A., Tatulli, E., Natta, A., & Testi, L. 2008, A&A, 483, L13 [NASA ADS] [CrossRef] [EDP Sciences]
- Kenyon, S. J., & Hartmann, L. 1987, ApJ, 323, 714 [NASA ADS] [CrossRef]
- Koike, C., Kaito, C., Yamamoto, T., et al. 1995, Icarus, 114, 203 [NASA ADS] [CrossRef]
- Kraus, S., Preibisch, T., & Ohnaka, K. 2008, ApJ, 676, 490 [NASA ADS] [CrossRef]
- Lada, C. J., & Adams, F. C. 1992, ApJ, 393, 278 [NASA ADS] [CrossRef]
- Lamy, P. L. 1974, A&A, 35, 197 [NASA ADS]
- Lenzuni, P., Gail, H.-P., & Henning, T. 1995, ApJ, 447, 848 [NASA ADS] [CrossRef]
- Lucy, L. B. 1999, A&A, 344, 282 [NASA ADS]
- Mannings, V., & Sargent, A. I. 1997, ApJ, 490, 792 [NASA ADS] [CrossRef]
- McCaughrean, M. J., & O'dell, C. R. 1996, AJ, 111, 1977 [NASA ADS] [CrossRef]
- Meeus, G., Waters, L. B. F. M., Bouwman, J., et al. 2001, A&A, 365, 476 [NASA ADS] [CrossRef] [EDP Sciences]
- Millan-Gabet, R., Malbet, F., Akeson, R., et al. 2007, in Protostars and Planets V, ed. B. Reipurth, D. Jewitt, & K. Keil, 539
- Min, M., Hovenier, J. W., & de Koter, A. 2003, A&A, 404, 35 [NASA ADS] [CrossRef] [EDP Sciences]
- Min, M., Hovenier, J. W., & de Koter, A. 2005, A&A, 432, 909 [NASA ADS] [CrossRef] [EDP Sciences]
- Min, M., Dullemond, C. P., Dominik, C., de Koter, A., & Hovenier, J. W. 2009, ArXiv e-prints
- Monnier, J. D., Millan-Gabet, R., Billmeier, R., et al. 2005, ApJ, 624, 832 [NASA ADS] [CrossRef]
- Najita, J. R., Doppmann, G. W., Carr, J. S., Graham, J. R., & Eisner, J. A. 2009, ApJ, 691, 738 [NASA ADS] [CrossRef]
- Natta, A., Prusti, T., Neri, R., et al. 2001, A&A, 371, 186 [NASA ADS] [CrossRef] [EDP Sciences]
- Pollack, J. B., Hollenbach, D., Beckwith, S., et al. 1994, ApJ, 421, 615 [NASA ADS] [CrossRef]
- Rydgren, A. E., & Zak, D. S. 1987, PASP, 99, 141 [NASA ADS] [CrossRef]
- Schick, H. L. 1960, Chem. Rev., 60, 331 [CrossRef]
- Servoin, J. L., & Piriou, B. 1973, Phys. Status Solidi (B), 55, 677 [CrossRef]
- Smithells, C. J. 1967, Metals Reference Book (Butterworths)
- Tannirkulam, A., Harries, T. J., & Monnier, J. D. 2007, ApJ, 661, 374 [NASA ADS] [CrossRef]
- Tannirkulam, A., Monnier, J. D., Harries, T. J., et al. 2008a, ApJ, 689, 513 [NASA ADS] [CrossRef]
- Tannirkulam, A., Monnier, J. D., Millan-Gabet, R., et al. 2008b, ApJ, 677, L51 [NASA ADS] [CrossRef]
- van Boekel, R., Min, M., Leinert, C., et al. 2004, Nature, 432, 479 [NASA ADS] [CrossRef]
- Zemansky, M. W. 1968, Heat and Thermodynamics (McGraw-Hill Kogakusha, Ltd.), 346
Footnotes
- ... measurements
![[*]](/icons/foot_motif.png)
- Thermodynamically,
 ,
where
,
where  is the enthalpy of vapourization, and
 .
The molar heat capacity has been broken into constant and
temperature-dependent components,
.
The molar heat capacity has been broken into constant and
temperature-dependent components,
 .
In addition,
.
In addition,
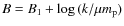 ,
where B1 is given by
,
where B1 is given by
![\begin{displaymath}B_{1} = \frac{1}{\ln{(10)}} \left( \int_{0}^{T}\left[ \frac{\...
... P}^{\prime}{\rm d}T}{T^{2}R} \right]{\rm d}T + {I} \right) ,
\end{displaymath}](/articles/aa/full_html/2009/42/aa12068-09/img48.png)
and I is an integration constant. Sometimes, for example in Smithells (1967) as referenced by Lamy (1974), the full form of Eq. (1) must be invoked to provide a sufficiently accurate fit to experimental data, however most often, as in this paper, the assumptions and C=-1 are made.
- ... 1500 K
- This is subject to the validity of the thermodynamic data for iron from P94. Sublimation temperatures more than 200 K lower than this are found with data from Cameron & Fegley (1982). However, P94 considered a protoplanetary nebula environment, where iron-rich silicates and other species contribute to the vapour pressure of iron. They assumed a silicate to iron mass ratio similar to ours, therefore we use their results with confidence but state that a full treatment of the multi-species gas-grain equilibria is desired.
- ... compositions
- This is valid under the assumption that olivine is the only species contributing to its own gas pressure. While this is not the case as there is no gas phase olivine molecule, it is the best we can do at present if we wish to model discs with a composition different from the P94 nebula.
All Tables
Table 1: A summary of the dust properties.
All Figures
|
|
Figure 1:
A schematic of the inner few AU of a disc. The colour map indicates the temperature, from <300 K (dark) to >2000 K (white). At the optically thin radius,
|
| Open with DEXTER | |
| In the text | |
|
|
Figure 2: Sublimation curves
of the species used in this work. The vapour density of the species is
used. At low vapour densities, corundum is the most refractory, whereas
at higher values iron is relatively more refractory. At least one of
the two species is always relatively more refractory than olivine. The
expression for the curves is given in Eq. (1), and the fitting parameters in Table 1. The IN05 fitting formula has been abundance-corrected for this plot, otherwise it would lie |
| Open with DEXTER | |
| In the text | |
|
|
Figure 3: A schematic midplane dust temperature profile of an efficiently backwarmed rim. In front of the rim, the optically thin equilibrium temperature of the dust grains is plotted. Once this drops below the sublimation temperature, dust can condense. Generally, the sublimation temperature decreases with radius because of the increasing scaleheight and decreasing surface density. Between the dust destruction and classical rim radii, there is a region in which dust may condense but need not be optically thick. Dust in this region is warm, but not close to the sublimation temperature. The dust temperature peaks locally at the optically thick rim location, and then falls rapidly to a low value inside the disc. See also Fig. 1. |
| Open with DEXTER | |
| In the text | |
|
|
Figure 4:
Distances along the midplane, in AU, where
|
| Open with DEXTER | |
| In the text | |
|
|
Figure 5:
|
| Open with DEXTER | |
| In the text | |
|
|
Figure 6: Temperature (main)
and density (insets) maps of disc inner regions for various olivine
mixtures. The axes show radial distance from the star along the
midplane and vertical height from it. The colour levels represent the
dust temperature in steps of 100 K, for reference we give solid
lines at 500 K and 1300 K. Also shown are the radial (dashed)
and vertical (dotted) |
| Open with DEXTER | |
| In the text | |
|
|
Figure 7:
Temperature (main) and density (insets) maps of disc inner regions for various grain mixtures. See Fig. 6 for a detailed legend. Top row: a disc with an olivine to corundum mass abundance ratio of 9999/1. Shown are the temperatures of the
|
| Open with DEXTER | |
| In the text | |
|
|
Figure 8:
Midplane rim locations and dust surface densities for various sizes of olivine. Boxes represent the final computed MCMax iteration, usually between 50 and 200. The left solid line connects models with
|
| Open with DEXTER | |
| In the text | |
|
|
Figure B.1:
Radial |
| Open with DEXTER | |
| In the text | |
|
|
Figure B.2:
Midplane dust temperature structures for an MCMax model of the IN05 disc with
|
| Open with DEXTER | |
| In the text | |
Copyright ESO 2009
Current usage metrics show cumulative count of Article Views (full-text article views including HTML views, PDF and ePub downloads, according to the available data) and Abstracts Views on Vision4Press platform.
Data correspond to usage on the plateform after 2015. The current usage metrics is available 48-96 hours after online publication and is updated daily on week days.
Initial download of the metrics may take a while.