| Issue |
A&A
Volume 507, Number 1, November III 2009
|
|
|---|---|---|
| Page(s) | 433 - 439 | |
| Section | The Sun | |
| DOI | https://doi.org/10.1051/0004-6361/200912028 | |
| Published online | 27 August 2009 | |
A&A 507, 433-439 (2009)
Submillimeter and X-ray observations of an X class flare
C. G. Giménez de Castro1 - G. Trottet2 - A. Silva-Valio1 - S. Krucker3 - J. E. R. Costa4 - P. Kaufmann1,5 - E. Correia1,4 - H. Levato6
1 - Centro de Rádio Astronomia e Astrofísica Mackenzie, R.
da Consolação 896, 01302-907, São Paulo, SP, Brazil
,
2 - LESIA, Observatoire de Paris, Section de Meudon, 92195 Meudon,
France
3 - Space Sciences Laboratory, University of California, Berkeley, USA
4 - Instituto Nacional de Pesquisas Espaciais, São José dos Campos,
Brazil
5 - Centro de Componentes Semicondutores, Universidade Estadual de
Campinas, Campinas, Brazil
6 - Complejo Astronómico El Leoncito, CONICET, San Juan, Argentina
Received 10 March 2009 / Accepted 7 July 2009
Abstract
The GOES X1.5 class flare that occurred on August 30, 2002 at
1327:30 UT is one of the few events detected so far at
submillimeter wavelengths. We present a detailed analysis of this flare
combining radio observations from 1.5 to 212 GHz (an upper
limit
of the flux is also provided at 405 GHz) and X-ray. Although
the
observations of radio emission up to 212 GHz indicates that
relativistic electrons with energies of a few MeV were
accelerated, no significant hard X-ray emission was detected by RHESSI
above ![]() 250 keV.
Images at 12-20 and 50-100 keV reveal a very compact, but
resolved, source of about
250 keV.
Images at 12-20 and 50-100 keV reveal a very compact, but
resolved, source of about ![]()
![]() .
EUV TRACE images show a multi-kernel structure suggesting a complex
(multipolar) magnetic
topology. During the peak time the radio spectrum shows an extended
flatness from
.
EUV TRACE images show a multi-kernel structure suggesting a complex
(multipolar) magnetic
topology. During the peak time the radio spectrum shows an extended
flatness from ![]() 7
to 35 GHz. Modeling the optically thin part of the
radio spectrum as gyrosynchrotron emission we obtained the electron
spectrum (spectral index
7
to 35 GHz. Modeling the optically thin part of the
radio spectrum as gyrosynchrotron emission we obtained the electron
spectrum (spectral index ![]() ,
instantaneous number of emitting
electrons). It is shown that in order to keep the expected X-ray
emission from the same emitting electrons below the RHESSI background
at 250 keV, a magnetic field above 500 G is
necessary. On the
other hand, the electron spectrum deduced from radio observations
,
instantaneous number of emitting
electrons). It is shown that in order to keep the expected X-ray
emission from the same emitting electrons below the RHESSI background
at 250 keV, a magnetic field above 500 G is
necessary. On the
other hand, the electron spectrum deduced from radio observations ![]() 50 GHz
is harder than that deduced from
50 GHz
is harder than that deduced from ![]() 70-250 keV
X-ray data, meaning that there must exist a breaking energy around a
few hundred keV. During the decay of the
impulsive phase, a hardening of the X-ray spectrum is observed which is
interpreted as a hardening of the electron distribution spectrum
produced by the diffusion due to Coulomb collisions of the trapped
electrons in a medium
with an electron density of
70-250 keV
X-ray data, meaning that there must exist a breaking energy around a
few hundred keV. During the decay of the
impulsive phase, a hardening of the X-ray spectrum is observed which is
interpreted as a hardening of the electron distribution spectrum
produced by the diffusion due to Coulomb collisions of the trapped
electrons in a medium
with an electron density of
![]() .
.
Key words: Sun: activity - Sun: flares - Sun: radio radiation - Sun: X-rays, gamma rays - Sun: particle emission
1 Introduction
During solar flares, a fraction of the released energy is used to
accelerate
electrons with energies well above 1 MeV. The interaction of these
particles with the magnetic field of the flaring region produces
gyrosynchrotron / synchrotron radiation observed at cm or smaller
wavelengths (see e.g. Pick
& Vilmer 2008; Bastian
et al. 1998, for
reviews) and a bremsstrahlung continuum
caused by Coulomb collisions observed with X- and ![]() -ray
detectors. It was shown (e.g. Kundu
et al. 1994) that the electron
spectrum N(E) determined by
means of
-ray
detectors. It was shown (e.g. Kundu
et al. 1994) that the electron
spectrum N(E) determined by
means of ![]() 30 GHz
radio observations is
harder than that deduced from Hard X-ray (HXR) below a few hundred keV.
However for a few events, the electron spectra were found consistent
with
spectra inferred from
30 GHz
radio observations is
harder than that deduced from Hard X-ray (HXR) below a few hundred keV.
However for a few events, the electron spectra were found consistent
with
spectra inferred from ![]() -ray
continuum above
-ray
continuum above ![]() 1 MeV
(Trottet
et al. 1998,2000).
Since radio emission above 30 GHz is produced mainly by
electrons of a few MeV (see
e.g. Ramaty
et al. 1994; White
& Kundu 1992), these results have an impact on
acceleration mechanism models, which are still, an open question in
solar
flare theory, and reinforces the need for good diagnostics of the
>1 MeV particles.
1 MeV
(Trottet
et al. 1998,2000).
Since radio emission above 30 GHz is produced mainly by
electrons of a few MeV (see
e.g. Ramaty
et al. 1994; White
& Kundu 1992), these results have an impact on
acceleration mechanism models, which are still, an open question in
solar
flare theory, and reinforces the need for good diagnostics of the
>1 MeV particles.
Continuum X- and ![]() -ray
detectors may observe photons from a few keV
up to tens of MeV, but have as a limitation the low
sensitivity and / or
high background in the high energy range. In the past three solar
cycles
only a few tens of flares have been observed above 1 MeV. On
the other
hand, radioastronomy at millimeter and submillimeter wavelengths is
more
efficient than the
-ray
detectors may observe photons from a few keV
up to tens of MeV, but have as a limitation the low
sensitivity and / or
high background in the high energy range. In the past three solar
cycles
only a few tens of flares have been observed above 1 MeV. On
the other
hand, radioastronomy at millimeter and submillimeter wavelengths is
more
efficient than the ![]() -ray
detectors. Routine solar flare observations
at 212 and 405 GHz started in March 2001 with the
Solar Submillimeter
Telescope (SST, Kaufmann
et al. 2001), installed in the Argentinean
Andes. A few flares were also observed at 210, 230, and
345 GHz with a
receiver array installed at the focus of the Köln Observatory for
Submillimeter and Millimeter Astronomy (KOSMA) telescope
(Lüthi
et al. 2004a,b).
The first observations using such
instruments showed that the spectrum above 100 GHz is a
continuation of the
cm-wavelength optically thin spectrum
(e.g. Trottet
et al. 2002; Lüthi
et al. 2004b) and extended the
diagnostic tools of radio observations to higher energy (a few tens of
MeV)
electrons. However, an unexpected upturn of the spectrum above
100 GHz was
reported for other
-ray
detectors. Routine solar flare observations
at 212 and 405 GHz started in March 2001 with the
Solar Submillimeter
Telescope (SST, Kaufmann
et al. 2001), installed in the Argentinean
Andes. A few flares were also observed at 210, 230, and
345 GHz with a
receiver array installed at the focus of the Köln Observatory for
Submillimeter and Millimeter Astronomy (KOSMA) telescope
(Lüthi
et al. 2004a,b).
The first observations using such
instruments showed that the spectrum above 100 GHz is a
continuation of the
cm-wavelength optically thin spectrum
(e.g. Trottet
et al. 2002; Lüthi
et al. 2004b) and extended the
diagnostic tools of radio observations to higher energy (a few tens of
MeV)
electrons. However, an unexpected upturn of the spectrum above
100 GHz was
reported for other ![]() M
class events (e.g. Kaufmann
et al. 2004; Lüthi
et al. 2004a; Cristiani
et al. 2008). The
physical processes responsible for the production of the spectrum
upturn
are still unknown and are a subject of debate
(Trottet
et al. 2008; Silva
et al. 2007; Kaufmann
& Raulin 2006).
M
class events (e.g. Kaufmann
et al. 2004; Lüthi
et al. 2004a; Cristiani
et al. 2008). The
physical processes responsible for the production of the spectrum
upturn
are still unknown and are a subject of debate
(Trottet
et al. 2008; Silva
et al. 2007; Kaufmann
& Raulin 2006).
In this paper, we present a combined analysis of the impulsive phase of the August 30, 2002, X class flare using RHESSI X-ray observations and spatially unresolved radio data covering the range between 1.5 to 212 GHz (and an upper limit for 405 GHz) obtained by different instruments. The event has been analyzed by different authors. Karlický et al. (2004) related radio observations between 0.8 and 2.0 GHz and X-ray spectra and images from RHESSI. They found high-frequency drifting structures between 1327:38 and 1327:50 UT with a global drift of -25 MHz s-1. The 10-20 keV X-ray sources show a north-east displacement with a projected velocity of about 10 km s-1, while the 29-44 keV emission is delayed by about 0.5 to 0.7 s after the radio drifting structure. Microwave observations of a short pulse during the onset of this event was analyzed by Giménez de Castro et al. (2006) who found a strikingly narrow spectrum that was explained as gyrosynchrotron emission of accelerated electrons with a maximum energy (high energy cutoff) of about 250 keV. Another event with similar properties was qualitatively discussed by Lüthi et al. (2004b). In this work we extend the analysis of Giménez de Castro et al. (2006) to the entire event. Moreover, we perform a quantitative analysis of the data which allows us to estimate the characteristics of the emitting electrons (energy spectrum, total number) and of the flaring region (density, magnetic field strength) that are necessary to account for the apparent discrepancy between X-ray and radio observations.
2 Instrumentation
The hard X-ray (HXR) and radio data used in the present analysis of the August 30, 2002 event were obtained with the NASA Reuven Ramaty High Energy Solar Spectroscopic Imager (RHESSI), the Solar Submillimeter Telescope (SST, installed in the Argentinean Andes), the nulling interferometer and patrol telescopes of the University of Bern (Switzerland), the Radio Solar Telescope Network (RSTN), and the Solar Radio-polarimeter of the Radio Observatory of Itapetinga (ROI, Brazil).
RHESSI provides imaging and spectral HXR/![]() -ray observations, with
high spatial (
-ray observations, with
high spatial (![]() 2 arcsec)
and spectral (
2 arcsec)
and spectral (![]() 1 keV)
resolution in
the
1 keV)
resolution in
the ![]() 3 keV-17 MeV
energy range (Lin & et
al. 2002).
3 keV-17 MeV
energy range (Lin & et
al. 2002).
The SST (Kaufmann
et al. 2000) operates simultaneously at 212 and
405 GHz and with a time resolution of 1 ms for the
present event. The focal
system consists of four receivers at 212 GHz and two at
405 GHz. At 212 GHz
this produces a cluster of beams that, in principle, allows us to
determine the centroid of the emitting region whenever an event is
detected
(see Giménez
de Castro et al. 1999, and references therein for
details). During the
August 30, 2002 flare, SST was tracking NOAA
region 10095, with one of the
two 405 GHz beams pointing at the active region. At
212 GHz, the event
was observed with only one beam so that it was not possible to estimate
the
centroid position of the emitting region. The antenna temperatures have
been corrected for atmospheric attenuation (zenith optical depth
![]() nepers and
nepers and ![]() nepers) and converted to
flux density assuming that: (i) the source is much smaller
than the
beam size and; (ii) there is no important main-lobe gain
correction
due to a possible offset pointing. Since the HPBW of the beams are
respectively
nepers) and converted to
flux density assuming that: (i) the source is much smaller
than the
beam size and; (ii) there is no important main-lobe gain
correction
due to a possible offset pointing. Since the HPBW of the beams are
respectively ![]() 4
4
![]() and
2
and
2
![]() at 212 and 405 GHz,
hypothesis (i) is justified here, because this event is very
compact
in the HXR domain (see Sect. 3.2).
On the other hand,
the projected position of the beam that observed the burst in the sky
is
separated by less than 30
at 212 and 405 GHz,
hypothesis (i) is justified here, because this event is very
compact
in the HXR domain (see Sect. 3.2).
On the other hand,
the projected position of the beam that observed the burst in the sky
is
separated by less than 30
![]() from the HXR emitting region observed by
RHESSI. As this is comparable to the absolute position uncertainty of
the
SST antenna, hypothesis; (ii) is also justified. It should be
emphasized that a misalignment of 30
from the HXR emitting region observed by
RHESSI. As this is comparable to the absolute position uncertainty of
the
SST antenna, hypothesis; (ii) is also justified. It should be
emphasized that a misalignment of 30
![]() produces a main-lobe gain
correction of less than 5% at 212 GHz (
produces a main-lobe gain
correction of less than 5% at 212 GHz (
![]() ).
).
![\begin{figure}
\par\includegraphics[width=8cm,clip]{12028-01.eps}
\end{figure}](/articles/aa/full_html/2009/43/aa12028-09/img14.png)
|
Figure 1: Time evolution of the August 30, 2002 flare, at different radio frequencies and in selected SXR and HXR energy channels. At 89.4 and 212 GHz the dashed curve represents the computed contribution of an isothermal source. A, B, and C indicate, respectively, characteristic time bins around the maximum of the HXR emission, the maximum of the 212 GHz radiation, and the decay phase of the burst. Horizontal bars denote the time intervals I through IV (see text). |
| Open with DEXTER | |
The two-element nulling interferometer of the University of Bern
provides
total flux measurements at 89.4 GHz with a sensitivity of ![]() 35 s.f.u.
(1 s.f.u. = 10-22 W m-2 Hz-1)
and a time resolution
of 31 ms (Lüthi
et al. 2004b). Total flux densities at 11.8, 19.6,
35,
and 50 GHz were recorded by the patrol telescopes at Bumishus
(Switzerland)
with a time resolution of 100 ms. Total flux density
measurements made at
1.415, 2.695, 4.995, 8.8, and 15.4 GHz by the RSTN with a time
resolution
of 1 s, and at 7 GHz by the Solar Radio-polarimeter
of the Radio
Observatory of Itapetinga with 20 ms time resolution have also
been used.
35 s.f.u.
(1 s.f.u. = 10-22 W m-2 Hz-1)
and a time resolution
of 31 ms (Lüthi
et al. 2004b). Total flux densities at 11.8, 19.6,
35,
and 50 GHz were recorded by the patrol telescopes at Bumishus
(Switzerland)
with a time resolution of 100 ms. Total flux density
measurements made at
1.415, 2.695, 4.995, 8.8, and 15.4 GHz by the RSTN with a time
resolution
of 1 s, and at 7 GHz by the Solar Radio-polarimeter
of the Radio
Observatory of Itapetinga with 20 ms time resolution have also
been used.
![\begin{figure}
\par\includegraphics[width=8cm,clip]{12028-02.eps}
\end{figure}](/articles/aa/full_html/2009/43/aa12028-09/img15.png)
|
Figure 2: Background subtracted count rate spectra measured by RHESSI (error bars) during time bins A, B, and C marked in Fig. 1. The asterisks show the background spectrum. The continuous lines show the best fit models (see text). The vertical dashed lines indicate the fitted energy range. |
| Open with DEXTER | |
3 Observations and data analysis
The August 30, 2002 HXR and radio event starting at ![]() 1327:30 UT
is
associated with a GOES X1.5 SXR burst and, with a surprisingly small,
H
1327:30 UT
is
associated with a GOES X1.5 SXR burst and, with a surprisingly small,
H![]() sub-flare which occurred in NOAA Active Region 10095 (N15
E74). This event was observed by RHESSI up to
sub-flare which occurred in NOAA Active Region 10095 (N15
E74). This event was observed by RHESSI up to ![]() 250 keV around its
maximum and in a large part of the radio spectrum ranging from
submillimeter to decameter and longer wavelengths. Figure 1
displays the time profile of the event in the 100-150 keV HXR
band, in the SXR 1-8 Å channel; it also shows the total flux
densities at 11.8, 89.4, and 212 GHz. The flare comprises an
impulsive
phase that starts at
250 keV around its
maximum and in a large part of the radio spectrum ranging from
submillimeter to decameter and longer wavelengths. Figure 1
displays the time profile of the event in the 100-150 keV HXR
band, in the SXR 1-8 Å channel; it also shows the total flux
densities at 11.8, 89.4, and 212 GHz. The flare comprises an
impulsive
phase that starts at ![]() 1327:40 UT
in the 100-150 keV band and which
lasts for about 60 s.
1327:40 UT
in the 100-150 keV band and which
lasts for about 60 s.
3.1 Flux and spectra
3.1.1 Hard X-rays
![\begin{figure}
\par\includegraphics[width=8cm,clip]{12028-03.eps}
\end{figure}](/articles/aa/full_html/2009/43/aa12028-09/img16.png)
|
Figure 3:
From top to bottom: time evolution of the HXR
spectral index |
| Open with DEXTER | |
Spectral analysis of RHESSI data was performed between 1327:28
and
1328:36 UT. Count rate spectra were accumulated between
1327:38
and
1327:44 UT (before the thick shutter came in) and in all 4
second
intervals
between 1327:52 and 1328:32 UT using front detectors
1, 3-6,
8 and 9. We
applied pile up and decimation corrections. Each spectra consists of
77 energy bands between 3 and 250 keV. For each
interval,
spectral fitting was
carried out for energies ranging from 40 keV to the highest
energy
where
count rates in excess of 2![]() above background are measured. It is
found that the count rate spectra could be reasonably represented by
considering either a single power law or a double power-law. In the
latter
case, the break energy lies around 70 keV. Since we are
interested
in the
non-thermal X-ray emission, we have restricted the analysis to the
energies above 70 keV using a single power-law of spectral
index
above background are measured. It is
found that the count rate spectra could be reasonably represented by
considering either a single power law or a double power-law. In the
latter
case, the break energy lies around 70 keV. Since we are
interested
in the
non-thermal X-ray emission, we have restricted the analysis to the
energies above 70 keV using a single power-law of spectral
index ![]() for the trial photon spectra. Figure 2 displays
examples of the fitted spectra for the time bins labeled A, B, and C in
Fig. 1.
The time evolution of
for the trial photon spectra. Figure 2 displays
examples of the fitted spectra for the time bins labeled A, B, and C in
Fig. 1.
The time evolution of ![]() is shown in Fig. 3.
is shown in Fig. 3.
3.1.2 Radio
![\begin{figure}
\par\includegraphics[width=8cm,clip]{12028-04.eps}
\end{figure}](/articles/aa/full_html/2009/43/aa12028-09/img18.png)
|
Figure 4: The radio spectrum at instants labeled A, B, and C. (see Fig. 1) Solid curves represent the homogeneous gyrosynchrotron solution fits discussed in Sect. 4.3. |
| Open with DEXTER | |
At frequencies above 20 GHz there is a time extended emission
that lasts
for tens of minutes after the impulsive phase (see Fig. 1
at 89.4 and 212 GHz). This gradual component is most likely of
thermal
origin because it seems to follow the SXR emission from GOES and has no
HXR
counterpart. The comparison of the >20 GHz time
evolution with that of
the 1-8 Å SXR indicates that this thermal component may have
started
at the beginning of the impulsive phase and therefore should be
subtracted
from the total flux densities in order to estimate the non thermal
emission
of the radio burst. For this we consider that the thermal emission
arises
from the hot thermal source that produces the SXR emission observed by
GOES. We computed the free-free flux density of an isothermal source
with
temperature and emission measure (EM) derived from GOES 8
observations. A
source size of 60
![]() provides a reasonable agreement with the observations
as illustrated in Fig. 1
(dot-dash lines at 89.4 and 212 GHz curves). Figure 4 shows
the non-thermal radio spectrum
for the three time bins marked A, B and C in Fig. 1 that
correspond, respectively, to the maximum of the 100-150 keV
emission, to the
maximum of the 212 GHz, and to the decay of the impulsive
phase. The main
characteristics of the radio spectra can be summarized as follows:
provides a reasonable agreement with the observations
as illustrated in Fig. 1
(dot-dash lines at 89.4 and 212 GHz curves). Figure 4 shows
the non-thermal radio spectrum
for the three time bins marked A, B and C in Fig. 1 that
correspond, respectively, to the maximum of the 100-150 keV
emission, to the
maximum of the 212 GHz, and to the decay of the impulsive
phase. The main
characteristics of the radio spectra can be summarized as follows:
- from 1 to 7 GHz:
- the spectrum increases with frequency and can be
represented by a power law with spectral index
 1;
1; - from 7 to 35 GHz:
- there is a plateau observed during the impulsive phase (Fig. 4A, B). During the decay of the impulsive phase the spectrum gradually evolves exhibiting a rather well defined turnover frequency around 5 GHz (Fig. 4C);
- above 50 GHz:
- the flux density is roughly proportional to
 .
Figure 3
shows the time evolution of
.
Figure 3
shows the time evolution of  .
.
3.2 HXR images
![\begin{figure}
\par\includegraphics[width=8cm,clip]{12028-05.eps}
\end{figure}](/articles/aa/full_html/2009/43/aa12028-09/img21.png)
|
Figure 5: RHESSI emitting regions of 50-100 keV (solid contours) and of 12-20 keV (dashed contours) for different time intervals superimposed on a negative 195 Å image taken by TRACE at 1327:31 UT. Contour levels are: 50, 70, 90, and 99% of the image maximum. |
| Open with DEXTER | |
Figure 5
displays RHESSI contours in the 12-20 keV and
50-100 keV bands overlaid on a 195 Å TRACE image
taken at 1327:31 UT
for the four intervals marked by horizontal bars in Fig. 1.
Intervals I and II cover the first two
100-150 keV
peaks, interval III spreads over the maximum of the 212 GHz,
while
interval IV extends over the HXR decay phase. RHESSI images were
obtained
by applying the PIXON algorithm (Metcalf
et al. 1996) and by using front
detector segments 1 to 6. Detector 2 was not used for the
12-20 keV
images. The TRACE image was taken close to the onset of the radio and
HXR
impulsive peaks. The figure shows that the impulsive phase of the flare
was
triggered within a complex pattern of bright EUV features in a compact
region
(10
![]()
![]() 10
10
![]() ).
Unfortunately, subsequent 195 Å TRACE
images are saturated until 1350 UT. During
intervals I and
II, the 50-100 keV emission (solid contours) arises from two
compact regions (
).
Unfortunately, subsequent 195 Å TRACE
images are saturated until 1350 UT. During
intervals I and
II, the 50-100 keV emission (solid contours) arises from two
compact regions (![]() 3-7
3-7
![]() )
overlaying bright EUV structures. During the rest of the event
(intervals III to IV), only the southeast source is observed
at
50-100 keV. During the whole event the lower energy HXR
(12-20 keV, dashed
contours) arise predominantly from a single source close to the
southeast
of the 50-100 keV emitting region. However, the interpretation
of
the HXR images at 50 keV for interval III
and IV is
inconclusive as up to half of the counts are due to pile up of thermal
photons. To correct pile up in images is very difficult as the
corrections should be done in the modulated light curves. Currently,
the RHESSI software does not provide pile up correction in images.
)
overlaying bright EUV structures. During the rest of the event
(intervals III to IV), only the southeast source is observed
at
50-100 keV. During the whole event the lower energy HXR
(12-20 keV, dashed
contours) arise predominantly from a single source close to the
southeast
of the 50-100 keV emitting region. However, the interpretation
of
the HXR images at 50 keV for interval III
and IV is
inconclusive as up to half of the counts are due to pile up of thermal
photons. To correct pile up in images is very difficult as the
corrections should be done in the modulated light curves. Currently,
the RHESSI software does not provide pile up correction in images.
4 Discussion
EUV observations close to the onset of the impulsive phase of the
August
30, 2002 event reveal that this flare arose from a compact region with
a
multi kernel structure that suggests a complex (multipolar) magnetic
field
topology. The HXR emitting sources are observed in association with
different EUV bright structures, suggesting that they are located at
the
footpoints of different magnetic loops (see Fig. 5). The
compactness of this flare is further supported by the fact that such an
X class event produced only an H![]() sub-flare. In the following, we
discuss some peculiarities of this HXR and radio event:
sub-flare. In the following, we
discuss some peculiarities of this HXR and radio event:
- the unusually flat radio spectrum between 7 and 35 GHz during most of the impulsive phase (intervals I to III on Fig. 1);
- the lack of significant
 ray emission detected by RHESSI in the MeV domain, although
  90 GHz
radio data indicate that relativistic electrons were produced during
the flare;
90 GHz
radio data indicate that relativistic electrons were produced during
the flare; - the strong hardening of the >70 keV HXR spectrum during the decay of the impulsive phase.
- during intervals I and II, the 100-150 keV emission is consistent with thick-target emission because it arises predominantly from footpoint sources. Furthermore there is no long-term coronal trapping because the HXR peaks occur simultaneously at all energies within the RHESSI time resolution (4 s). Thus, the time evolution of the HXR emission mimics that of the electron injection into the thick-target region;
- taking into account the above arguments, interval III corresponds to a third injection which is reflected by the shoulder in the 100-150 keV time profile range and corresponds to the maximum of the 212 GHz emission;
- the hardening of the HXR spectrum during interval IV may be indicative of some trapping.
4.1 The flat radio spectrum
It is well documented that cm-mm emission comes from gyrosynchrotron radiation of energetic relativistic electrons propagating in the magnetic structures (e.g. Pick & Vilmer 2008, and references therein). The radio spectra of the present event are indeed reminiscent of this emission process. In a uniform magnetic field, the emission would lead to a spectral index larger than 2.5 in the optically thick region and a rather well defined turnover frequency. However, the spectral index for the frequency range 1-7 GHz (optically thick emission) remains around or below 1 during the whole event. And until the decay of the impulsive phase (interval IV) the radio spectrum is flat between 7 and 35 GHz (see Fig. 4). Both these characteristics are indications that radio emitting electrons propagate in a highly inhomogeneous magnetic field (e.g. Klein et al. 1986; Lee et al. 1994; Dulk 1985). This inhomogeneous magnetic field interpretation is consistent with the complex magnetic structure revealed by TRACE and RHESSI images. During the decay of the impulsive phase, a well defined turnover frequency gradually becomes better defined. At the same time, the X-ray emission arises from a single source, so that the observed radio spectrum is closer to that expected from a homogeneous source.
Ramaty
& Petrosian (1972) explained flat microwave spectra
as observed
by Hachenberg
& Wallis (1961) by including the free-free absorption
of a cold
medium uniformly mixed in the homogeneous gyrosynchrotron source
region.
Indeed: (i) at low frequencies, where both gyrosynchrotron and
free-free
opacities are >1, the radio flux increases with frequency;
(ii) at
frequencies for which the gyrosynchrotron opacity is <1 while
the free-free
opacity remains >1, a plateau is observed because while the
gyrosynchrotron emission starts to decrease the free-free emission is
still
increasing; (iii) at higher frequencies both emissions are optically
thin and
the radio spectrum decreases with frequency.
The observation of simultaneous brightenings and line broadening of
hot (![]() 107 K)
and cold (
107 K)
and cold (![]() 104 K)
plasmas during a solar limb
flare (Kliem
et al. 2002) provides some support to the Ramaty
&
Petrosian hypothesis. In addition to magnetic field inhomogeneities,
free-free absorption may also contribute to provide the observed flat
radio
spectrum. In that case, as the flare evolves, the free-free opacity
should
decrease in order to allow lower frequency radiation to become
optically
thin. Since free-free opacity is proportional to
104 K)
plasmas during a solar limb
flare (Kliem
et al. 2002) provides some support to the Ramaty
&
Petrosian hypothesis. In addition to magnetic field inhomogeneities,
free-free absorption may also contribute to provide the observed flat
radio
spectrum. In that case, as the flare evolves, the free-free opacity
should
decrease in order to allow lower frequency radiation to become
optically
thin. Since free-free opacity is proportional to ![]() (
(
![]() medium density and temperature, respectively, and assuming
medium density and temperature, respectively, and assuming ![]() ),
this would imply either a decrease of the density, or an increase of
the temperature, or an increase of both. In the latter case the
temperature
should increase faster than the density.
),
this would imply either a decrease of the density, or an increase of
the temperature, or an increase of both. In the latter case the
temperature
should increase faster than the density.
Above 50 GHz (optically thin emission), the radiation, which
is mostly emitted
by highly relativistic electrons, is not affected by
the medium, and the spectral radio index ![]() is only related to the
index of the instantaneous electron distribution
is only related to the
index of the instantaneous electron distribution ![]() .
For the present
event
.
For the present
event ![]() remains between 1.1 and 1.3 (Fig. 3).
Considering the ultra-relativistic case as a gross approximation, this
leads to
remains between 1.1 and 1.3 (Fig. 3).
Considering the ultra-relativistic case as a gross approximation, this
leads to ![]() (Dulk 1985).
(Dulk 1985).
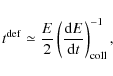
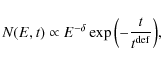
4.2 HXR spectral hardening during the decay of the impulsive phase
During interval IV the HXR spectral index ![]() decreases from 4.1 to 2.8
(Fig. 3).
This provides some indication that a significant
amount of HXR was produced by trapped electrons, the diffusion rate
being
governed by Coulomb collisions. For the weak-diffusion limit case, the
trapping time
decreases from 4.1 to 2.8
(Fig. 3).
This provides some indication that a significant
amount of HXR was produced by trapped electrons, the diffusion rate
being
governed by Coulomb collisions. For the weak-diffusion limit case, the
trapping time ![]() ,
with
,
with ![]() the characteristic deflection time, which is given by Trubnikov (1965)
and
Melrose
& Brown (1976)
the characteristic deflection time, which is given by Trubnikov (1965)
and
Melrose
& Brown (1976)
|
(1) |
where
|
(2) |
with E the electron energy in keV and
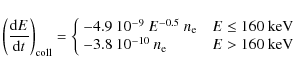
We consider that the injection of electrons in the HXR
emitting region
stopped at 1328:14 UT because it is the last time bin where ![]() remains
almost constant (see Fig. 3). Under
these conditions
the time evolution of the distribution of the trapped electrons is
approximately given by (Aschwanden 1998)
remains
almost constant (see Fig. 3). Under
these conditions
the time evolution of the distribution of the trapped electrons is
approximately given by (Aschwanden 1998)
|
(3) |
with
where v(E) is the electron velocity corresponding to energy E,
Spectral hardening has been reported during the impulsive phase of long duration GOES X class flares and associated with non thermal footpoint bremsstrahlung (Qiu et al. 2004; Saldanha et al. 2008). Grigis & Benz (2008) analyzed the spectral hardening during the gradual phase of great flares and concluded that the cause is the continuing acceleration with longer trapping in the accelerator before escape. Kiplinger (1995) has shown that the hardening is associated with SEP events.
4.3 Relationship between HXR and radio emission
The absence of HXR emission >250 keV while we observe
radio emission
above 50 GHz can be used to constrain the high energy electron
distribution, the magnetic field, and the trapping time in the radio
emitting region. For that, we consider that non thermal electrons are
injected in coronal loops. The radio emission is produced in the
coronal
portion of these loops where they become partially trapped while
precipitating electrons produce the HXR radiation by thick target
interaction at the loop footpoints. Since no spatially resolved radio
data
are available for this event and the optically thin part of the radio
spectrum does not depend on the structure details of the medium, we
used a homogeneous model to derive the mean parameters of the radio
source
and emitting electrons. For that, we computed the radio optically thin
emission by using the numerical code for a gyrosynchrotron source with
a
homogeneous ambient density and magnetic field and an isotropic
electron
distribution developed by Ramaty (1969)
and corrected by
Ramaty
et al. (1994)![]() .
The instantaneous electron
distribution in the radio source was taken as
.
The instantaneous electron
distribution in the radio source was taken as ![]() ,
where
K is the number of electrons per MeV at
1 MeV and the energy E is in
MeV. The angle between the observer and the magnetic field (view-angle)
was
set to 84
,
where
K is the number of electrons per MeV at
1 MeV and the energy E is in
MeV. The angle between the observer and the magnetic field (view-angle)
was
set to 84![]() (the maximum allowed value in Ramaty's solution) in order
to obtain the lower limit of the total number of electrons necessary to
produce a given radio spectrum for a given magnetic field strength. For
a
view-angle of 45
(the maximum allowed value in Ramaty's solution) in order
to obtain the lower limit of the total number of electrons necessary to
produce a given radio spectrum for a given magnetic field strength. For
a
view-angle of 45![]() ,
as is usually assumed, the computed number of
electrons is roughly twice that obtained for 84
,
as is usually assumed, the computed number of
electrons is roughly twice that obtained for 84![]() .
Table 1
displays the values of the instantaneous total number of electrons
above 25 keV
.
Table 1
displays the values of the instantaneous total number of electrons
above 25 keV ![]() and K obtained for different values of the
magnetic field at the maximum of the 100-150 keV HXR (time bin
A) .
and K obtained for different values of the
magnetic field at the maximum of the 100-150 keV HXR (time bin
A) . ![]() was computed for
was computed for ![]() which provides the best
fit to the radio data. This is in agreement with the value of
which provides the best
fit to the radio data. This is in agreement with the value of ![]() inferred from the slope of the optically thin part of the radio
spectrum
inferred from the slope of the optically thin part of the radio
spectrum ![]() (see Sect. 4.1).
(see Sect. 4.1).
Table
1:
Derived characteristic of radio radiating electrons for different
magnetic field strengths and view angle equal to 84![]() .
.
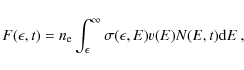
The mean electron flux ![]() entering the thick target HXR
source is
entering the thick target HXR
source is ![]() ,
where
,
where ![]() is the
time spent by the electrons in the radio source. The thick target
photon emission from these precipitating electrons was calculated by
using a numerical code that takes into account both electron-proton
and electron-electron collisions. The photon spectrum is then
convolved with the RHESSI response matrix to get the corresponding
count rate spectrum. Figure 1 shows
that within the RHESSI
time resolution (4 s), the 89.4 GHz, 212 GHz
and 100-150 keV count rates show simultaneous peaks during
intervals I to III. The electron trapping time
is the
time spent by the electrons in the radio source. The thick target
photon emission from these precipitating electrons was calculated by
using a numerical code that takes into account both electron-proton
and electron-electron collisions. The photon spectrum is then
convolved with the RHESSI response matrix to get the corresponding
count rate spectrum. Figure 1 shows
that within the RHESSI
time resolution (4 s), the 89.4 GHz, 212 GHz
and 100-150 keV count rates show simultaneous peaks during
intervals I to III. The electron trapping time ![]() can thus be considered independent of energy as a first approximation.
This suggest that during intervals I to III the
precipitation rate is more likely governed by wave-particle
interactions (turbulent trapping) than by Coulomb collisions (e.g. Vilmer 1987).
The computations were then carried out for
can thus be considered independent of energy as a first approximation.
This suggest that during intervals I to III the
precipitation rate is more likely governed by wave-particle
interactions (turbulent trapping) than by Coulomb collisions (e.g. Vilmer 1987).
The computations were then carried out for ![]() ,
the lower and upper limits correspond respectively to free streaming of
the electrons in a compact loop (
,
the lower and upper limits correspond respectively to free streaming of
the electrons in a compact loop (![]() 10
10
![]() ), and to the RHESSI time
resolution. Figure 6
displays the RHESSI expected count rates in the 250-265 keV
band as a function of
), and to the RHESSI time
resolution. Figure 6
displays the RHESSI expected count rates in the 250-265 keV
band as a function of ![]() for
different values of the magnetic field. The dashed horizontal line
corresponds to the RHESSI count rate in this channel, the highest
energy where this event
was detected. We conclude that the mean magnetic field strength
should be greater than about 500 G to keep the thick target
photon
flux
expected from radio emitting electrons with trapping times smaller
than 1 s below the detection limit of RHESSI.
for
different values of the magnetic field. The dashed horizontal line
corresponds to the RHESSI count rate in this channel, the highest
energy where this event
was detected. We conclude that the mean magnetic field strength
should be greater than about 500 G to keep the thick target
photon
flux
expected from radio emitting electrons with trapping times smaller
than 1 s below the detection limit of RHESSI.
![\begin{figure}
\par\includegraphics[width=6cm,clip]{12028-06.eps}
\end{figure}](/articles/aa/full_html/2009/43/aa12028-09/img51.png)
|
Figure 6: Expected
RHESSI
count rates at 250 keV as a function of the emitting electron
trapping time for different magnetic field strengths
and view angle equal to 84 |
| Open with DEXTER | |
It has been shown that the thick target spectral index ![]() is bounded
between
is bounded
between ![]() ,
the lower limit
corresponding to turbulent trapping of electrons with energies above a
few
100 keV, whereas the higher limit is set by free propagating
electrons with
energies below a few 100 keV (see e.g. Trottet
et al. 1998, and references
therein.). Therefore if
,
the lower limit
corresponding to turbulent trapping of electrons with energies above a
few
100 keV, whereas the higher limit is set by free propagating
electrons with
energies below a few 100 keV (see e.g. Trottet
et al. 1998, and references
therein.). Therefore if ![]() ,
the HXR emission
of these electrons should have an index between
,
the HXR emission
of these electrons should have an index between ![]() which
is significantly smaller than the observed values,
which
is significantly smaller than the observed values, ![]() 4.3, during
intervals I to III (see Fig. 3). This is
in accordance with
previous works that show that radio high frequency emission is
generated by
electrons with energies above
4.3, during
intervals I to III (see Fig. 3). This is
in accordance with
previous works that show that radio high frequency emission is
generated by
electrons with energies above ![]() 500 keV with an electron index harder
than the <500 keV electrons (Trottet
et al. 1998; Silva
et al. 2000; White &
Kundu 1992; Kundu
et al. 1994).
500 keV with an electron index harder
than the <500 keV electrons (Trottet
et al. 1998; Silva
et al. 2000; White &
Kundu 1992; Kundu
et al. 1994).
5 Summary
In this paper we have analyzed X-ray observations from RHESSI and radio data obtained at submillimeter wavelengths by the Solar Submillimeter Telescope (SST) of the X1.5 event that occurred in Active Region 10095 on August 30, 2002, at 1327:30 UT, complemented with radio observations from 1.5 to 89.4 GHz from other instruments. EUV images from TRACE provided information about the source emitting region.
The radio spectrum above 100 GHz is the continuation of the optically thin microwave spectrum, therefore does not belong to the so called THz bursts (Kaufmann et al. 2004), although it is an X Class flare. We summarize below our main findings:
- The magnetic structure of the flare is complex and highly inhomogeneous. This is revealed by the 50-100 keV and EUV images. Such an inhomogeneous source may produce the flatness in the radio spectrum observed between 7 and 35 GHz, although we do not discard the free-free absorption.
- The electron spectrum N(E) above 1 MeV is harder than that at energies below a few hundred keV.
- Modeling simultaneously the expected RHESSI count rate and the expected gyrosynchrotron emission, we obtain 500 G as a lower limit for the mean magnetic field of the flaring region.
- The time evolution of the spectral index deduced from X-ray
observations at the end of interval III suggests that trapped
electrons are diffused by Coulomb collisions. This leads to a mean
ambient electron density of
 cm-3,
typical of the low corona / upper chromosphere and is compatible with
previous results (Krucker
et al. 2008) and with the small size of the EUV
pattern observed by TRACE, which also suggests that the flaring region
does not extend high in the corona.
cm-3,
typical of the low corona / upper chromosphere and is compatible with
previous results (Krucker
et al. 2008) and with the small size of the EUV
pattern observed by TRACE, which also suggests that the flaring region
does not extend high in the corona.
This research was partially supported by Brazil Agencies FAPESP, CNPq and Mackpesquisa, and Argentina Agency CONICET. CGGC also thanks the Observatory of Paris in Meudon, that supported his stay to finish the present work. The authors are in debt to A. Magun and T. Lüthi who provided the calibrated data of the Bern patrol telescopes and of the nulling interferometer at 89.4 GHz. They would also like to thank Dr. Lidia van Driel-Gesztelyi for helpful discussions.
References
- Aschwanden, M. J. 1998, ApJ, 502, 455 [CrossRef] [NASA ADS]
- Bai, T., & Ramaty, R. 1979, ApJ, 227, 1072 [CrossRef] [NASA ADS]
- Bastian, T. S., Benz, A. O., & Gary, D. E. 1998, ARA&A, 36, 131 [CrossRef] [NASA ADS]
- Brown, J. C. 1971, Sol. Phys., 18, 489 [CrossRef] [NASA ADS]
- Cristiani, G., Giménez de Castro, C. G., Mandrini, C. H., et al. 2008, A&A, 492, 215 [EDP Sciences] [CrossRef] [NASA ADS]
- Dulk, G. A. 1985, ARA&A, 23, 169 [CrossRef] [NASA ADS]
- Giménez de Castro, C. G., Raulin, J. P., Makhmutov, V. S., Kaufmann, P., & Costa, J. E. R. 1999, A&AS, 140, 373 [EDP Sciences] [CrossRef] [NASA ADS]
- Giménez de Castro, C. G., Costa, J. E. R., Silva, A. V. R., et al. 2006, A&A, 457, 693 [EDP Sciences] [CrossRef] [NASA ADS]
- Grigis, P. C., & Benz, A. O. 2008, ApJ, 683, 1180 [CrossRef] [NASA ADS]
- Hachenberg, O., & Wallis, G. 1961, Z. Astrophys., 52, 42 [NASA ADS]
- Karlický, M., Fárník, F., & Krucker, S. 2004, A&A, 419, 365 [EDP Sciences] [CrossRef] [NASA ADS]
- Kaufmann, P., & Raulin, J.-P. 2006, Phys. Plasmas, 13, 701 [CrossRef]
- Kaufmann, P., Costa, J. E. R., Correia, E., et al. 2000, in High Energy Solar Physics Workshop - Anticipating Hessi, ed. R. Ramaty, & N. Mandzhavidze, 318, ASP Conf. Ser., 206
- Kaufmann, P., Costa, J. E. R., Giménez de Castro, C. G., et al. 2001, in Proc. of the SBMO/IEEE MTT-S International Microwave and Optoelectronics Conference, 439
- Kaufmann, P., Raulin, J. P., de Castro, C. G. G., et al. 2004, ApJ, 603, L121 [CrossRef] [NASA ADS]
- Kiplinger, A. L. 1995, ApJ, 453, 973 [CrossRef] [NASA ADS]
- Klein, K.-L., Trottet, G., & Magun, A. 1986, Sol. Phys., 104, 243 [CrossRef] [NASA ADS]
- Kliem, B., Dammasch, I. E., Curdt, W., et al. 2002, ApJ, 568, L61 [CrossRef] [NASA ADS]
- Krucker, S., Hurford, G. J., MacKinnon, A. L., Shih, A. Y., & Lin, R. P. 2008, ApJ, 678, L63 [CrossRef] [NASA ADS]
- Kundu, M. R., White, S. M., Gopalswamy, N., et al. 1994, ApJS, 90, 599 [CrossRef] [NASA ADS]
- Lüthi, T., Lüdi, A., & Magun, A. 2004a, A&A, 420, 361 [EDP Sciences] [CrossRef] [NASA ADS]
- Lüthi, T., Magun, A., & Miller, M. 2004b, A&A, 415, 1123 [EDP Sciences] [CrossRef] [NASA ADS]
- Lee, J. W., Gary, D. E., & Zirin, H. 1994, Sol. Phys., 152, 409 [CrossRef] [NASA ADS]
- Lin, R. P., Dennis, B. R., Hurford, G. J., et al. 2002, Sol. Phys., 210, 3 [CrossRef] [NASA ADS]
- Melrose, D. B., & Brown, J. C. 1976, MNRAS, 176, 15 [NASA ADS]
- Metcalf, T. R., Hudson, H. S., Kosugi, T., Puetter, R. C., & Pina, R. K. 1996, ApJ, 466, 585 [CrossRef] [NASA ADS]
- Pick, M., & Vilmer, N. 2008, A&A Rev., 6
- Qiu, J., Lee, J., & Gary, D. E. 2004, ApJ, 603, 335 [CrossRef] [NASA ADS]
- Ramaty, R. 1969, ApJ, 158, 753 [CrossRef] [NASA ADS]
- Ramaty, R., & Petrosian, V. 1972, ApJ, 178, 241 [CrossRef] [NASA ADS]
- Ramaty, R., Schwartz, R. A., Enome, S., et al. 1994, ApJ, 436, 941 [CrossRef] [NASA ADS]
- Saldanha, R., Krucker, S., & Lin, R. P. 2008, ApJ, 673, 1169 [CrossRef] [NASA ADS]
- Silva, A. V. R., Wang, H., & Gary, D. E. 2000, ApJ, 545, 1116 [CrossRef] [NASA ADS]
- Silva, A. V. R., Share, G. H., Murphy, R. J., et al. 2007, Sol. Phys., 245, 311 [CrossRef] [NASA ADS]
- Trottet, G., Vilmer, N., Barat, C., et al. 1998, A&A, 334, 1099 [NASA ADS]
- Trottet, G., Rolli, E., Magun, A., et al. 2000, A&A, 356, 1067 [NASA ADS]
- Trottet, G., Raulin, J. P., Kaufmann, P., et al. 2002, A&A, 381, 694 [EDP Sciences] [CrossRef] [NASA ADS]
- Trottet, G., Krucker, S., Lüthi, T., et al. 2008, ApJ, 678, 509 [CrossRef] [NASA ADS]
- Trubnikov, B. A. 1965, Rev. Plasma Phys., 1, 105 [NASA ADS]
- Vilmer, N. 1987, Sol. Phys., 111, 207 [CrossRef] [NASA ADS]
- White, S. M., & Kundu, M. R. 1992, Sol. Phys., 141, 347 [CrossRef] [NASA ADS]
Footnotes
Copyright ESO 2009All Tables
Table
1: Derived characteristic of radio radiating electrons for
different magnetic field strengths and view angle equal to 84![]() .
.
Current usage metrics show cumulative count of Article Views (full-text article views including HTML views, PDF and ePub downloads, according to the available data) and Abstracts Views on Vision4Press platform.
Data correspond to usage on the plateform after 2015. The current usage metrics is available 48-96 hours after online publication and is updated daily on week days.
Initial download of the metrics may take a while.