| Issue |
A&A
Volume 507, Number 3, December I 2009
|
|
|---|---|---|
| Page(s) | 1531 - 1539 | |
| Section | Stellar structure and evolution | |
| DOI | https://doi.org/10.1051/0004-6361/200811418 | |
| Published online | 01 October 2009 | |
A&A 507, 1531-1539 (2009)
The origin of the supersoft X-ray-optical/UV flux anticorrelation in the symbiotic binary AG Draconis
A. Skopal1 - M. Sekerás1 - R. González-Riestra2 - R. F. Viotti3
1 - Astronomical Institute, Slovak Academy of Sciences,
059 60 Tatranská Lomnica, Slovakia
2 -
XMM Science Operations Centre, ESAC, PO Box 78,
28691 Villanueva de la Cañada, Madrid, Spain
3 -
INAF Instituto di Astrofisica Spaziale e Fisica Cosmica
di Roma, via del Fosso del Cavaliere 100, 00133 Roma, Italy
Received 25 November 2008 / Accepted 27 August 2009
Abstract
Context. AG Draconis produces a strong supersoft X-ray
emission. The X-ray and optical/UV fluxes are in strict anticorrelation
throughout the active and quiescent phases.
Aims. We identify the source of the X-ray emission and reveal the nature of the observed flux anticorrelation.
Methods. We used X-ray and UV observations with XMM-Newton, far-UV spectroscopy from FUSE, low- and high-resolution IUE spectra,
and optical/near-IR spectroscopic and/or photometric observations. We
modeled the spectral energy distribution and broad wings of the O VI
![]() and He II
and He II ![]() 1640 lines
by the electron-scattering during the maximum of the 2003 burst, and
the subsequent transition and quiescent phase.
1640 lines
by the electron-scattering during the maximum of the 2003 burst, and
the subsequent transition and quiescent phase.
Results. The X-ray-near-IR energy distribution at different
levels of the star's brightness confirmed the observed flux
anticorrelation quantitatively and showed that the optical bursts are
associated to an increase in the nebular component of radiation. The
profile-fitting analysis revealed a significant increase in the mean
particle density around the hot star from ![]()
![]() cm-3 during quiescent phase to
cm-3 during quiescent phase to ![]()
![]() cm-3 during the burst.
cm-3 during the burst.
Conclusions. The supersoft X-ray emission is produced by the
white dwarf photosphere. The X-ray and far-UV fluxes make it possible
to determine its temperature unambiguously. The supersoft
X-ray-optical/UV flux anticorrelation is caused by the variable wind
from the hot star. The enhanced hot star wind gives rise to the optical
bursts by reprocessing high-energy photons from the Lyman continuum to
the optical/UV.
Key words: stars: binaries: symbiotic - stars: fundamental parameters - X-rays: binaries - X-rays: individuals: AG Draconis
1 Introduction
Symbiotic stars are long-period (orbital periods are on the order
of years) interacting binaries consisting of a cool giant and
a compact star, which is in most cases a white dwarf (WD) that
accretes from the giant's wind.
This process generates a very hot (
![]() K)
and luminous (
K)
and luminous (
![]()
![]() )
source of
radiation, which ionizes a fraction of the neutral wind from
the giant giving rise to nebular emission. As a result,
the spectrum of symbiotic stars has three basic components of
radiation, two stellar and one nebular
(see e.g. Mürset et al. 1991; Skopal 2005; Kenyon & Webbink 1984; Seaquist et al. 1984).
This situation represents the so-called quiescent phase,
during which the symbiotic system releases its energy approximately
at a constant rate and at a stable spectral energy
distribution (SED).
Sometimes, the symbiotic system changes its radiation significantly,
brightens up by 1-3 mag in the optical, shows signatures
of a mass outflow, and changes its ionization structure for a few
months to years
(see e.g. Skopal 2005; Corradi et al. 2003; Viotti et al. 1984, and references therein).
We call this stage the active phase, and the corresponding
brightening in the light curve is classified as the ``Z And-type''
outburst. Occurrence of these outbursts is unpredictable, and
their nature is so far poorly understood
(e.g. Sect. 1 in Sokoloski et al. 2006).
Investigation of this type of outburst represents
the key problem in the research of symbiotic stars.
)
source of
radiation, which ionizes a fraction of the neutral wind from
the giant giving rise to nebular emission. As a result,
the spectrum of symbiotic stars has three basic components of
radiation, two stellar and one nebular
(see e.g. Mürset et al. 1991; Skopal 2005; Kenyon & Webbink 1984; Seaquist et al. 1984).
This situation represents the so-called quiescent phase,
during which the symbiotic system releases its energy approximately
at a constant rate and at a stable spectral energy
distribution (SED).
Sometimes, the symbiotic system changes its radiation significantly,
brightens up by 1-3 mag in the optical, shows signatures
of a mass outflow, and changes its ionization structure for a few
months to years
(see e.g. Skopal 2005; Corradi et al. 2003; Viotti et al. 1984, and references therein).
We call this stage the active phase, and the corresponding
brightening in the light curve is classified as the ``Z And-type''
outburst. Occurrence of these outbursts is unpredictable, and
their nature is so far poorly understood
(e.g. Sect. 1 in Sokoloski et al. 2006).
Investigation of this type of outburst represents
the key problem in the research of symbiotic stars.
AG Dra is a yellow symbiotic binary comprising a K2 III giant
(Mürset & Schmid 1999) and a WD accreting from the giant's wind on
a 549-day orbit (Fekel et al. 2000). The light curve of AG Dra shows
numerous bursts with amplitude of 1-3 mag in U (Fig. 1).
González-Riestra et al. (1999) identified cool and hot outbursts
differing in their Zanstra temperatures and the light curve
profile. The former are more pronounced
(
![]() mag) lasting for 1-2 years
(e.g. 1981-83, 2006-07), while the latter are weaker
(
mag) lasting for 1-2 years
(e.g. 1981-83, 2006-07), while the latter are weaker
(
![]() mag), single brightenings lasting for
weeks to months (e.g. 1985, 1986, 2003, see Fig. 1).
Modeling the UV/IR continuum, Skopal (2005) found a significant
contribution from the nebula in the near-UV/optical that
strengthens during outbursts.
The symbiotic nebula in AG Dra is dense. Material supplied by
the giant's wind into the binary environment at a rate of
mag), single brightenings lasting for
weeks to months (e.g. 1985, 1986, 2003, see Fig. 1).
Modeling the UV/IR continuum, Skopal (2005) found a significant
contribution from the nebula in the near-UV/optical that
strengthens during outbursts.
The symbiotic nebula in AG Dra is dense. Material supplied by
the giant's wind into the binary environment at a rate of
![]()
![]() (Skopal 2005) corresponds to number
densities of
(Skopal 2005) corresponds to number
densities of ![]()
![]() cm-3, in between the binary
components and the neighboring regions of similar dimensions.
Therefore, to investigate properties of symbiotic nebula,
we can consider Case B for its radiation
(see Kwok 2000; Osterbrock 1989).
cm-3, in between the binary
components and the neighboring regions of similar dimensions.
Therefore, to investigate properties of symbiotic nebula,
we can consider Case B for its radiation
(see Kwok 2000; Osterbrock 1989).
AG Dra is a halo binary system, placed at a galactic latitude
of +41
![]() with a low reddening. Viotti et al. (1983) found
with a low reddening. Viotti et al. (1983) found
![]() by fitting the 2200 Å
depression on the IUE spectra. Mikolajewska et al. (1995)
re-analyzed several IUE spectra and suggested
by fitting the 2200 Å
depression on the IUE spectra. Mikolajewska et al. (1995)
re-analyzed several IUE spectra and suggested
![]() ,
while Birriel et al. (2000) derived
the extinction value of
,
while Birriel et al. (2000) derived
the extinction value of
![]() mag by
fitting the UV spectra obtained by the Hopkins Ultraviolet
Telescope. These quantities are comparable to the total
reddening through the Galaxy towards AG Dra
(0.07-0.08, Burstein & Heiles 1982), which justifies that the measured
extinction to AG Dra is purely interstellar.
From the Ly
mag by
fitting the UV spectra obtained by the Hopkins Ultraviolet
Telescope. These quantities are comparable to the total
reddening through the Galaxy towards AG Dra
(0.07-0.08, Burstein & Heiles 1982), which justifies that the measured
extinction to AG Dra is purely interstellar.
From the Ly![]() width on high-resolution IUE spectra,
Viotti et al. (1983) estimate the H I column density of
width on high-resolution IUE spectra,
Viotti et al. (1983) estimate the H I column density of
![]() .
Using the Einstein X-ray observations,
Anderson et al. (1981) found
.
Using the Einstein X-ray observations,
Anderson et al. (1981) found
![]() cm-2.
According to the relationship between
cm-2.
According to the relationship between ![]() and
EB-V
(
and
EB-V
(
![]() ,
Diplas & Savage 1994), both these parameters
are consistent.
,
Diplas & Savage 1994), both these parameters
are consistent.
![\begin{figure}
\par\resizebox{18cm}{!}{\includegraphics[angle=-90]{11418fg1.eps}}
\end{figure}](/articles/aa/full_html/2009/45/aa11418-08/img26.png)
|
Figure 1: The U and V light curves of AG Dra from 1977. They are characterized by a series of outbursts with multiple maxima. The data were summarized by Skopal et al. (2007). The right panel shows a detail around the 2003 hot burst with timing of the XMM-Newton (long thin lines) and the FUSE (short thick bars) observations. During the optical maxima, the soft X-ray emission was not detectable (long dashed lines). |
| Open with DEXTER | |
The orbital inclination of the binary is rather low. There are
no signs of eclipses whether in the optical, far-UV, or X-ray
regions (e.g. González-Riestra et al. 2008).
Considering the geometry of the main sources of radiation,
Mikolajewska et al. (1995) estimated a system inclination
![]() and Schmid & Schild (1997), based
on spectropolarimetric observations, suggested
and Schmid & Schild (1997), based
on spectropolarimetric observations, suggested
![]() .
As a result we instead see the hot star from its pole than
the orbital plane, where a disk-like structured material
can be expected (e.g. Mastrodemos & Morris 1998).
Both the low interstellar absorption/extinction and the low
orbital inclination suggest a high transmission of the
interstellar medium (ISM) to soft X-rays, which is consistent
with AG Dra being the brightest system at these energies
among other symbiotics. Therefore, AG Dra has been
frequently observed by X-ray satellites.
.
As a result we instead see the hot star from its pole than
the orbital plane, where a disk-like structured material
can be expected (e.g. Mastrodemos & Morris 1998).
Both the low interstellar absorption/extinction and the low
orbital inclination suggest a high transmission of the
interstellar medium (ISM) to soft X-rays, which is consistent
with AG Dra being the brightest system at these energies
among other symbiotics. Therefore, AG Dra has been
frequently observed by X-ray satellites.
Using the ROSAT observations Greiner et al. (1997) first noted a remarkable decrease in the X-ray flux during the optical (1994 and 1995) maxima, while in the UV and the optical they indicated a large increase in the emission line and continuum fluxes. They ascribed this X-ray/UV flux anticorrelation to a temperature decrease of the hot component. The X-ray history of AG Dra has recently been reviewed and discussed by González-Riestra et al. (2008). They find that the anticorrelation between the X-ray and optical/UV emission appears to be a general feature of AG Dra radiation and is independent of the type and strength of the outburst. They suggest that the WD radiation increases during outbursts, but is strongly absorbed by the circumstellar ionized gas.
Table 1: Log of the used spectroscopic observations.
As the effect of the flux anticorrelation is related to transitions between active and quiescent phases, its understanding thus can aid us in revealing the nature of the Z And-type outbursts. Accordingly, in this paper we investigate the origin of the observed anticorrelation between the supersoft X-ray and the optical/UV fluxes for the case of AG Dra. For this purpose we model its composite continuum within the X-rays - near-IR domain at different levels of the activity. In Sect. 2 we summarize and describe the nearly-simultaneous observations we used to model the continuum. In Sect. 3 we describe our analysis and present the results. Their discussion and summary with conclusions are found in Sects. 4 and 5, respectively.
2 Observations
For this paper we selected observations from
the supersoft X-ray to the near-IR, taken at different
levels of the AG Dra activity.
We analyzed the archival supersoft X-ray data made by the X-ray
Multi-Mirror Telescope (XMM-Newton), including its optical
monitor (XMM-OM) for the near-UV fluxes (Jansen et al. 2001),
the far-UV spectra (988-1082 Å) made with the LiF1A channel
of the Far Ultraviolet Spectroscopic Explorer (FUSE),
the ultraviolet low- and high-resolution spectra taken by
the International Ultraviolet Explorer (IUE),
the optical low-resolution spectrum from the Loiano observatory,
and the flux-points determined by the broad band optical
![]() and near-IR
and near-IR
![]() photometry.
The XMM-Newton and Loiano observations were described in
detail by González-Riestra et al. (2008). The FUSE spectra were processed
according to Skopal et al. (2006).
photometry.
The XMM-Newton and Loiano observations were described in
detail by González-Riestra et al. (2008). The FUSE spectra were processed
according to Skopal et al. (2006).
During quiescent phase we composed the observed SED by
the XMM-Newton and FUSE observations,
complemented with the IUE spectrum (SWP9084/LWR07831)
taken at a similar orbital position.
During the transition phase we selected the near-simultaneous
XMM-Newton and FUSE observations and the
photometric ![]() flux-points from the descending branch of
the 2003 burst (Fig. 1).
To model the SED at the maximum of hot bursts, we used the
ultraviolet XMM-OM fluxes and the optical spectrum,
both from the maximum of the 2003 burst. However, to estimate
the relevant far-UV fluxes we had to use a non-simultaneous
observation. We used well-exposed IUE spectra
(SWP25443/LWP05513) taken around the maximum of the 1985 hot
burst. To match the XMM-OM fluxes, we scaled
the IUE spectrum by a factor of 1.3.
This was possible because hot bursts are similar in their
profiles and colors (see Fig. 1 here and Fig. 6 of González-Riestra et al. 1999, for
UV colors). Their SED shows a dominant contribution from
the nebula to the near-UV/U region, while the hot stellar source
dominates the far-UV region (see Fig. 13 of Skopal 2005).
flux-points from the descending branch of
the 2003 burst (Fig. 1).
To model the SED at the maximum of hot bursts, we used the
ultraviolet XMM-OM fluxes and the optical spectrum,
both from the maximum of the 2003 burst. However, to estimate
the relevant far-UV fluxes we had to use a non-simultaneous
observation. We used well-exposed IUE spectra
(SWP25443/LWP05513) taken around the maximum of the 1985 hot
burst. To match the XMM-OM fluxes, we scaled
the IUE spectrum by a factor of 1.3.
This was possible because hot bursts are similar in their
profiles and colors (see Fig. 1 here and Fig. 6 of González-Riestra et al. 1999, for
UV colors). Their SED shows a dominant contribution from
the nebula to the near-UV/U region, while the hot stellar source
dominates the far-UV region (see Fig. 13 of Skopal 2005).
For the profile-fitting analysis we used the
O VI
![]() doublet on
the FUSE spectra, available from the quiescent and
transition phases. For the optical maximum we analyzed the
He II
doublet on
the FUSE spectra, available from the quiescent and
transition phases. For the optical maximum we analyzed the
He II
![]() line exposed on the high-resolution
IUE spectra (SWP55372 and SWP55373) at the maximum of
the 1995 hot burst. The spectra were calibrated with the aid
of their low-resolution counterparts.
Relevant observations were dereddened with
EB-V = 0.08
and resulting parameters were scaled to a distance of 1.1 kpc
(Skopal 2005; Birriel et al. 2000). Their log and plots are given in
Table 1 and Fig. 2, respectively.
line exposed on the high-resolution
IUE spectra (SWP55372 and SWP55373) at the maximum of
the 1995 hot burst. The spectra were calibrated with the aid
of their low-resolution counterparts.
Relevant observations were dereddened with
EB-V = 0.08
and resulting parameters were scaled to a distance of 1.1 kpc
(Skopal 2005; Birriel et al. 2000). Their log and plots are given in
Table 1 and Fig. 2, respectively.
To estimate the X-ray fluxes we fitted the spectra from the EPIC-pn instrument with the XSPEC software package. According to a very high temperature of the hot stellar source in AG Dra (>105 K, Mürset et al. 1991; Skopal 2005; Greiner et al. 1997; Kenyon & Webbink 1984), we can assume that the supersoft X-ray fluxes are emitted by the WD photosphere. Therefore, we considered a simple temperature blackbody model in fitting our 0.18-0.4 keV data.
The resulting fit to the spectrum from quiescence corresponded
to the blackbody radiation absorbed with the hydrogen column
density
![]() cm-2 and temperature
of
cm-2 and temperature
of ![]() 14.5 eV as in the case of the ROSAT PSPC observations
from quiescence (see Greiner et al. 1997; González-Riestra et al. 2008).
During the transition, the shape of the spectrum was similar,
but the lower signal-to-noise ratio prevented a meaningful fit.
In this case we assumed the same parameters as for the
quiescence spectrum, and thus fitted only the normalization
factor.
Fluxes were derived from these ``unfolded'' models and
the corresponding data/model ratio. This approach implies
that the fluxes obtained by this way are, to a certain extent,
model dependent. However, we are confident that the spectrum
can be represented well by a simple absorbed blackbody model,
which is also supported by the data-minus-model residuals
that are small, flat, and within the errors in the range of
40-70 Å. Here we refer the reader to the paper of
Nowak et al. (2002), who discuss other approaches to obtaining
flux points from X-ray data and the effects connected with
them.
14.5 eV as in the case of the ROSAT PSPC observations
from quiescence (see Greiner et al. 1997; González-Riestra et al. 2008).
During the transition, the shape of the spectrum was similar,
but the lower signal-to-noise ratio prevented a meaningful fit.
In this case we assumed the same parameters as for the
quiescence spectrum, and thus fitted only the normalization
factor.
Fluxes were derived from these ``unfolded'' models and
the corresponding data/model ratio. This approach implies
that the fluxes obtained by this way are, to a certain extent,
model dependent. However, we are confident that the spectrum
can be represented well by a simple absorbed blackbody model,
which is also supported by the data-minus-model residuals
that are small, flat, and within the errors in the range of
40-70 Å. Here we refer the reader to the paper of
Nowak et al. (2002), who discuss other approaches to obtaining
flux points from X-ray data and the effects connected with
them.
To assess influence of the hydrogen column density and the
temperature in the derived fluxes we fitted the data with
a few hundred models covering a wide range of these parameters.
Taking the 30 best-fit cases (in terms of ![]() ), we found
that the fluxes derived from these models differ from
the resulting ones by less than 15% in the range of 30-65 Å.
Uncertainties of the X-ray fluxes derived in this way satisfy
the purposes of this work.
Furthermore, we complemented the X-ray fluxes with those from
the FUSE spectra to determine final parameters of
the radiation produced by the WD photosphere
(see below, Sect. 3.1.1).
), we found
that the fluxes derived from these models differ from
the resulting ones by less than 15% in the range of 30-65 Å.
Uncertainties of the X-ray fluxes derived in this way satisfy
the purposes of this work.
Furthermore, we complemented the X-ray fluxes with those from
the FUSE spectra to determine final parameters of
the radiation produced by the WD photosphere
(see below, Sect. 3.1.1).
3 Analysis and results
3.1 Modeling the composite spectrum
The continuum spectrum of symbiotic stars is composed
of three basic components of radiation - two stellar,
![]() and
and
![]() ,
from the hot
star and the cool giant, respectively, and one nebular,
,
from the hot
star and the cool giant, respectively, and one nebular,
![]() ,
from the ionized gas in the system
(Sect. 1).
Their superposition then yields the observed flux as
,
from the ionized gas in the system
(Sect. 1).
Their superposition then yields the observed flux as
|
(1) |
To achieve our aim we needed to determine physical parameters of the hot stellar and the nebular component of radiation during different stages of the activity. We used the method of disentangling the composite spectrum of S-type symbiotic stars as proposed by Skopal (2005). Observations from the soft X-rays to the near-IR cover all the energy domains well, within which the individual radiation components dominate. This allowed us to model them separately. In the following three sections we describe our approximations of these components of radiation.
3.1.1 The hot star continuum
According to Greiner et al. (1997) and Viotti et al. (2005), the soft
X-ray radiation in AG Dra could be associated with
the hot-star photosphere.
However, the soft X-rays from cosmic sources are significantly
attenuated by absorptions in the ISM, which requires relevant
correction before interpretation
(e.g. Cruddace et al. 1974; Wilms et al. 2000). Assuming that no emission
occurs on the path between the X-ray source and the observer,
we can use the simplest solution of the radiative transfer
equation to correct the observed X-ray flux,
![]() ,
for absorptions as
,
for absorptions as
|
(2) |
where
In addition to the X-ray fluxes from XMM-Newton,
we use the far-UV continuum fluxes between ![]() 1188
and
1188
and ![]() 1000 Å, made nearly simultaneously with
the FUSE satellite (see Fig. 1).
As we analyze both the X-ray and the far-UV data, we consider
attenuation of the light by bound-free absorptions in
the X-ray domain and by the interstellar extinction in
the far-UV spectrum.
According to previous models (see Sect. 2), we approximated
the hot stellar continuum by a blackbody radiation at
a temperature
1000 Å, made nearly simultaneously with
the FUSE satellite (see Fig. 1).
As we analyze both the X-ray and the far-UV data, we consider
attenuation of the light by bound-free absorptions in
the X-ray domain and by the interstellar extinction in
the far-UV spectrum.
According to previous models (see Sect. 2), we approximated
the hot stellar continuum by a blackbody radiation at
a temperature ![]() .
As a result, and in the sense of
Eq. (2), we modeled the hot-star continuum by fitting
the observed X-ray/far-UV fluxes,
.
As a result, and in the sense of
Eq. (2), we modeled the hot-star continuum by fitting
the observed X-ray/far-UV fluxes,
![]() ,
with a function
,
with a function
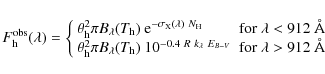
|
(3) |
where the scaling factor

|
(4) |
where
![\begin{figure}
\par\resizebox{18cm}{!}{\includegraphics[angle=-90]{11418fg2.eps}}
\end{figure}](/articles/aa/full_html/2009/45/aa11418-08/img59.png)
|
Figure 2:
Left panels show a comparison of the observed and modeled SEDs
of AG Dra during the hot burst ( top), transition phase ( middle),
and quiescent phase ( bottom) with corresponding residuals.
Open/filled squares are the observed/corrected X-ray fluxes.
They are in units of
|
| Open with DEXTER | |
3.1.2 The nebular continuum
We approximate the nebular component of radiation in the
UV/optical continuum by processes of recombination and thermal
bremsstrahlung in the hydrogen plasma, radiating under the
conditions of the Case B. Validity of this simplification
is supported by the following arguments:
(i) A strong nebular continuum is characterized with
a simple and low electron temperature of
![]() K (Table 3), which suggests
that the nebula is powered mainly by photoionization,
i.e. ionizations by collisions are not important;
(ii) There are no recognizable signatures of the He II
continuum in the IUE spectra (e.g. a jump in emission
at
K (Table 3), which suggests
that the nebula is powered mainly by photoionization,
i.e. ionizations by collisions are not important;
(ii) There are no recognizable signatures of the He II
continuum in the IUE spectra (e.g. a jump in emission
at ![]() 2050 Å and/or a pronounced Paschen series of the
He II recombination lines). Also it is not possible
to separate contributions from the He I continuum,
because of its very similar recombination coefficients to
that of H I (e.g. Brown & Mathews 1970) and a small abundance.
That is why we consider nebular emission only from hydrogen;
(iii) Symbiotic nebulae are relatively very dense (Sect. 1).
This makes the mean-free path of any diffuse Lyman continuum
photons too short to escape the nebula; i.e., the nebula
is optically thick in the Lyman continuum. This means that
the ionizations caused by stellar radiation-field photons
are balanced by recombinations to excited levels of H I,
while the ground state in the recombination process can be
ignored. Therefore we consider Case B for the nebular
radiation;
(iv) Because of the high density, we can neglect contributions
from the two-photon emission.
2050 Å and/or a pronounced Paschen series of the
He II recombination lines). Also it is not possible
to separate contributions from the He I continuum,
because of its very similar recombination coefficients to
that of H I (e.g. Brown & Mathews 1970) and a small abundance.
That is why we consider nebular emission only from hydrogen;
(iii) Symbiotic nebulae are relatively very dense (Sect. 1).
This makes the mean-free path of any diffuse Lyman continuum
photons too short to escape the nebula; i.e., the nebula
is optically thick in the Lyman continuum. This means that
the ionizations caused by stellar radiation-field photons
are balanced by recombinations to excited levels of H I,
while the ground state in the recombination process can be
ignored. Therefore we consider Case B for the nebular
radiation;
(iv) Because of the high density, we can neglect contributions
from the two-photon emission.
According to these simplifications and with the aid of Eq. (11)
in Skopal (2005), the
![]() term in Eq. (1) here
can be expressed as
term in Eq. (1) here
can be expressed as

|
(5) |
where
3.1.3 Radiation from the giant
For the stellar radiation from the giant in AG Dra, we adopt
the model SED according to Skopal (2005). The model is based
on the optical ![]() and the near-IR
and the near-IR
![]() flux points
matched by a synthetic spectrum calculated for the effective
temperature of 4300 K. This spectrum then defines
the first term in Eq. (1),
flux points
matched by a synthetic spectrum calculated for the effective
temperature of 4300 K. This spectrum then defines
the first term in Eq. (1),
![]() .
Its bolometric flux,
.
Its bolometric flux,
![]()
![]() ,
corresponds to the giant's
radius
,
corresponds to the giant's
radius
![]() and the luminosity
and the luminosity
![]() .
.
3.2 Thomson-scattering wings of
O VI  1032, 1038,
and He II 1640 lines
1032, 1038,
and He II 1640 lines
The aim of this section is to model the extended wings of the O VI and He II lines measured at similar levels of the optical brightness, at which the X-ray observations were carried out. In this way we support the results obtained by model SEDs.
Schmid et al. (1999) suggest that the broad wings of the
O VI ![]() 1032 and
1032 and ![]() 1038 resonance lines
could be explained by scattering of the O VI photons
by free electrons. The effect of this process is weak and
wavelength independent, because of a very low and
constant value of the Thomson cross-section,
1038 resonance lines
could be explained by scattering of the O VI photons
by free electrons. The effect of this process is weak and
wavelength independent, because of a very low and
constant value of the Thomson cross-section,
![]() cm2.
However, the densest portions of the symbiotic nebula
(
cm2.
However, the densest portions of the symbiotic nebula
(
![]() cm-3) extending to a few AU
could be optically thick enough for
the electron-scattering process.
Qualitatively, the effect should be more significant during
active phases, because of a surplus of electrons from the
increased hot star wind (e.g. Skopal 2006). Especially,
the strong emission lines of highly ionized elements that
are formed in the densest part of the hot stellar wind
represent the best candidates for a measurable effect
of the Thomson scattering.
cm-3) extending to a few AU
could be optically thick enough for
the electron-scattering process.
Qualitatively, the effect should be more significant during
active phases, because of a surplus of electrons from the
increased hot star wind (e.g. Skopal 2006). Especially,
the strong emission lines of highly ionized elements that
are formed in the densest part of the hot stellar wind
represent the best candidates for a measurable effect
of the Thomson scattering.
To calculate the electron-scattering wing profiles, we adopted the procedure suggested by Münch (1950) that assumes the electron scattering happens in the layer outside the line formation region and that the electrons are segregated from the other opacity sources, which implies no change in the equivalent width of the line. Furthermore we used the expression of Castor et al. (1970) for the resulting scattered line profile and the electron-scattering redistribution function derived by Hummer & Mihalas (1967). This simplified approach was used by many authors, recently by Young et al. (2005).
In our profile-fitting analysis, we approximated the observed
P Cygni-type of the O VI line profiles by two Gaussians
and fitted their broad wings with 2 free
parameters - the electron temperature, ![]() ,
and
the electron-scattering optical depth,
,
and
the electron-scattering optical depth,
![]() .
After removing emission/absorption features and bumps in
the profiles, we fitted the broad wings in the range of about
.
After removing emission/absorption features and bumps in
the profiles, we fitted the broad wings in the range of about
![]() 10 Å around the line cores using 644, 1004, and 370
flux-points in the wing profile from the quiescence, transition,
and burst stages, respectively.
The resulting fits for all three cases have small reduced
10 Å around the line cores using 644, 1004, and 370
flux-points in the wing profile from the quiescence, transition,
and burst stages, respectively.
The resulting fits for all three cases have small reduced
![]() (Table 2, Fig. 2), which implies that
mean residuals are comparable to the errors
of the modeled flux-points. Thus the model fits the broad
wings of the profile well, which confirms their origin in
electron scattering.
A detailed description of our approach will be presented
elsewhere (Sekerás & Skopal 2009, in prep.).
(Table 2, Fig. 2), which implies that
mean residuals are comparable to the errors
of the modeled flux-points. Thus the model fits the broad
wings of the profile well, which confirms their origin in
electron scattering.
A detailed description of our approach will be presented
elsewhere (Sekerás & Skopal 2009, in prep.).
A comparison of our model SEDs and profiles with observations are plotted in Fig. 2 and corresponding parameters are given in Tables 2 and 3.
Table 2: Parameters of the profile-fitting analysis (Sect. 3.2, Fig. 2).
3.3 The SED-fitting analysis
3.3.1 Parameters of the hot stellar source
To derive parameters of the hot stellar source in AG Dra, the following points are relevant:
- (i)
- we dereddened the FUSE fluxes and calculated
the Rayleigh scattering effect around Ly-
 (Eq. (4))
to estimate
(Eq. (4))
to estimate  .
The scattering cross-section,
.
The scattering cross-section,
 ,
was calculated according to
Nussbaumer et al. (1989).
However, numerous and strong absorptions in the FUSE
spectrum did not allow us to determine the parameter unambiguously. Therefore, we could only compare
the Rayleigh attenuated blackbody radiation to the observed
continuum for a reasonable range of
quantities.
We found that the observed depression in the continuum
around Ly-
constrains
to
,
was calculated according to
Nussbaumer et al. (1989).
However, numerous and strong absorptions in the FUSE
spectrum did not allow us to determine the parameter unambiguously. Therefore, we could only compare
the Rayleigh attenuated blackbody radiation to the observed
continuum for a reasonable range of
quantities.
We found that the observed depression in the continuum
around Ly-
constrains
to

 cm-2, which is consistent with
the values suggested by different methods (Sect. 1);
cm-2, which is consistent with
the values suggested by different methods (Sect. 1);
- (ii)
- we calculated a grid of synthetic models of the
function (3) for reasonable ranges of the fitting parameters,
 ,
,
 ,
and .
We compared
models to both the observed X-ray and dereddened UV fluxes,
and used the
,
and .
We compared
models to both the observed X-ray and dereddened UV fluxes,
and used the  statistics to evaluate the fit.
To correct the observed X-ray fluxes for absorptions,
we used the tbabs absorption model
(Tübingen-Boulder absorption ISM model, Wilms et al. 2000).
During the quiescent phase, we fitted 11 X-ray fluxes from 31
to 69 Å and three far-UV flux-points around 1000 Å
(bottom left panel of Fig. 2).
We estimated errors in the X-ray fluxes to be 2-17%
of their mid values, while for the FUSE spectra
we adopted errors as large as 5-10% of the measured
continuum.
The best-fit-model and the flux-point errors yielded
statistics to evaluate the fit.
To correct the observed X-ray fluxes for absorptions,
we used the tbabs absorption model
(Tübingen-Boulder absorption ISM model, Wilms et al. 2000).
During the quiescent phase, we fitted 11 X-ray fluxes from 31
to 69 Å and three far-UV flux-points around 1000 Å
(bottom left panel of Fig. 2).
We estimated errors in the X-ray fluxes to be 2-17%
of their mid values, while for the FUSE spectra
we adopted errors as large as 5-10% of the measured
continuum.
The best-fit-model and the flux-point errors yielded
 and
and
 for 11 degrees
of freedom (d.o.f.). As the model fits the data, the somewhat
larger
for 11 degrees
of freedom (d.o.f.). As the model fits the data, the somewhat
larger
 reflects rather low values of our
error estimates.
During the transition stage, we fitted 7 X-ray fluxes between 43 and 69 Å and three far-UV flux-points. We omitted
fluxes around 20-30 Å, because of their different nature.
They could have been caused by shocks in the nebula. The flux
uncertainties we used were estimated to be in the range
of 7-22%. The resulting fit has a small
reflects rather low values of our
error estimates.
During the transition stage, we fitted 7 X-ray fluxes between 43 and 69 Å and three far-UV flux-points. We omitted
fluxes around 20-30 Å, because of their different nature.
They could have been caused by shocks in the nebula. The flux
uncertainties we used were estimated to be in the range
of 7-22%. The resulting fit has a small
 for 7 d.o.f, which suggests that the model
fits the data very closely, well within their uncertainties.
Corresponding best-fit-model parameters and their derivatives
(the effective radius and the luminosity of the hot stellar
source) are introduced in Table 3;
for 7 d.o.f, which suggests that the model
fits the data very closely, well within their uncertainties.
Corresponding best-fit-model parameters and their derivatives
(the effective radius and the luminosity of the hot stellar
source) are introduced in Table 3;
- (iii)
- during the bursts, when the supersoft X-ray emission is absorbed
entirely, it is impossible to unambiguously determine
the hot star temperature for
 K,
because of a too narrow range of the far-UV fluxes available.
Nevertheless, we can estimate a lower limit to the temperature
of the ionizing source,
K,
because of a too narrow range of the far-UV fluxes available.
Nevertheless, we can estimate a lower limit to the temperature
of the ionizing source,
 ,
at which the hot
star radiation, scaled to the far-UV fluxes, is just
capable of producing the observed EM; i.e., the total number
of ionizing photons just balances the total number
of recombinations.
According to simplifications for the plasma radiation as
introduced in Sect. 3.1.2., we solve the equilibrium equation
(Eq. (6) below) for the temperature
and the scaling
factor
,
at which the hot
star radiation, scaled to the far-UV fluxes, is just
capable of producing the observed EM; i.e., the total number
of ionizing photons just balances the total number
of recombinations.
According to simplifications for the plasma radiation as
introduced in Sect. 3.1.2., we solve the equilibrium equation
(Eq. (6) below) for the temperature
and the scaling
factor
 ,
which determine the flux of ionizing
photons, with the input parameters of the measured nebula,
EM, and
,
which determine the flux of ionizing
photons, with the input parameters of the measured nebula,
EM, and  .
The resulting temperature then
corresponds to
,
at which the hot star
radiation gives rise to the observed nebular emission
(see Skopal 2005, in detail).
.
The resulting temperature then
corresponds to
,
at which the hot star
radiation gives rise to the observed nebular emission
(see Skopal 2005, in detail).
3.3.2 Parameters of the nebula
According to Eq. (1), the nebular component of radiation
can be obtained by subtracting the stellar contributions
from the observed spectrum, i.e.
![]() .
First, we estimated representative continuum fluxes at about
20 wavelengths between 1250 and 3300 Å and complemented
them with photometric U and XMM-OM fluxes, if
available. Uncertainties of the well exposed spectra from
the IUE archive are between 5 and 10% of the measured
values. Errors in the XMM-OM fluxes were estimated
to only a few percent (see Table 2 in González-Riestra et al. 2008).
Uncertainties of classical photometric measurements can
be assumed to be less than 10%. We corrected corresponding
fluxes for the influence of emission lines using our Loiano
spectra (see Skopal 2007, in detail).
Second, we subtracted the contribution of the WD and the
giant, and fitted the function
.
First, we estimated representative continuum fluxes at about
20 wavelengths between 1250 and 3300 Å and complemented
them with photometric U and XMM-OM fluxes, if
available. Uncertainties of the well exposed spectra from
the IUE archive are between 5 and 10% of the measured
values. Errors in the XMM-OM fluxes were estimated
to only a few percent (see Table 2 in González-Riestra et al. 2008).
Uncertainties of classical photometric measurements can
be assumed to be less than 10%. We corrected corresponding
fluxes for the influence of emission lines using our Loiano
spectra (see Skopal 2007, in detail).
Second, we subtracted the contribution of the WD and the
giant, and fitted the function
![]() given
by Eq. (5) to the corrected flux-points to determine the
EM and
given
by Eq. (5) to the corrected flux-points to determine the
EM and ![]() of the symbiotic nebula. Resulting
fits have
of the symbiotic nebula. Resulting
fits have
![]() ,
which proves assumptions
of our simplified model of the nebula (Sect 3.1.2.).
Corresponding plots and parameters are found in Fig. 2 and
Table 3, respectively.
,
which proves assumptions
of our simplified model of the nebula (Sect 3.1.2.).
Corresponding plots and parameters are found in Fig. 2 and
Table 3, respectively.
4 Discussion
4.1 Model SEDs and the flux anticorrelation
Model SEDs show that the light variations in the optica/near-UV, as measured at different levels of activity, are caused exclusively by the variable nebular continuum (Fig. 2, Table 3). Contribution from the hot stellar object can be neglected within this domain, and that from the giant can be assumed to be constant.
Table 3: Parameters of the SED-fitting analysis (see Sect. 3.3, Fig. 2).
The nebular component of radiation represents a fraction of the hot stellar radiation transformed by the ionization/recombination events throughout the symbiotic nebula. The result of this process depends on the number of ionizing photons (| |
= | ||
| = | (6) |
where
According to Eq. (2) and the relatively high values of
![]() in the supersoft X-ray domain,
a small increase in
in the supersoft X-ray domain,
a small increase in ![]() between the source
and the observer produces a significant attenuation
of the
between the source
and the observer produces a significant attenuation
of the
![]() fluxes. For example, comparison
of our XMM-Newton observations from the
transition and quiescent phases shows that the increase
in the
fluxes. For example, comparison
of our XMM-Newton observations from the
transition and quiescent phases shows that the increase
in the ![]() value by a factor of only 1.16 (Table 3)
produces attenuation of the observed fluxes at
value by a factor of only 1.16 (Table 3)
produces attenuation of the observed fluxes at
![]() 0.18 keV by a factor of
0.18 keV by a factor of ![]() 5 (see Fig. 2).
At the maximum of the 2003 burst, the 0.19-0.4 keV
emission was not detectable, in spite of the increase in
both the luminosity and the temperature of the hot source
(Table 3, Fig. 2).
The high limiting quantities of
5 (see Fig. 2).
At the maximum of the 2003 burst, the 0.19-0.4 keV
emission was not detectable, in spite of the increase in
both the luminosity and the temperature of the hot source
(Table 3, Fig. 2).
The high limiting quantities of ![]() and
and ![]() are constrained by the minimum flux of photons capable
of ionizing hydrogen,
are constrained by the minimum flux of photons capable
of ionizing hydrogen,
![]() s-1,
which is required to give rise to the observed high amount
of the emission measure,
s-1,
which is required to give rise to the observed high amount
of the emission measure,
![]() cm-3 (see Eq. (6)).
We found that the value of
cm-3 (see Eq. (6)).
We found that the value of
![]() cm-2 is sufficient to damp
down the model fluxes (
cm-2 is sufficient to damp
down the model fluxes (![]()
![]()
![]() within the 0.19-0.4 keV range) below a detection level
of around 10-16
within the 0.19-0.4 keV range) below a detection level
of around 10-16
![]() for the exposure time used
by XMM-Newton on 2003/10/10.
for the exposure time used
by XMM-Newton on 2003/10/10.
According to the model SEDs, we ascribe the observed flux
anticorrelation to variable wind from the hot star.
The wind particles enrich the plasma surrounding the WD's
photosphere, which increases the number of both the bound-free
absorptions (parametrized by ![]() in the model)
and the free-bound emissions.
The former attenuates the supersoft X-ray fluxes, while
the latter increases the nebular emission.
in the model)
and the free-bound emissions.
The former attenuates the supersoft X-ray fluxes, while
the latter increases the nebular emission.
4.2 Wing profiles and the electron density around the WD
Enhancement of the particle concentration around the hot star
is supported independently by our modeling the electron-scattering
wing profile of the O VI and He II lines.
The model parameter, the optical depth
![]() of
the electron-scattering layer with the thickness r, is
related to its mean electron concentration
of
the electron-scattering layer with the thickness r, is
related to its mean electron concentration
![]() as
as
| (7) |
In spite of the model simplification (Sect. 3.2), we approximate the thickness r of the scattering layer with the radius of the line emitting zone. Having its radius then allows us to estimate the
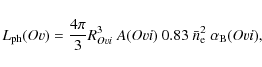
|
(8) |
where the factor 0.83 is the ratio of protons to electrons,
|
(9) |
The
Our model parameters, ![]() and
and ![]() from
the quiescent and transition phases (Table 3), correspond to
from
the quiescent and transition phases (Table 3), correspond to
![]() and
and
![]() s-1,
respectively.
Assuming that all oxygen atoms are ionized to O VI
within the zone, i.e.
s-1,
respectively.
Assuming that all oxygen atoms are ionized to O VI
within the zone, i.e.
![]() (Asplund et al. 2004),
(Asplund et al. 2004),
![]() cm3 s-1 (Gurzadyan 1997),
and
cm3 s-1 (Gurzadyan 1997),
and
![]() from Table 2, yield
from Table 2, yield
![]() cm-3
(
cm-3
(
![]()
![]() ),
and
),
and
![]() cm-3
(
cm-3
(
![]()
![]() )
during quiescence (2004/06/15-24) and the transition
from the burst (2003/11/14-19), respectively.
)
during quiescence (2004/06/15-24) and the transition
from the burst (2003/11/14-19), respectively.
During the optical maximum of the 2003 hot burst, no
FUSE observation was available. Instead, we modeled
the He II
![]() line from the maximum of
the 1995 hot burst (Table 1), because this line is in its major
part also created at a vicinity of the hot star. In contrast
to the quiescent phase, an extended wing profile satisfying
the electron-scattering broadening developed at the bottom of
its intense emission core (
line from the maximum of
the 1995 hot burst (Table 1), because this line is in its major
part also created at a vicinity of the hot star. In contrast
to the quiescent phase, an extended wing profile satisfying
the electron-scattering broadening developed at the bottom of
its intense emission core (![]()
![]()
![]() )
at the optical maximum (see Fig. 2, top right).
A relatively high optical depth,
)
at the optical maximum (see Fig. 2, top right).
A relatively high optical depth,
![]() (Table 2),
(Table 2),
![]() s-1,
s-1,
![]() cm3 s-1 (Nussbaumer & Vogel 1987),
and
cm3 s-1 (Nussbaumer & Vogel 1987),
and
![]() yield
yield
![]() cm-3 (
cm-3 (
![]()
![]() ).
The presence of the broad wings of
the He II
).
The presence of the broad wings of
the He II
![]() line was first pointed out by
Viotti et al. (1983) on the IUE high-resolution spectra
from the 1981 outburst of AG Dra. Simultaneously, they found
signatures of the hot star wind suggested by the P Cygni
profiles of the N V
line was first pointed out by
Viotti et al. (1983) on the IUE high-resolution spectra
from the 1981 outburst of AG Dra. Simultaneously, they found
signatures of the hot star wind suggested by the P Cygni
profiles of the N V
![]() resonance lines.
resonance lines.
4.3 Flux anticorrelation and the nature of bursts
Results of the previous two subsections are mutually
complementary. Both the model SEDs and the profile-fitting
analysis indicate a significant increase in the particle
density around the WD during the bursts of AG Dra.
According to other independent analyses
(see e.g. the H![]() method employed by Skopal 2006),
this increase in the particle density comes from
enhanced wind from the hot star into the surrounding
particle-bounded nebula.
This also explains the nature of this type of the optical
burst, because new emitters will convert the excess of
hydrogen ionizing photons in the nebula into the nebular
radiation that dominates the optical/near-UV.
In turn, this mechanism explains the origin of the
X-ray-optical/UV flux anticorrelation as the result of
variations in the wind from the hot star during different
levels of the star's activity.
method employed by Skopal 2006),
this increase in the particle density comes from
enhanced wind from the hot star into the surrounding
particle-bounded nebula.
This also explains the nature of this type of the optical
burst, because new emitters will convert the excess of
hydrogen ionizing photons in the nebula into the nebular
radiation that dominates the optical/near-UV.
In turn, this mechanism explains the origin of the
X-ray-optical/UV flux anticorrelation as the result of
variations in the wind from the hot star during different
levels of the star's activity.
Having the result of the reprocessing mechanism, i.e. the parameters of the nebular emission and/or of the wing profiles during bursts and quiescence, we can determine the mass loss rate from the accretor. Generally, the increase in the mass-loss rate via the wind can result from an increase in the mass accretion rate due to an accretion-disk instability. In such a case, the enhanced wind provides an important mechanism for removing the angular momentum of rapidly accreted material onto the WD surface (e.g. Warner 1995; Livio 1997; Duschl 1986). From this point of view, the origin of the inverse flux correlation suggests directions for further investigation of the nature of the Z And-type outbursts.
5 Summary and conclusions
In this paper we have investigated the origin of the supersoft
X-ray-optical/UV anticorrelation observed during different
levels of activity of the symbiotic binary AG Dra.
We modeled the composite continuum from the supersoft X-rays
to near-IR during the maximum of the 2003 burst, the following
transition to quiescence and a quiescent phase. We determined
the physical parameters of individual components of radiation
(Fig. 2, Table 3). To support the results obtained by model
SEDs, we fitted the broad wings of the
O VI
![]() and the
He II
and the
He II
![]() lines by the Thomson-scattering
process.
lines by the Thomson-scattering
process.
The resulting profile fits and corresponding parameters are shown in Fig. 2 and Table 2, respectively. The main results can be summarized as follows.
- 1.
- During the quiescent phase, the radiation of the hot stellar
source can be reproduced by a black body with a radius
 and radiating at the temperature
 K,
which yields the luminosity
K,
which yields the luminosity
 .
The X-ray emission was attenuated by absorptions corresponding
to the neutral hydrogen column density
.
The X-ray emission was attenuated by absorptions corresponding
to the neutral hydrogen column density
 cm-2 for the ISM abundances,
which is equivalent to its interstellar value (cf. Sect. 1).
The emission measure of the nebular component of radiation is
cm-2 for the ISM abundances,
which is equivalent to its interstellar value (cf. Sect. 1).
The emission measure of the nebular component of radiation is
 cm-3.
Fitting parameters for the electron-scattering wings of the
O VI doublet (Table 2) and the number of
cm-3.
Fitting parameters for the electron-scattering wings of the
O VI doublet (Table 2) and the number of
 photons from the model SED (Sect. 4.2)
correspond to the mean electron concentration around the hot
star,
photons from the model SED (Sect. 4.2)
correspond to the mean electron concentration around the hot
star,
 cm-3.
cm-3.
- 2.
- During the transition phase, these parameters changed to
 ,
,
 K,
K,
 ,
and the absorption of the X-ray fluxes corresponded to
,
and the absorption of the X-ray fluxes corresponded to
 cm-2.
The larger quantity of the parameter reflects
an increase in the bound-free absorptions due to an enhanced
wind from the hot star.
As a result the X-ray fluxes decreased relative to
their values from quiescence.
In contrast, the nebular emission increased to
cm-2.
The larger quantity of the parameter reflects
an increase in the bound-free absorptions due to an enhanced
wind from the hot star.
As a result the X-ray fluxes decreased relative to
their values from quiescence.
In contrast, the nebular emission increased to
 cm-3.
Simultaneously, the flux of the broad O VI wings was
by a factor of 2 larger than during quiescence and
the model parameters (Tables 2 and 3, Eq. (9)) yield
a significantly higher density of
cm-3.
Simultaneously, the flux of the broad O VI wings was
by a factor of 2 larger than during quiescence and
the model parameters (Tables 2 and 3, Eq. (9)) yield
a significantly higher density of
 cm-3
around the hot star, within the O VI zone.
cm-3
around the hot star, within the O VI zone.
- 3.
- During the burst, the high limiting quantities,
 K
and
K
and
 ,
are required to produce the observed large amount of
,
are required to produce the observed large amount of
 cm-3.
The negative detection of the supersoft X-ray emission
constrains a significant absorption effect that can
be parametrized with
cm-3.
The negative detection of the supersoft X-ray emission
constrains a significant absorption effect that can
be parametrized with
 cm-2.
The strong and extended wings of the He II 1640
line (Fig. 2) imply a large value of
cm-2.
The strong and extended wings of the He II 1640
line (Fig. 2) imply a large value of
 cm-3 (Eq. (9)).
- (i)
- The model SED demonstrated that the supersoft X-ray emission is produced by the WD photosphere. The X-ray and far-UV fluxes allowed us to determine its temperature unambiguously.
- (ii)
- The WD's continuum spectrum is modified by the circumstellar and interstellar material in the line of sight.
- (iii)
- We found that the source of the opacity, causing the observed anticorrelation between the X-ray and optical/UV fluxes, can be associated with the hot star wind, which enhances during active phases of symbiotic binaries (see Skopal 2006).
- (iv)
- The higher mass loss rate increases the particle density in the vicinity of the WD. This event increases the number of bound-free absorptions in the line of sight, which leads to a significant attenuation of the supersoft X-ray photons, and consequently, the free-bound transitions under the Case B increases the nebular emission that dominates the optical/near-UV.
- (v)
- The origin of the X-ray-optical/UV flux anticorrelation explains the nature of bursts in AG Dra by reprocessing high-energy photons into the optical through the ionization/recombination events. Understanding the inverse relationship between optical and X-ray fluxes represents an important ingredient in the investigation of the Z And-type outbursts.
This work is in part based on observations obtained with XMM-Newton, an ESA science mission with instruments and contributions directly funded by ESA Member States and NASA. The far ultraviolet data presented in this paper were obtained from the Multimission Archive at the Space Telescope Science Institute (MAST). They were made with the NASA-CNES-CSA Far Ultraviolet Spectroscopic Explorer. FUSE was operated for NASA by the Johns Hopkins University under NASA contract NAS5-32985. The optical spectra were obtained from the archive of the Loiano Station of the Bologna Atsronomical Observatory. This research was in part supported by a grant of the Slovak Academy of Sciences No. 2/7010/27. The authors are grateful to the anonymous referee for critical comments and constructive suggestions.
References
- Anderson, C. M., Cassinelli, J. P., & Sanders, W. T. 1981, ApJ, 247, L127 [NASA ADS] [CrossRef]
- Asplund, M., Grevesse, N., Sauval, A. J., et al. 2004, A&A, 417, 751 [NASA ADS] [CrossRef] [EDP Sciences]
- Brown, R. L., & Mathews, W. G. 1970, ApJ, 160, 939 [NASA ADS] [CrossRef]
- Burstein, D., & Heiles, C. 1982, AJ, 87, 1165 [NASA ADS] [CrossRef]
- Birriel, J. J., Espey, B. R., & Schutle-Ladbeck, R. E. 2000, ApJ, 545, 1020 [NASA ADS] [CrossRef]
- Cardelli, J. A., Clayton, G. C., & Mathis, J. S. 1989, ApJ, 345, 245 [CrossRef]
- Castor, J. I., Smith, L. F., & van Blerkom, D. 1970, ApJ, 159, 1119 [NASA ADS] [CrossRef]
- Corradi, R. L. M., Mikolajewska, J., & Mahoney, T. J. 2003, Symbiotic Stars Probing Stellar Evolution, ASP Conf. Ser., 303 (San Francisco: ASP)
- Cruddace, R., Paresce, F., Bowyer, S., & Lampton, M. 1974, ApJ, 187, 497 [NASA ADS] [CrossRef]
- Diplas, A., & Savage, B. D. 1994, ApJ, 427, 274 [NASA ADS] [CrossRef]
- Duschl, W. J. 1986, A&A, 163, 56 [NASA ADS]
- Fekel, F. C., Hinkle, K. H., Joyce, R. R., & Skrutskie, M. 2000, AJ, 120, 3255 [NASA ADS] [CrossRef]
- González-Riestra, R., Viotti, R., Iijima, T., & Greiner, J. 1999, A&A, 347, 478 [NASA ADS]
- González-Riestra, R., Viotti, R. F., Iijima, T., et al. 2008, A&A, 481, 725 [NASA ADS] [CrossRef] [EDP Sciences]
- Greiner, J., Bickert, K., Luthardt, R., et al. 1997, A&A, 322, 576 [NASA ADS]
- Gurzadyan, G. A. 1997, The Physics and Dynamics of Planetary Nebulae (Berlin: Springer-Verlag), 50
- Hummer, D. G., & Mihalas, D. 1967, ApJ, 150, L57 [NASA ADS] [CrossRef]
- Isliker, H., Nussbaumer, H., & Vogel, M. 1989, A&A, 219, 271 [NASA ADS]
- Jansen, F., Lumb, D., Altieri, B., et al. 2001, A&A, 365, L1 [NASA ADS] [CrossRef] [EDP Sciences]
- Kenyon, S. J., & Webbink, R. F. 1984, ApJ, 279, 252 [NASA ADS] [CrossRef]
- Kwok, S. 2000, The Origin and Evolution of Planetary Nebulae (Cambridge: Cambridge University Press), 13
- Livio, M. 1997, in Accretion Phenomena and Related Outflows, ed. D. T. Wickramashinge, G. V. Bicknell, & L. Ferrario (San Francisco: ASP), ASP Conf. Ser. 121, 845
- Mastrodemos, N., & Morris, M. 1998, ApJ, 497, 303 [NASA ADS] [CrossRef]
- Mikolajewska, J., Kenyon, S. J., Mikolajewski, M, Garcia, M. R., & Polidan, R. S. 1995, AJ, 109, 1289 [NASA ADS] [CrossRef]
- Münch, G. 1950, ApJ, 112, 266 [NASA ADS] [CrossRef]
- Mürset, U., & Schmid, H. M. 1999, A&AS, 137, 473 [NASA ADS] [CrossRef] [EDP Sciences]
- Mürset, U., Nussbaumer, H., Schmid, H. M., & Vogel, M. 1991, A&A, 248, 458 [NASA ADS]
- Nowak, M. A., Wilms, J., & Dove, J. B. 2002, MNRAS, 332, 856 [NASA ADS] [CrossRef]
- Nussbaumer, H., & Vogel, M. 1987, A&A, 182, 51 [NASA ADS]
- Nussbaumer, H., Schmid, H. M., & Vogel, M. 1989, A&A, 211, L27 [NASA ADS]
- Osterbrock, D. E. 1989, Astrophysics of Gaseous Nebulae and Active Galactic Nuclei (San Francisco: W. H. Freeman and Company Press)
- Schmid, H. M., & Schild, H. 1997, A&A, 321, 791 [NASA ADS]
- Schmid, H. M., Krautter, J., Appenzeller, I., et al. 1999, A&A, 348, 950 [NASA ADS]
- Seaquist, E. R., Taylor, A. R., & Button, S. 1984, ApJ, 284, 202 [NASA ADS] [CrossRef]
- Skopal, A. 2001, A&A, 366, 157 [NASA ADS] [CrossRef] [EDP Sciences]
- Skopal, A. 2005, A&A, 440, 995 [NASA ADS] [CrossRef] [EDP Sciences]
- Skopal, A. 2006, A&A, 457, 1003 [NASA ADS] [CrossRef] [EDP Sciences]
- Skopal, A. 2007, New. Astron., 12, 597 [NASA ADS] [CrossRef]
- Skopal, A., Vittone, A. A., Errico, L., et al. 2006, A&A, 453, 279 [NASA ADS] [CrossRef] [EDP Sciences]
- Skopal, A., Vanko, M., Pribulla, T., et al. 2007, Astron. Nachr., 328, 909 [NASA ADS] [CrossRef]
- Sokoloski, J. L., Kenyon, S. J., Espey, B. R., et al. 2006, ApJ, 636, 1002 [NASA ADS] [CrossRef]
- Viotti, R., Ricciardi, O., Ponz, D., et al. 1983, A&A, 119, 285 [NASA ADS]
- Viotti, R., Altamore, A., Baratta, G. B., Cassatella, A., & Friedjung, M. 1984, ApJ, 283, 226 [NASA ADS] [CrossRef]
- Viotti, R. F., González-Riestra, R., Iijima, T., et al. 2005, Ap&SS, 296, 435 [NASA ADS] [CrossRef]
- Warner, B. 1995, Cataclysmic variable stars (Cambridge, New York: Cambridge University Press)
- Wegner, W. 2003, Astron. Nachr., 324, 219 [NASA ADS] [CrossRef]
- Wilms, J., Allen, A., & McCray, R. 2000, ApJ, 542, 914 [NASA ADS] [CrossRef]
- Young, P. R., Dupree, A. K., Espey, B. R., Kenyon, S. J., & Ake, T. B. 2005, ApJ, 618, 891 [NASA ADS] [CrossRef]
All Tables
Table 1: Log of the used spectroscopic observations.
Table 2: Parameters of the profile-fitting analysis (Sect. 3.2, Fig. 2).
Table 3: Parameters of the SED-fitting analysis (see Sect. 3.3, Fig. 2).
All Figures
|
|
Figure 1: The U and V light curves of AG Dra from 1977. They are characterized by a series of outbursts with multiple maxima. The data were summarized by Skopal et al. (2007). The right panel shows a detail around the 2003 hot burst with timing of the XMM-Newton (long thin lines) and the FUSE (short thick bars) observations. During the optical maxima, the soft X-ray emission was not detectable (long dashed lines). |
| Open with DEXTER | |
| In the text | |
|
|
Figure 2:
Left panels show a comparison of the observed and modeled SEDs
of AG Dra during the hot burst ( top), transition phase ( middle),
and quiescent phase ( bottom) with corresponding residuals.
Open/filled squares are the observed/corrected X-ray fluxes.
They are in units of
|
| Open with DEXTER | |
| In the text | |
Copyright ESO 2009
Current usage metrics show cumulative count of Article Views (full-text article views including HTML views, PDF and ePub downloads, according to the available data) and Abstracts Views on Vision4Press platform.
Data correspond to usage on the plateform after 2015. The current usage metrics is available 48-96 hours after online publication and is updated daily on week days.
Initial download of the metrics may take a while.