


Fig. 5
Download original image
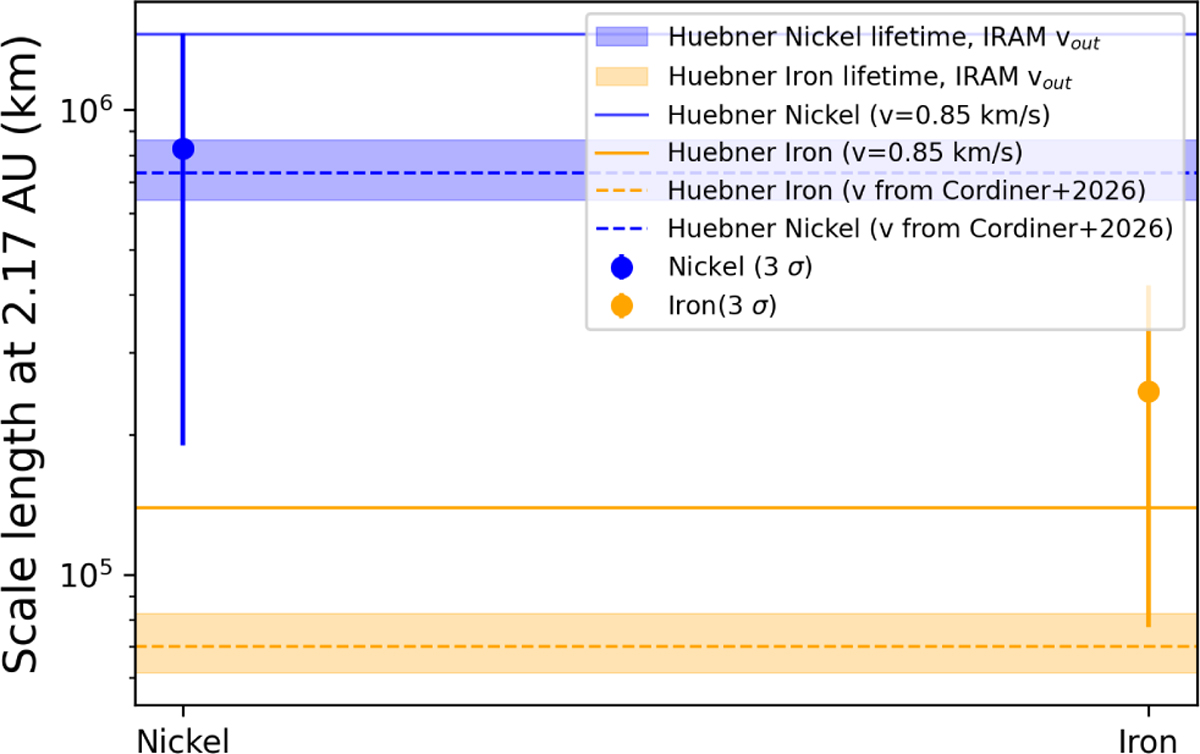
Comparison between the computed iron and nickel parent scale lengths (with 3σ error bars) and the photoionisation values from Huebner & Mukherjee (2015). Different outflow velocities are shown: the highlighted region corresponds to the range of parent scale lengths obtained using the HCN outflow velocity from Biver et al. (2026); the segmented lines indicate the HCN scale lengths derived from ALMA observations (Roth et al. 2026); and the solid lines represent the scale lengths computed using the standard ![Mathematical equation: $\[0.85 ~r_{h}^{-0.5}\]$](/articles/aa/full_html/2026/08/aa60649-26/aa60649-26-eq32.png) km s−1 outflow velocity law.
km s−1 outflow velocity law.
Current usage metrics show cumulative count of Article Views (full-text article views including HTML views, PDF and ePub downloads, according to the available data) and Abstracts Views on Vision4Press platform.
Data correspond to usage on the plateform after 2015. The current usage metrics is available 48-96 hours after online publication and is updated daily on week days.
Initial download of the metrics may take a while.