


Fig. 8
Download original image
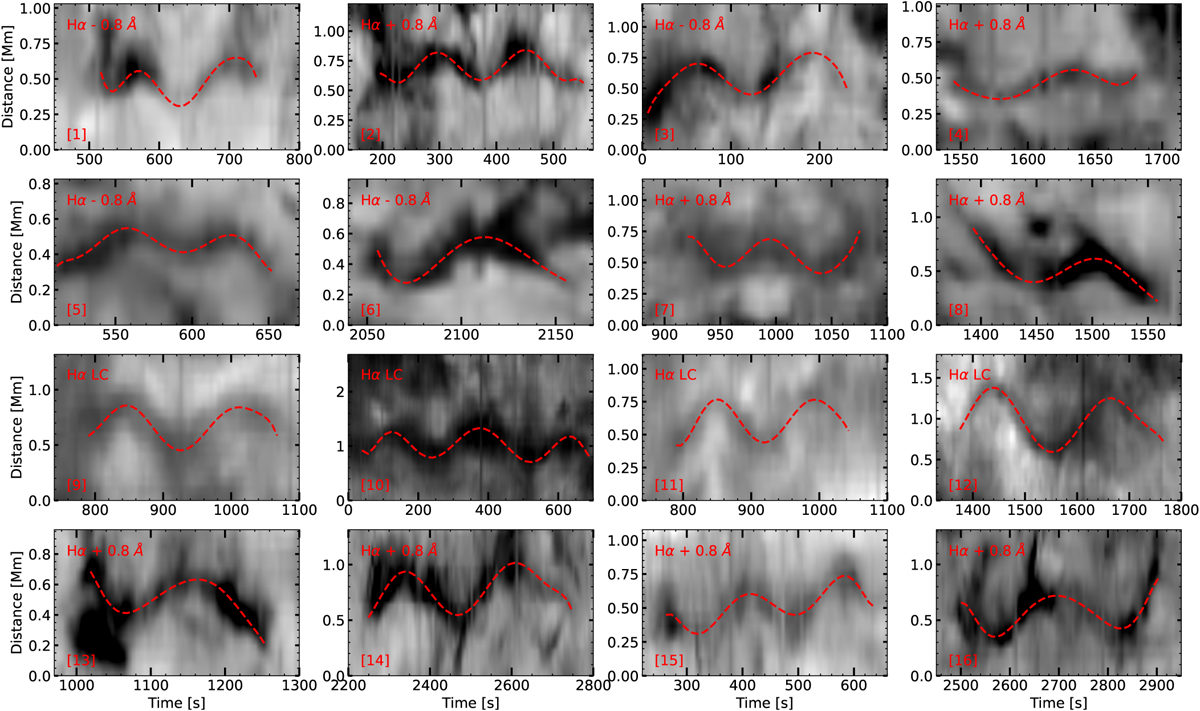
Space-time diagrams for the 16 locations marked in Fig. 5, illustrating the transverse oscillations of the spicules. The panels show SST Hα −0.8 Å, Hα line-center, and Hα +0.8 Å observations, as indicated. The horizontal axis represents time, and the vertical axis shows the transverse displacement (distance) in megameters. The dashed red curves represent polynomial fits to the transverse motion of the spicule axis. The numbers in the lower-left corner of each panel correspond to the slit identification numbers shown in Fig. 5. The derived wave parameters are listed in Table 1.
Current usage metrics show cumulative count of Article Views (full-text article views including HTML views, PDF and ePub downloads, according to the available data) and Abstracts Views on Vision4Press platform.
Data correspond to usage on the plateform after 2015. The current usage metrics is available 48-96 hours after online publication and is updated daily on week days.
Initial download of the metrics may take a while.