


Fig. 7
Download original image
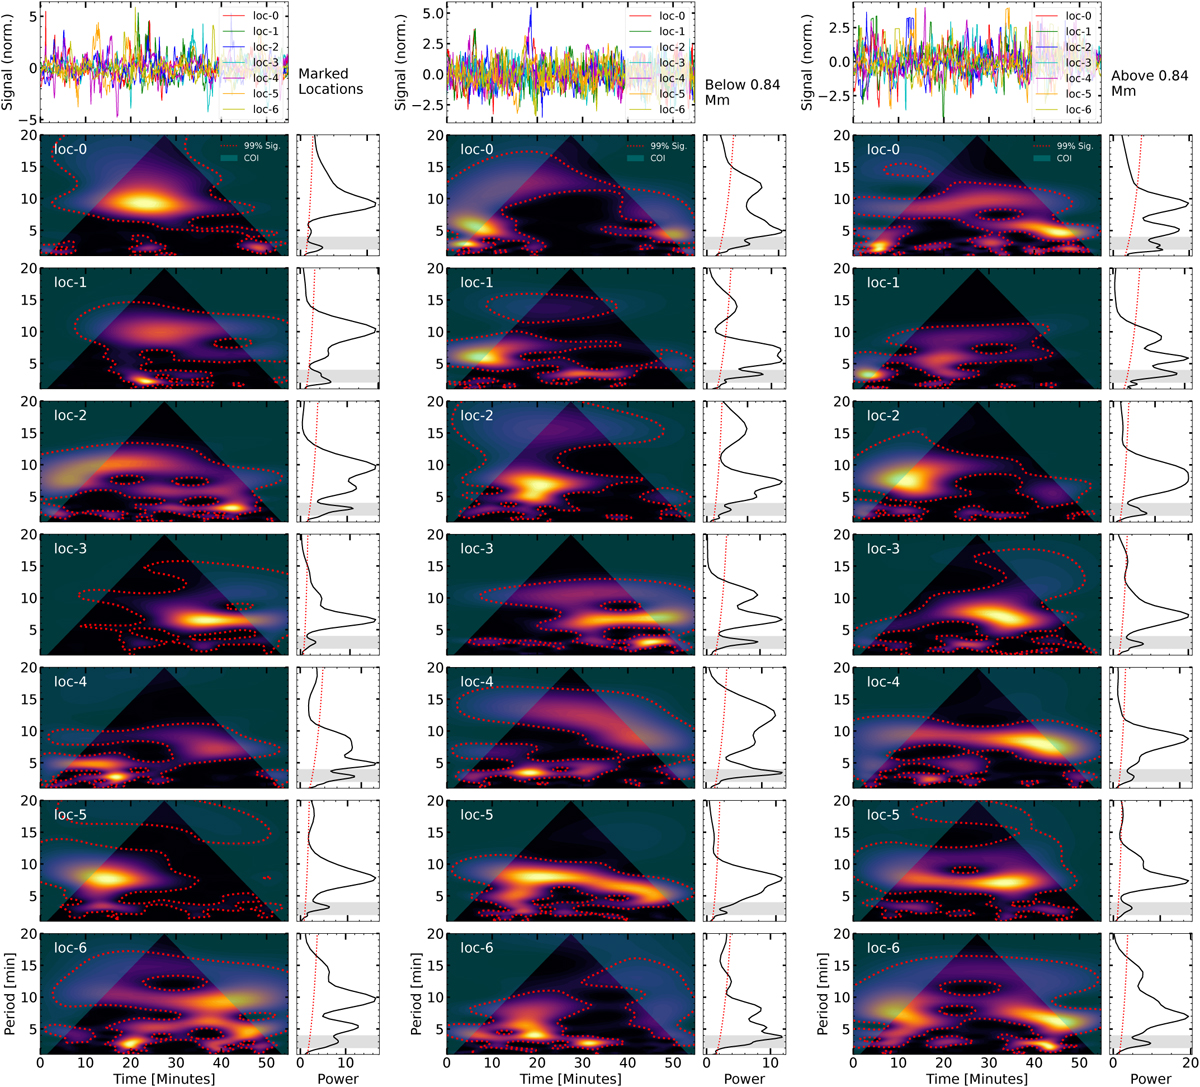
Wavelet analysis of the Hα line-center velocity fluctuations at the seven selected locations shown in Fig. 5. Left: results at the reference locations along the IRIS slit. Middle and right: corresponding wavelet power spectra at positions approximately 0.84 Mm below and 0.84 Mm above the reference locations, respectively. Top subpanel (in each panel): normalized velocity time series. The color map represents the wavelet power as a function of time and period, with the dotted red contours indicating the 99% confidence level. The cross-hatched regions mark the cone of influence. Rightmost subpanels: corresponding global wavelet power spectra, with the dotted red line indicating the 99% significance level. The gray-shaded region represents the period range between 2 and 4 minutes.
Current usage metrics show cumulative count of Article Views (full-text article views including HTML views, PDF and ePub downloads, according to the available data) and Abstracts Views on Vision4Press platform.
Data correspond to usage on the plateform after 2015. The current usage metrics is available 48-96 hours after online publication and is updated daily on week days.
Initial download of the metrics may take a while.